

Cartoon – Dying of Status Quo


The Trump administration has made a flurry of recent moves aimed at lowering the cost of prescription drugs, including cutting deals with some of America’s top drugmakers and launching a new website to help consumers shop for the best available prices. We recently asked 10 experts — including health economists, drug policy scholars and industry insiders — to evaluate the likely impact of those maneuvers. Their verdict: Most are unlikely to deliver substantive savings, at least based on what we know today.
So, we followed up: If those moves won’t work, what could the administration do that would make a meaningful dent in America’s drug spending?
Here are three key ideas from the experts:
1. Expand Medicare’s new power to directly negotiate prices with drugmakers.
Compared to Trump’s recent ad hoc approach to cutting confidential deals with individual drug companies, some experts say building on Medicare’s new power to negotiate could offer a more sweeping, and potentially lasting, path to savings.
For example, Trump’s team could use the price negotiations to seek steeper discounts than the Biden administration did. Federal officials could also establish a more transparent and predictable formula for future negotiations — similar to the approaches used by other nations — and publish that framework so private insurance plans could use it to drive better deals with drugmakers, too.
Finally, the White House could urge lawmakers to loosen some of the limits Democrats in Congress placed on this power when they passed the law back in 2022. Medicare can currently only negotiate the price of drugs that have been on the market for at least several years — often after the medicines have already made drug companies billions of dollars.
Ideally, said Vanderbilt professor Stacie Dusetzina, “you would negotiate a value-based price at the time a product arrives on the market” — that’s what nations like France and England do.
2. Identify and fix policies that encourage wasteful spending on medicines.
“There are policies within everything — from the tax code to Medicare and Medicaid to health insurance regulations — that are driving up drug prices in this country,” said Michael Cannon, who directs health policy studies at the Cato Institute.
One example Cannon sees as wasteful: the formula that Medicare uses to pay for drugs administered by doctors, such as chemotherapy infusions. Those doctors typically get paid 106% of the price of whichever medicine they prescribe, creating a potential incentive to choose those that are most expensive — even in cases where cheaper alternatives might be available.
And that, according to Cannon, is just the tip of the “policy failure” iceberg.
The Trump administration is taking early steps to reform at least one federal drug-pricing policy, known as 340B, which lets some hospitals and clinics purchase drugs at a discount. More than $60 billion a year now flow through this program, whose growth has exploded in recent years. But researchers, auditors and lawmakers like Republican Sen. Bill Cassidy have questioned where all of that money is going and whether it’s making medicines affordable for as many patients as it should.
3. Speed up access to cheaper generic drugs.
Generic drugs — cheaper, copycat versions of brand-name medicines — can slash costs for patients and insurers by as much as 80% once they come to market. But this price-plunging competition often takes more than a decade to arrive.
That’s, in part, because drug companies have found a host of ways to game the U.S. patent system to protect and prolong their monopolies. Law professor Rachel Sachs at Washington University in St. Louis suggested Trump not only close those loopholes, but also make its own creative use of patents.
Federal officials could, for example, invoke an obscure law known as Section 1498, she said. That provision allows the U.S. government to effectively infringe on a patent to buy or make on the cheap certain medicines that meet an extraordinary need of the country. Sachs suggested that the drug semaglutide — the active ingredient in Ozempic, Wegovy and several other weight-loss medicines — might make for an ideal target.
“The statutory authority is already there for them to do it,” Sachs said. “It’s not clear to me why they haven’t.”
Semaglutide, which earned drugmakers more than $20 billion last year alone, will otherwise remain under patent in the U.S. until early next decade.
The Trump administration issued an executive order back in April signaling at least a high level of interest in some of these ideas — and a host of others, too. On the other hand, Trump and Congressional Republicans have made moves this year that have weakened some of these potential cost-cutting tools, such as Medicare’s power to negotiate drug prices. A key provision of July’s ‘Big Beautiful Bill,’ for example, shielded more medicines from those negotiations, eroding the government’s potential savings by nearly $9 billion over the next decade.
We should all get a better read soon on just how interested this administration is in cutting prices: Federal officials are expected to announce the results of their latest round of Medicare negotiations by the end of November.
We learned yesterday that the average cost of a family health insurance policy through an employer reached nearly $27,000 this year, 6% higher than what it cost in 2024. As if that weren’t alarming enough, researchers are predicting that the total likely will soar toward $30,000 next year because of rising medical costs and the unrelenting pressure insurers are under from Wall Street to increase their profits. Small businesses will be hit the hardest.
Despite repeated assurances from insurers that we can count on them to hold down the cost of health care – and consequently the premiums they charge – there are now many years of evidence – from researchers like KFF, which tracks annual changes in employer-sponsored coverage – that they have not and cannot deliver on their promises.
Nevertheless, Big Insurance is doing just fine financially as they force America’s employers and workers to shell out increasingly absurd amounts of money for policies that actually cover less than they did ten years ago. A health insurance policy today is generally less valuable than it was a decade ago because families have to spend more and more money out of their own pockets every year before their coverage kicks in. In addition, they are far more likely to be notified that their insurers will not cover the care their doctors say they need.
When you look at KFF’s reports over time, you’ll see that the cost of a family policy has increased 60% since 2014 when it cost an average of $16,834. That is a rate of increase much higher than general inflation and also higher than medical inflation.
Not only has the total cost of an employer-sponsored plan skyrocketed, so has the share of premiums workers must pay. This year, employers deducted an average of $6,850 from their workers’ paychecks for family coverage, up from $4,823 in 2014, a 42% increase.
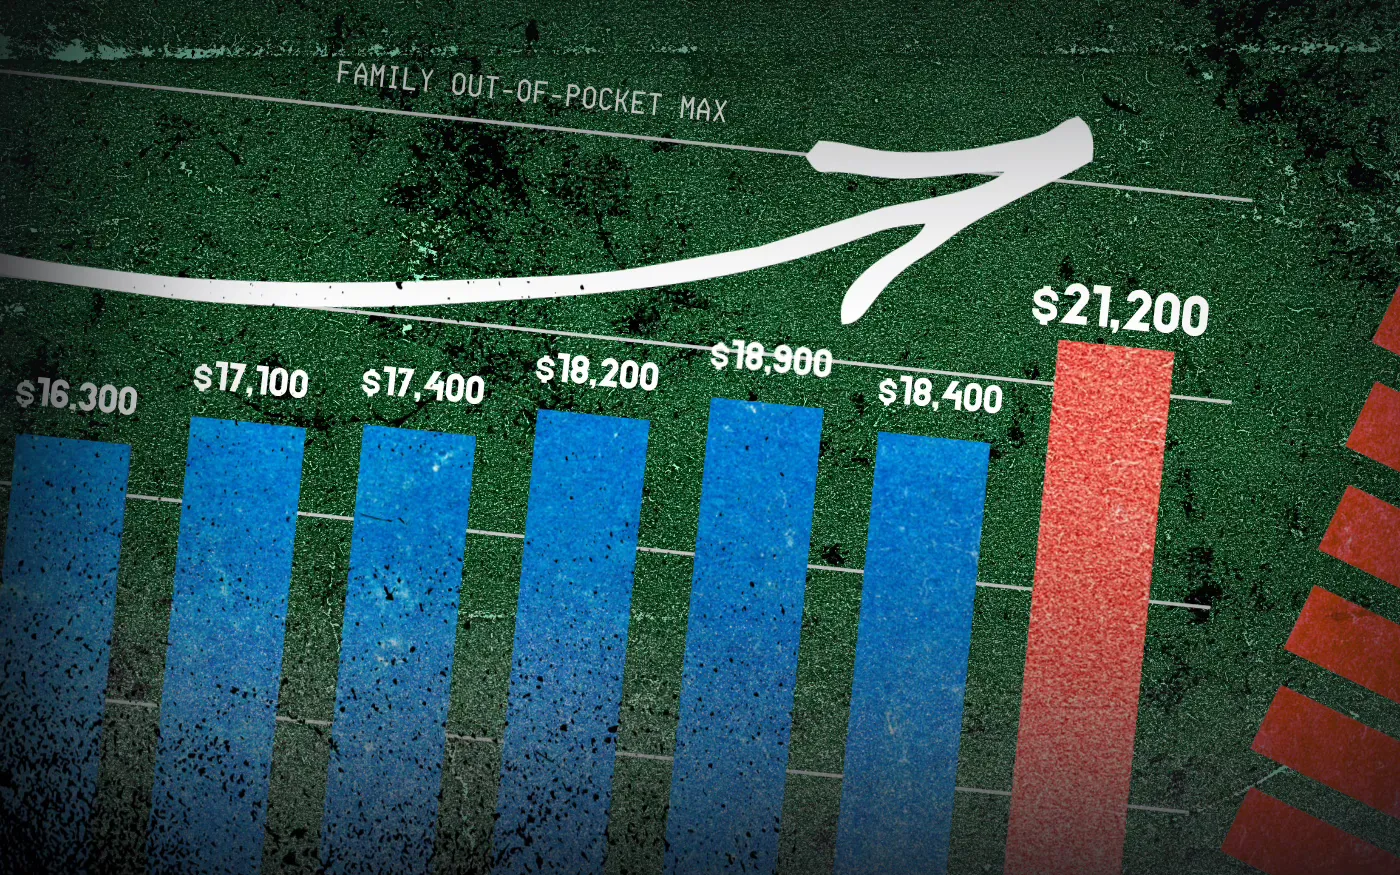
And as premiums have risen, so has the amount of money workers and their dependents are required to spend out of their pockets in deductibles, copayments and coinsurance. The Affordable Care Act, to its credit, instituted a cap on out-of-pocket expenses in 2014, but that cap has been increasing annually along with premiums. (The U.S. Department of Health & Human Services sets the out-of-pocket max every year, pegging it to the average increase in premiums.)
In 2014 the out-of-pocket cap for a family policy was $12,700. Next year, it will rise to $21,200 – a 67% increase. And keep in mind that the cap only applies to in-network care. If you go out of your insurer’s network or take a medication not covered under your policy, you can be on the hook for hundreds or thousands more. While most employer-sponsored plans have caps that are considerably lower, many individuals and families reach the legal max every year.
Meanwhile, the seven biggest for-profit health insurers have made hundreds of billions in profits since 2014 as they have jacked up premiums and out-of-pocket requirements and erected numerous barriers, including the aggressive use of prior authorization, that make it more difficult for Americans to get the care and medications they need. Collectively, those seven companies made $71.3 billion in profits last year alone. That was up slightly from $70.7 billion in 2023. Insurers said their 2024 profits were somewhat depressed because more of their health plan enrollees went to the doctor and picked up their prescriptions last year. Investors were furious that insurers couldn’t keep that from happening, as you’ll see in the charts below. Many of them sold some or all of their shares, sending insurers’ stock prices down. But overall, the stock prices of the big insurance conglomerates have increased steadily over the years as we and our employers have had to spend more for policies that cover less.
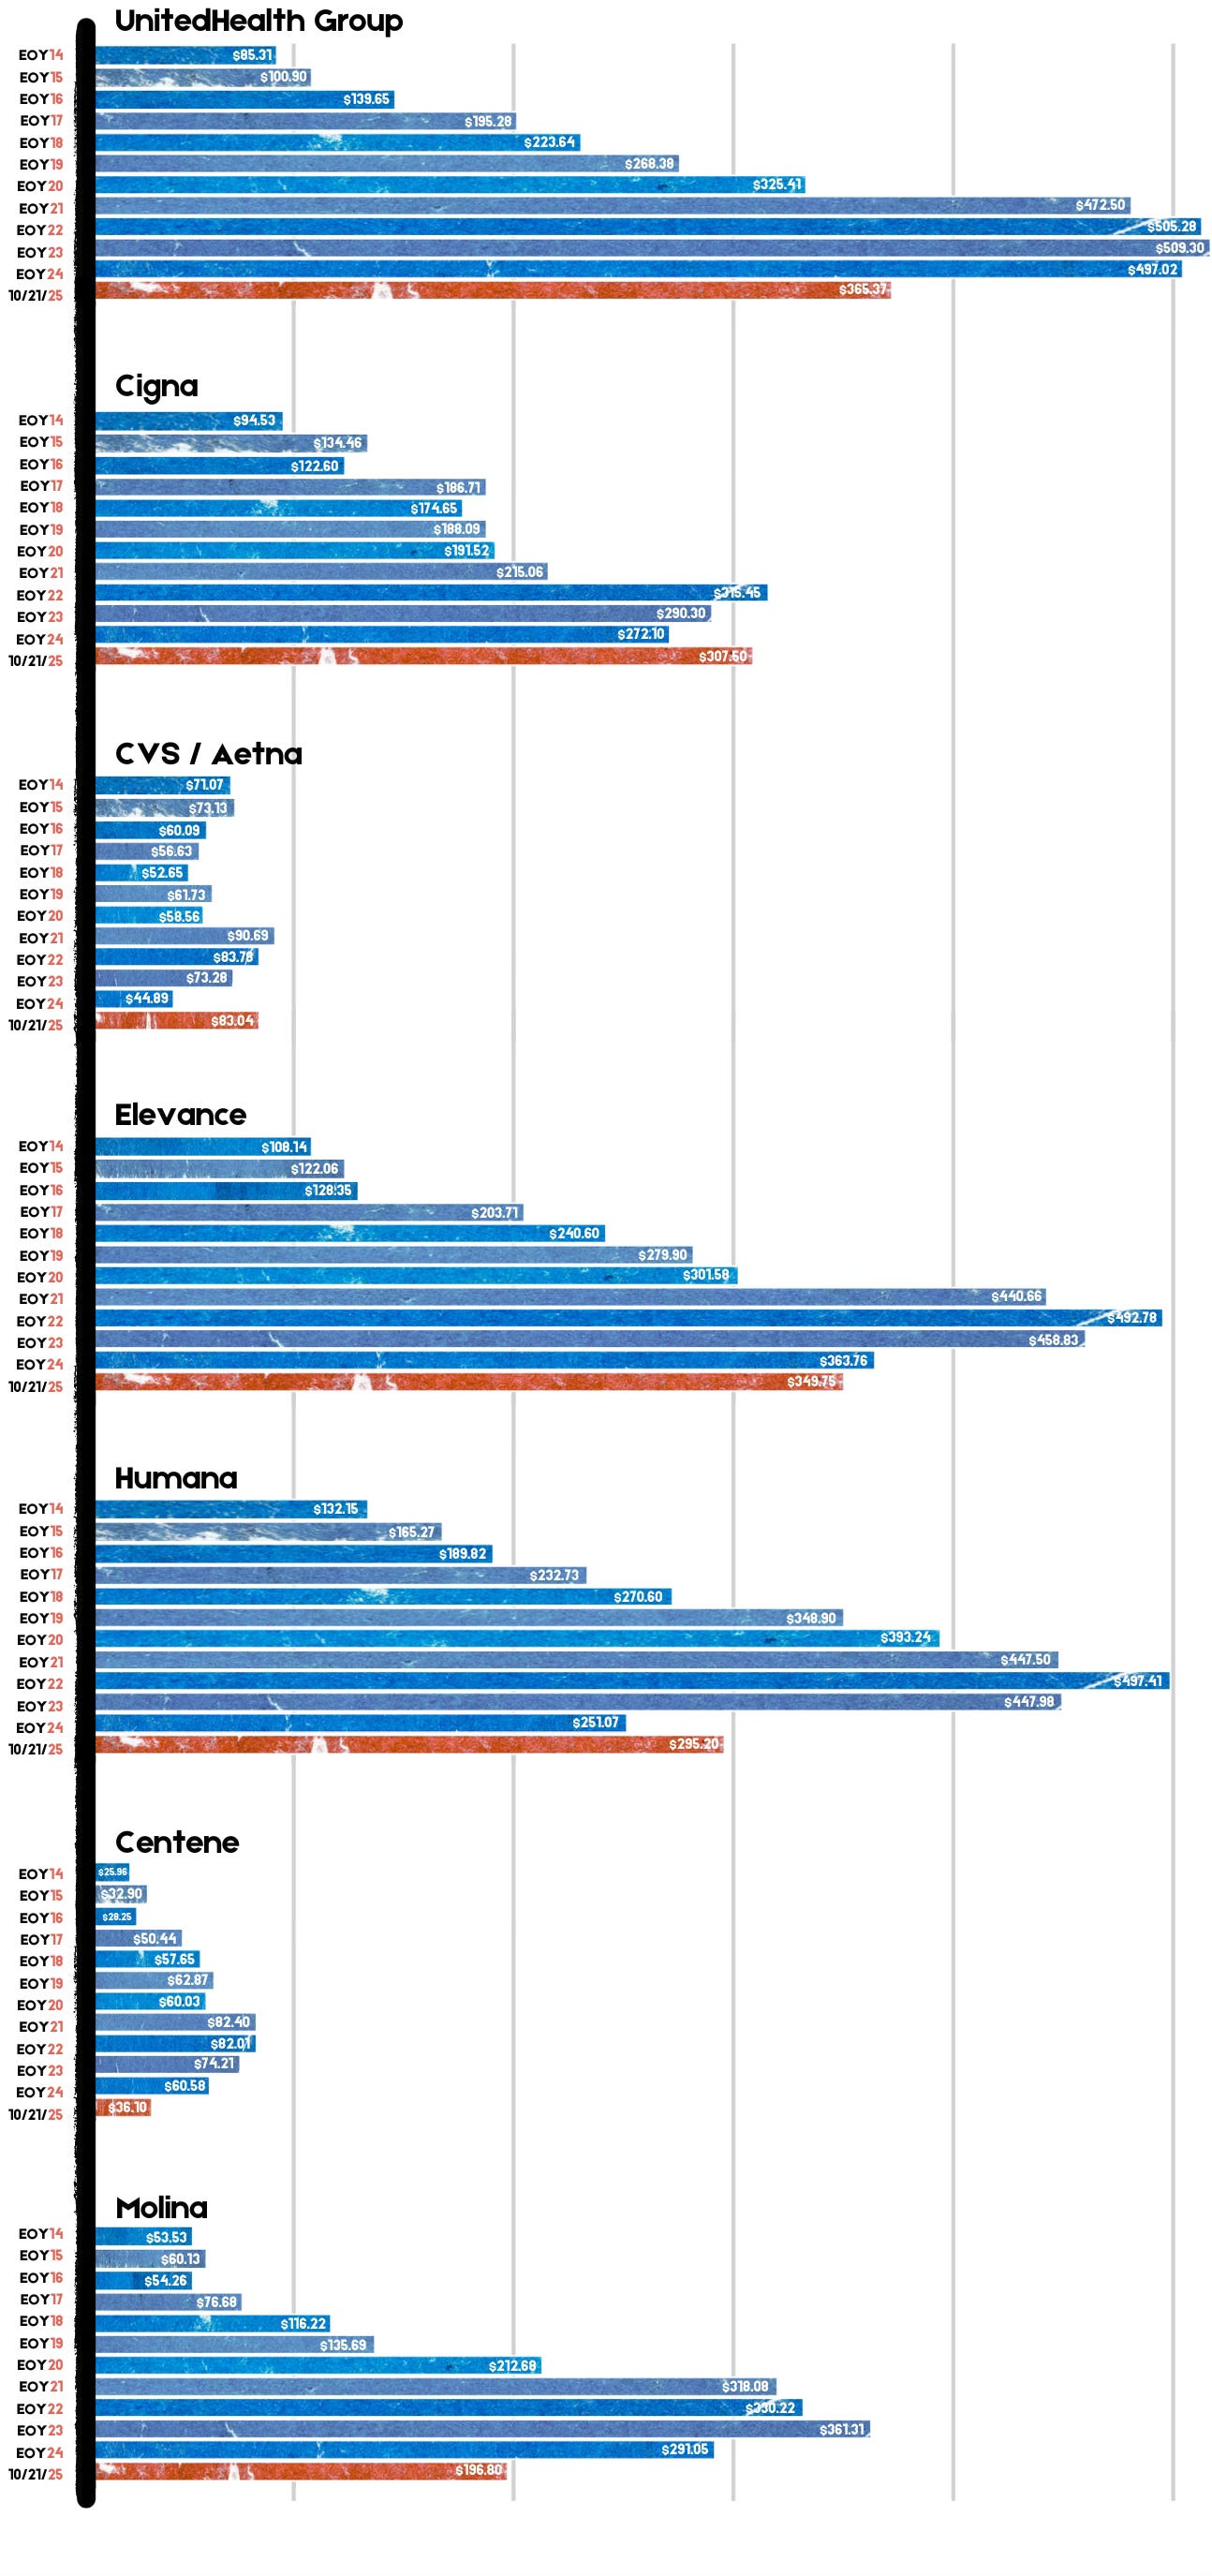
For example, UnitedHealth Group, the biggest of the seven, saw its stock price increase 483% between 2014 and 2024 – from $85.31 a share on Dec. 31, 2014, to $497.02 on Dec. 31, 2024. Most of the other companies saw similar growth in their shares over that time period.
By contrast, the Dow Jones Industrial Average increased 139% (from $17,823.07 to $42,544.22), and the S&P 500 increased 186% (from $2,058.90 to $5,881.63) during the same period.
Back to those premiums and out-of-pocket requirements. While the KFF numbers pertain to employer-sponsored coverage, people who have to buy health insurance on their own – mostly through the ACA (Obamacare) marketplace – have experienced similar increases. Most Americans who buy their insurance there could not possibly afford it if not for subsidies provided by the federal government on a sliding scale, which is based on income. The most generous subsidies have been available since 2014 to people with income up to 150% of the federal poverty level (FPL). During the pandemic, Congress expanded – or “enhanced” – the subsidies to make them available to people with incomes up to 400% of FPL. Those enhanced subsidies are scheduled to expire at the end of this year. Whether to let them expire or extend them is at the center of the ongoing government shutdown. Most Democrats are insisting they be extended while most Republicans want them to end. It’s important to note that the federal money goes to insurance companies, not to people enrolled in their health plans.
If the enhanced subsidies do end, millions of Americans who get their health insurance through the ACA marketplace will drop their coverage because the premiums will be unaffordable for them and their families. In Pennsylvania where I live, premiums for policies bought on the state’s insurance exchange are expected to increase 102% next year because of the anticipated end of the subsidies and premium inflation.
More than 24 million Americans now get their coverage through the ACA marketplace, primarily because their employers cannot offer health insurance as an employee benefit anymore. Over the past several years, a growing number of small businesses have stopped offering subsidized coverage to their workers because of the expense. Just slightly more than half of U.S. businesses are still in the game. The rest simply can’t afford the premiums. Small businesses can expect an average increase of 11% next year with some of them facing increases of 32%.
It is becoming more clear every passing year that the U.S. has one of the most insidious ways of rationing care. It is rationed based on a person’s ability to pay far more than on a person’s need for care. And among those most disadvantaged by the current system are hard-working low- and middle-income Americans with chronic conditions and those who suddenly get sick or injured.
While the Affordable Care Act prohibited insurers from charging people with pre-existing conditions more than healthier people, insurers have figured out a back door way to discriminate against them: by making them pay hundreds or thousands of dollars out of their own pockets every year – in addition to their premiums – and also by refusing to cover treatments and medications their doctors say they need.
Now you know why Big Insurance is doing so well while the rest of us are getting
Physicians for a National Health Program (PNHP) — in collaboration with Johns Hopkins University researchers — just released a report titled “No Real Choices: How Medicare Advantage Fails Seniors of Color”. It confirms that the handover of public programs like Medicare Advantage (MA) to Big Insurance doesn’t close racial, ethnic and economic health gaps — it deepens them.

PNHP’s researchers found that communities of color are being steered into MA plans not because they’re better — but because they’re cheaper upfront. This dynamic, dubbed the “Gap Trap,” means that affordability is driving people into coverage that often denies care, delays treatment and locks them into narrow networks.
“Medicare Advantage squanders billions, harms seniors and exacerbates racial inequities,” Dr. Diljeet K. Singh, gynecologic oncologist and president of Physicians for a National Health Program, said. “Americans need universal health Care which removes profit-motivated conflicts of interest, abolishes co-pays and deductibles, ends prior authorization burdens and guarantees protection from medical bankruptcy.”
HEALTH CARE un-covered is a reader-supported publication. To receive new posts and support our work, consider becoming a free or paid subscriber.
Medicare Advantage is the health care equivalent of the subprime mortgage crisis — except the fine print here is costing Americans’ lives and depleting the Medicare Trust Fund.
When Big Insurance boasts about “diverse” enrollment in MA, this report reminds us: “Diversity” is often just a buzzword used for PR reasons and has nothing to do with seniors receiving the care they deserve — especially when it is used as cover for a business model that profits from inequity.
The PNHP report finds:
As a reminder, even with the racial and ethnic issues aside, Medicare Advantage already severely restricts seniors’ access to providers, imposes unnecessary prior authorization hurdles that often result in deadly delays and denials — and cost taxpayers at least $84 billion more each year than original Medicare. Meanwhile, original, traditional Medicare does not even have networks; almost all doctors participate and few treatments are subject to prior authorization.
PNHP’s report shows that despite insurers’ endless “health equity” pledges and glossy diversity campaigns, MA remains a rigged game that leaves millions of seniors — disproportionately people of color — with worse access, inferior care and fewer real choices.
Big Insurance’s MA plans are shaped by the same market incentives that have long rewarded exclusion and sorting risk, and – if history tells us anything – sorting has always leaned on racial dimensions. As the report sums it up:
“Regardless of the reasons, any system that traps and harms people — particularly in ways that map onto centuries of racial injustice — cannot be a solution to health inequity.”

It may already be too late to implement certain changes Republicans are insisting on as a condition for renewing to Affordable Care Act subsidies, further casting doubt on any congressional deal to extend the financial aid.
Why it matters:
GOP lawmakers have made clear that they need to see changes to the enhanced ACA tax credits at the center of the government shutdown fight in order to extend them.
What we’re hearing:
Extending the credits after Nov. 1 is still possible, experts say, but gets much harder if there are significant changes, such as capping eligibility at a certain income level or requiring recipients to make a minimum premium payment.
What they’re saying:
“I have zero confidence that there’s enough operational time for systems and issuers to be able to implement changes, significant changes,” said Jeanne Lambrew, a former key health adviser in the Obama White House and later a top health official in Maine.
Between the lines:
One possible workaround would be for Congress to extend the enhanced subsidies unchanged for one year and then have GOP changes take effect in 2027. It’s not clear if that would pass muster in the House and Senate.
Devon Trolley, executive director of Pennsylvania’s ACA marketplace, said “at this point in the calendar, the lowest risk option is an extension of the same framework that the enhanced tax credits have today.”
An added complication is that there is no solution in sight for satisfying Republican demands that additional language be added preventing the subsidies from funding elective abortions.
The bottom line:
Congressional Democrats have been urging Republicans to enter negotiations, saying time is running short, while the GOP counters that Democrats need to open the government first.

In a recent blog post, Looming Government Shutdown? A Brief Overview of Expiring Federal Authorizations, the Rockefeller Institute of Government detailed the health care policies and programs requiring an extension and, in some cases, funding by Congress. For over two weeks now, failure to reach agreement on a Continuing Resolution (CR) to keep the federal government fully funded has resulted in a temporary federal shutdown.
The debate is both highly nuanced and politically charged. It involves multiple healthcare issues. The House passed a CR (sometimes also referred to as an extender) that would largely continue current funding levels through November 21, 2025, but with some new spending items, such as additional funding for congressional member security. Thus far, the Senate majority has not had the votes to pass the extender.
Under Senate rules, 60 votes are required to overcome a filibuster. This necessitates at least seven Democratic senators to vote with the Republican majority for passage. Only three Democratic senators and one Independent have voted in favor of the House-passed extender to date, and one Republican did not vote with the majority. This leaves the current vote count at 56 out of the necessary 60 votes.
The Democrats are seeking an amendment to the Republican supported CR, which would fund the government through October 31, 2025. At the core of the current dispute, the Democratic minority is seeking, among other things, in its proposed amendments: (1) restorations of the health care cuts in the recently passed HR1—also known as the One Big Beautiful Bill Act (OBBBA), and (2) permanent extension of federal funding not included in HR1 for enhanced subsidies—known as advance premium tax credits (APTC). APTCs provide additional federal funding to lower the cost of health insurance coverage purchased through the Affordable Care Act (ACA) marketplaces. These enhanced APTC subsidies were initially authorized during the COVID pandemic and are set to expire at the end of 2025, unless extended. In essence, the disagreement is over the health care cuts HR1 made, which were followed by more restrictive regulations governing the purchase of health insurance coverage, and whether Congress will continue COVID-era enhanced subsidies.
Additionally, while not included in the broader media coverage, the Rockefeller Institute has previously highlighted October 1, 2025, as the scheduled implementation date for reductions to Disproportionate Share Hospital (DSH) payments. DSH provides federal funds to hospitals that serve a high number of low-income and uninsured patients to help cover their uncompensated care costs.1 Language delaying the cuts to DSH is in both the Republicans’ CR as well as the Democrats’ proposal.
Prior work by the Institute, as well as other commentators, has detailed the funding cuts and other changes included in HR1 and through federal regulation, and their adverse impacts on New York’s $300 billion healthcare economy.
The Democratic minority in the Senate is seeking restorations for all of the health provisions changed in HR1. Of the Democrats’ proposed restorations, three specific areas that have been the subject of the Republican majority’s criticism include proposals relating to the financing of healthcare for certain non-citizens (both lawfully residing and illegally residing). The proposals or restorations include: (1) permitting particular lawfully residing immigrants (persons residing under color of law, or “PRUCOL”) to purchase health insurance on the official ACA marketplace, who were excluded in HR1; (2) reversing the narrowed definition of PRUCOL in HR1; and (3) restoring the federal matching share of emergency Medicaid funding which was reduced in HR1.
These issues have been subject to oversimplification in public and political discourse. Prior Rockefeller Institute of Government writings have clearly detailed these programs and who is or is not eligible. At the core of the issue, with limited exception relating to the percentage of federal funding for emergency Medicaid,2 federal funds have always been prohibited from funding coverage for those who are not lawfully residing in New York or other states. However, HR 1 also significantly reduced federal funding for both emergency care, which is provided to undocumented persons during a life-threatening emergency, and for lawfully residing residents, like refugees and asylees, that was previously authorized.3
New York estimates the changes to the definition and eligibility for the tax credits in HR1, and the enhanced subsidy expiration that was not extended in HR1, would result in a loss of over $7.5 billion in funding to New York’s healthcare economy, beginning January 1, 2026. In particular, the change in HR1 removing certain immigrants from eligibility for APTC reduces available federal funding to the State. As a result of these changes, on September 10, 2025, New York made a request to terminate the Section 1332 State Innovation Waiver and return to the Basic Health Program, risking coverage for approximately 450,000 New Yorkers with incomes between 200 and 250 percent of the poverty limit who, as a result of the loss of funding will have to purchase coverage on the exchange, obtain coverage through their employer or become uninsured. The comment period for the notice concluded on October 10, 2025, and anticipated submission to CMS was scheduled for October 15, 2025.
Some portion of the restoration of HR1 cuts that are being proposed may, however, go to undocumented immigrants with respect to emergency Medicaid funding. Medicaid pays a share of the financing of emergency Medicaid services for persons with life-threatening or organ-threatening conditions—this was the case both before and after HR1. HR1 continues to fund emergency Medicaid, but reduces the federal share from 90 percent to 50 percent for certain adults.
According to New York State Department of Health data provided to the Empire Center for Public Policy, a think tank, as of March 2024, there are 480,000 noncitizens enrolled in the emergency Medicaid program. These are largely undocumented immigrants who are otherwise not eligible for Medicaid or the Essential Plan as a qualified alien, PRUCOL, or through any other program. Absent emergency Medicaid federal funding, however, hospitals would still be required to provide care in emergent situations under the Federal Emergency Medical Treatment and Labor Act (EMTALA ) without federal money to reimburse those hospitals for that care. EMTALA was a bipartisan bill that was signed by President Regan back in 1986. Among other things, EMTALA protects everyone—primarily US citizens—who need immediate emergency care by requiring hospitals to treat patients whether they have proof of identity or insurance, or not.
The debate in Washington over restoring cuts passed in HR1 may not be resolved in a CR. Despite the potential impacts on federal funding to New York associated with the currently passed CR in the House and, therein, maintaining HR1’s changes and funding cuts, there are other important elements that, if excluded from an agreement, would add to the impact of HR1 reductions.
This post summarizes two important issues that are of significant financial impact to New York, which could be important elements of a potential bipartisan compromise solution.
In addition to restoration of the health care cuts in HR1, a second key issue in the current federal shutdown relates to programs with significant financial impact to New York that were not addressed in HR1: continued funding for Enhanced Advance Premium Tax Credits (APTC), as well as extension of the Disproportionate Share Hospital (DSH) funding at current levels. A permanent extension of the enhanced APTCs was included in the Democrat minority CR, and both parties included an extension of current DSH funding in their respective proposals.
Enhanced APTC
Enhanced APTC federal funds are used to lower health insurance premium costs for qualified health plan (QHP) coverage purchased through ACA health marketplaces. The extension of enhanced APTC, which was not addressed in HR1, relates to enhanced subsidies for purchasing qualified health plan (QHP) coverage. Existing subsidies for those not enrolled in Medicaid, Medicare, or other coverage that provide financial assistance beyond what was authorized under the Affordable Care Act (ACA) are set to expire on December 31, 2025.
The enhanced APTC subsidies were initially authorized during COVID-19 in the American Rescue Plan Act (ARPA) and extended in the Inflation Reduction Act.4 Not only were the enhanced subsidies for purchasing health insurance coverage increased (for those who were already receiving a subsidy) through advance premium tax credits, but eligibility for subsidies was expanded to include those above 400 percent of the federal poverty limit ($62,600 for an individual and $128,600 for a family of four in 2025).
The extension of the enhanced APTC was neither included in HR1, nor was it included in the Republican’s continuing resolution. As a result, it has been less widely publicized component of the current healthcare debate in Washington than the proposals to restore reductions in funding for non-citizen care, in the Democrat version of the CR.
At present, it remains unclear if the COVID-era enhanced premium tax credits will be renewed by Congress. The CR proposed by the Congressional majority only provides continued funding of existing programs through November 21st and would not solve the subsidy cliff (a sudden and steep increase in premiums for those purchasing coverage in the individual or small group market) before open enrollment begins on November 1st. Despite the fact that this issue remains open in the federal funding debate, there has been strong public support as of late for extending enhanced APTC. Of those polled by the Kaiser Family Foundation between September 23 and September 29, 2025, 78 percent of respondents indicated Congress should extend the enhanced tax credits (92 percent of Democrats, 82 percent of independents and 59 percent of Republicans).
Moreover, in mid-late September, Republican Senator Lisa Murkowski (AK), who voted against the CR, proposed a two-year extension in efforts to reach agreement on the potential shutdown, and news outlets reported5 that Republican senators were working on legislation that would extend the subsidies. At present, it appears Senator Murkowski is the only sponsor of her bill (S. 2824), which would extend the subsidies for two years. There is also currently proposed legislation, the Bipartisan Premium Tax Credit Extension Act (H.R. 5145), which would extend the enhanced subsidies for one year, through December 31, 2026. As of October 9th, 2025, there are 27 bipartisan House co-sponsors, including three members of the New York Congressional Delegation sponsoring the bill: Representatives Suozzi (D, NY-3), Lawler (R, NY-17), LaLota (R, NY-1).
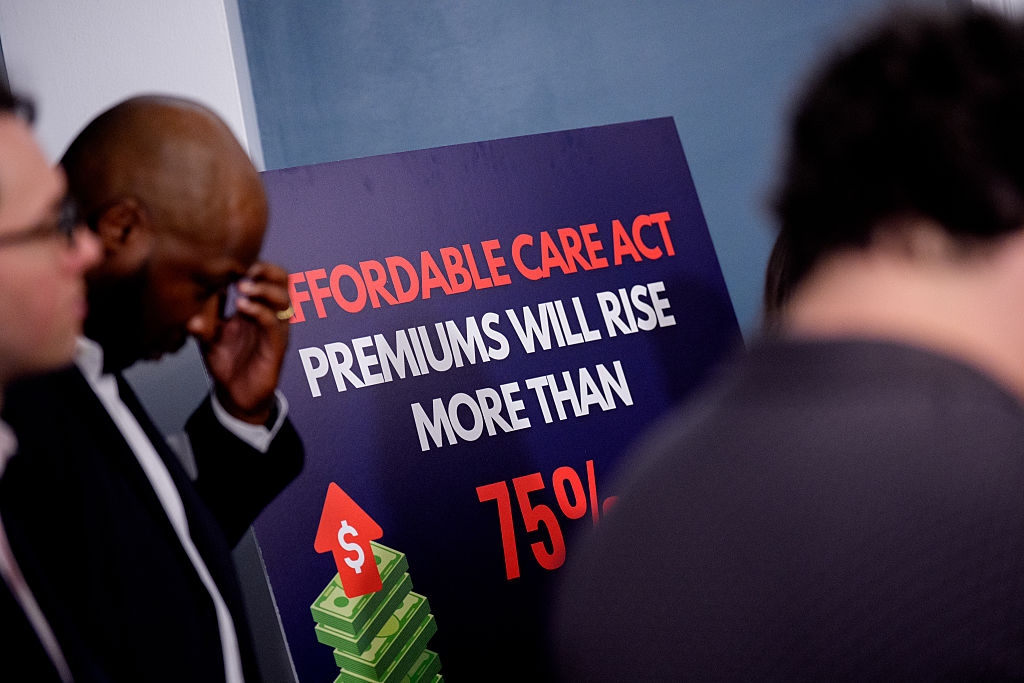
Absent legislative action, it is estimated by the Kaiser Foundation that the cost to purchase health insurance in the individual market could increase by over 75 percent nationally due to the subsidy expiration.
While New York and other states would be impacted, the enhanced subsidies have the greatest direct impact in the 10 remaining non-Medicaid expansion states: Alabama, Florida, Georgia, Kansas, Mississippi, South Carolina, Tennessee, Texas, Wisconsin, and Wyoming.6 These states account for 79 house majority votes (out of 106 associated with the 10 states in total).
Moreover, there are particular and significant portions of the population within and outside of these states that would be greatly impacted. According to Kaiser, nationally, “more than a quarter of farmers, ranchers, and agricultural managers had individual market health insurance coverage (the vast majority of which is purchased with a tax credit through the ACA Marketplaces). About half (48%) of working-age adults with individual market coverage are either employed by a small business with fewer than 25 workers, self-employed entrepreneurs, or small business owners. Middle-income people who would lose tax credits altogether are disproportionately early and pre-retirees, small business owners, and rural residents.
And while the ACA Marketplaces have doubled in size nationally since these enhanced tax credits became available, more than half of that growth is concentrated in Texas, Florida, Georgia, and North Carolina.”7
DSH Funding
Medicaid Disproportionate Share Hospital (DSH) payments are federal payments to hospitals that serve a high number of low-income and uninsured patients to help cover their uncompensated care costs. These payments are a critical form of financial assistance for “safety-net” hospitals, helping them remain financially stable and continue providing essential services to vulnerable populations. Federal law requires states to make these payments to qualifying hospitals, but there are overall and state-specific limits on the total amount of funding available.
Funding for the DSH program was set to expire on or about October 1, 2025. Extension of the DSH program was not included in HR1. As discussed below, the impact on “safety-net” hospitals in New York is significant.
Expiration of Enhanced APTC
In 2022, the last time the Enhanced APTC subsidies were set to expire, New York State estimated that their expiration would increase premium costs for qualified health plan (QHP) enrollees by 58 percent and reduce funding to the Essential Plan by $600–$700 million.8 New York recently estimated the impact at 38 percent following passage of the House bill, which did not include the extension. According to NYSOH, the subsidy benefits nearly 140,000 New Yorkers and reduces coverage costs by $1,368 per person annually (previously $1,453 in 2022), which equates to over $200 million in federal funding that would be diverted from New Yorkers currently purchasing coverage on the exchange.
Additionally, New York has experienced higher-than-average premium increases in recent years, so when combined with reductions to subsidies, this may make it more difficult for people to afford to buy coverage and could further exacerbate the shrinking New York individual and small group health insurance markets. Premium increases in New York exceed national trends.9 Part of this in New York (as opposed to other states) is due to the use of various health-related taxes, which were detailed in How Health Care Policy in Washington Could Affect New York.
Rate increases for individual, small group, and large group health insurance for the 2026 plan year were reviewed and approved, with changes, by the Department of Financial Services (DFS) in August 2025. According to DFS, individual plans will increase by an average of 7.1 percent, while small group plans will increase by an average of 13 percent, both of which are significantly less than was requested by the insurers.
New York operates a Basic Health Program (BHP) option in the ACA, known as the Essential Plan (EP). The EP is a public health insurance program for New Yorkers with incomes above the maximum Medicaid eligibility (138 percent of the federal poverty limit) and below 200 percent of the poverty limit, or with the 1332 Waiver below 250 percent of the poverty limit (FPL). The BHP provision in the ACA only allows eligibility up to 200 percent FPL. Using a provision in section 1332 of the ACA that allows for federal regulators to make certain adjustments (or waivers), New York increased EP eligibility to 250 percent FPL. However, as a result of funding reductions enacted in the HR1, New York is currently seeking to reverse its waiver expansion, bringing the future maximum eligibility to 200 percent of the FPL.
Using January 2025 enrollment data, absent other changes, the estimated lost funding to the Essential Plan would jump from $1 billion to $1.2 billion. Changes enacted in HR1 (which the Democrats are currently seeking to reverse) reduce the value of the enhanced subsidies to New York by approximately one-third, as certain legally residing non-citizens are no longer eligible for any subsidies pursuant to the federal changes.10
Enhanced Premium Tax Credit—Impact of Expiration in New York 11
An extension or lack thereof of the subsidy has important implications for healthcare financing and access to coverage in the State of New York. At present, New York stands to lose $1.2 billion to $1.4 billion associated with the loss of the enhanced subsidies, including $1.0 billion to $1.2 billion currently used to provide low-cost coverage to 1.6 million persons with incomes between 138 and 250 percent of the poverty limit and nearly $200 million for 140,000 individuals purchasing coverage on New York State of Health (NYSOH).
Timing for Consumers
November 1, 2025, marks the beginning of the open enrollment period for purchasing coverage on a state or federally operated exchange for the 2026 plan year. Consumers can begin renewing plans beginning November 16, 2025, for those purchasing a qualified health plan on New York State of Health (NYSOH), with a December 15, 2025, deadline to enroll in coverage that begins on January 1, 2026.
In addition to NYSOH’s website and app, New York health insurance notices for the 2026 plan year are to be sent out by November 1, 2025, detailing premium information, including any applicable APTC. The notices will also list the income used for the automatic renewal determination in a section titled “How We Made Our Decision.” For enrollees who do not agree with the renewal determination, they can update their application on NYSOH between November 16, 2025, and December 15, 2025, to avoid a gap in coverage starting January 1, 2026.
Those rate notices are already being loaded into the plan systems and NYSOH online, as it takes some weeks to get the rate notices set and out to enrollees. If Congress does not act imminently to reauthorize the expanded APTC, consumers will receive notices that reflect 2026 premiums without the expanded APTC.
Indeed, NYSOH has already put online, as of October 1, 2025, the ‘Compare Plans’ and ‘Estimate Costs’ tool on the website, which allows consumers to look at plan options and evaluate costs. And, for consumers using the tool now, it already reflects that the Expanded APTCs will not be available for 2026.
There are three basic options available to Congress with some variation on duration with regard to the enhanced APTCs. Congress could:
Congress could also explore options that modify the maximum amount a household would be required to contribute towards the cost of coverage (currently 8.5% for households above 400 percent of FPL) or limit the application of the marketplace coverage rule, which was detailed in a prior Rockefeller Institute of Government report.
Additionally, scheduled reductions to DSH funding, that absent a change to New York State law, would primarily affect the availability of DSH funding for New York City, which were delayed from starting in October 2025 to October 2026 through 2028 in the initial House Reconciliation bill, but not included in HR1, are effective October 1, 2025, absent a federal extension. The DSH reduction has been delayed by Congress more than a dozen times since enactment through the ACA.12
Under current law, the availability of $2.4 billion federal DSH funding to New York, or 15 percent of federal funding for DSH ($16 billion), would be reduced. DSH funding is matched by the state or locality (through an intergovernmental transfer), making New York’s total DSH program over $4.7 billion as of federal fiscal year 2025. The Medicaid and CHIP Payment and Access Commission (MACPAC) estimates New York State’s total DSH program, including federal and non-federal shares, would be reduced by $2.8 billion, which translates to a loss of $1.4 billion in federal DSH funding (or a nearly 59 percent reduction).
On September 23, 2019, immediately preceding the last government shutdown, CMS issued a final rule, finalizing the methodology to calculate the scheduled reductions to DHS funding, as initially enacted in the ACA, during the 2020 to 2025 period. It does not appear that the Trump administration has issued guidance related to implementation in 2025; however, the regulations track with the statute, meaning the Trump administration could implement the DSH reductions required under the ACA, absent agreement on a delay.
Like an extension of the enhanced subsidies for the APTCs, an extension (meaning a delay) of the DSH cuts is an important element for New York to avoid further significant loss of federal funding (in addition to the loss of funding as a result of HR1 and the potential expiration of the enhanced subsidies).
Multiple healthcare issues are at play in the Federal government shutdown. Democrats want to restore cuts and other actions made in HR1 in an effort to mitigate the impact on residents and the healthcare delivery system, including the State’s financial plan, while Republicans are not revisiting actions taken in HR1. Among others, requested cuts to be restored in HR1 include making certain legally residing non-citizens ineligible for federal funding to purchase comprehensive coverage on health insurance marketplaces, narrowing the definition of legally residing non-citizen for purposes of public program eligibility, and reducing the match rate for emergency Medicaid.
Two additional important issues are the impending expiration of enhanced subsidies for purchasing coverage on an official ACA marketplace and the impending implementation date for previously scheduled disproportionate share hospital (DSH) reductions. As referenced above, polling suggests that the extension of the subsidy has broad public support, and there is a bipartisan bill in Congress providing an extension. In the immediate days following the shutdown, positive polling around extending the enhanced APTC suggested there was a possibility of ending the shutdown with bipartisan support. While many states benefit from these subsidies, New Yorkers, more specifically, benefit from these subsidies on the exchange and in the Essential Plan, due to the State’s adoption of the Basic Health Program option for those with income slightly above Medicaid levels. While there is some coverage and indications of support regarding the enhanced APTC subsidies, the potential for the DSH cuts to be implemented is not in the mainstream media coverage.
Moreover, with regard to the enhanced APTC subsidies, we now see that the narrative from the Republican congressional majority is shifting,13 suggesting that the enhanced subsidies might not be part of resolving the current debate playing out in Washington.
Nevertheless, compromise is still possible, particularly in light of the disproportionate impact the expiration of the enhanced APTC will have on Republican-led states and the broad impact of the scheduled DSH reductions. One potential path to ending the shutdown where both sides could arguably claim victory would be to drop the demand for restoration of the health care cuts in HR1 in exchange for extending the enhanced APTC and again delaying the DSH cuts. While this potential “victory” would be a benefit to New York and reopen the federal government, that does not mean that the restoration of cuts enacted in HR1 would not also be important to New York in future negotiations.
It’s impossible to predict exactly where things are headed right now, but the Rockefeller Institute of Government continues to monitor developments in Washington, continuing past efforts to detail who and what is at stake in the current debates. This post is preceded by a series of healthcare reports, blogs, and podcasts by our health team, which include more information on the programs discussed in this post and related topics. More information can be found in these past works in the health series, which is available here.
The United States has a health-care cost crisis. High premiums, large deductibles, and unpredictable copays strain families’ finances, even among those who have insurance, and claim denials and prior authorization requirements mean insurance doesn’t always work the way it’s supposed to.
As a new Roosevelt fact sheet explains, this cost crisis has given way to a medical debt crisis: “An estimated 41 percent of US adults (~107 million people) carry some form of medical debt, which includes unpaid medical provider bills, credit card balances, bank loans, or debt to friends/family. About 24 percent of adults have past-due medical debt.”
The expiration of enhanced Affordable Care Act marketplace plan subsidies at the end of the year would only worsen the crisis. The expiring tax credits, Roosevelt Fellow Miranda Yaver tells MSNBC, will mean “dramatic premium increases faced by marketplace enrollees.” And Congress is currently ignoring the issue, keeping the House closed and the government shut down as we hurtle toward open enrollment season. As Yaver points out, “While the enhanced premium tax credits are set to expire at the end of 2025, the start of open enrollment is around the corner on Nov. 1.”
For recommendations on how to rein in these ballooning costs, read the fact sheet: “The Health-Care Debt and Cost Crisis”

A grouped column chart comparing average annual premiums for single coverage from 2018 to 2025 for ACA benchmark plans and employer-sponsored plans. Both plan types have increased in cost since 2018. In 2024, ACA benchmark plans were $5.7k annually while employer-sponsored plans were almost $9k on average. No data is available for employer-sponsored plans in 2025.
Something big is being missed in the congressional showdown over enhanced Affordable Care Act subsidies: Health insurance premiums are eye-wateringly expensive for the average person without some kind of subsidy.
Why it matters:
Health care in the U.S. is expensive, we know, we’ve all heard it a million times. But most of us don’t really feel its full expense, which removes a lot of the urgency to truly address health care costs.
State of play:
The past few weeks have been full of dire warnings from Democrats and their allies about what will happen if the enhanced ACA subsidies from the pandemic era are allowed to expire at year’s end.
Reality check:
Premiums have gone up — a lot, in some cases. But that’s not unique to the ACA marketplace, and premiums are even pricier in the employer market.
By the numbers:
This year, the average premium for a benchmark ACA plan is $497 a month, or nearly $6,000 a year, according to KFF.
Let’s do some math.
Without any form of subsidization, a single person making $60,000 would spend 10% of pretax income on an ACA plan, and 15% on an employer plan.
Between the lines:
The definition of “affordable” is obviously very subjective, but it seems safe to say that some of these numbers — especially for families — aren’t meeting it.
What we’re watching:
Open enrollment is coming, and people with ACA coverage aren’t the only ones facing premium increases.
The bottom line:
Policymakers have two broad options: They can keep fighting over who pays for what, or they can do bigger, systemwide reform.

The U.S. health industry revolves around a flawed presumption: individuals and families are dependent on the health system to make health decisions on their behalf. It’s as basic as baseball and apple pie in our collective world view.
It’s understandable. Consumers think the system is complex. They believe the science on which diagnostics and therapeutics are based requires specialized training to grasp. They think health insurance is a hedge against unforeseen bills that can wipe them out. And they think everything in healthcare is inexplicably expensive.
This view justifies the majority of capital investments, policy changes and competitive strategies by organizations geared to protecting traditional roles and profits. It justifies guardianship of scope of practice limits controlled by medical societies because patients trust doctors more than others. It justifies pushback by hospitals, insurers and drug companies against pro-price transparency regulations arguing out-of-pocket costs matter more. It justifies mainstream media inattention to the how the health system operates preferring sensationalism (medical errors, price sticker shock, fraud) over more complicated issues. And it justifies large and growing disparities in healthcare workforce compensation ranging from hourly workers who can’t afford their own healthcare to clinicians and executives who enjoy high six figure base compensation and rich benefits awarded by board compensation committees.
It’s a flawed presumption. It’s the unintended consequence of a system designed around sick care for the elderly that working age populations are obliged to fund. Healthcare organizations should pivot because this view is a relic of healthcare’s past. Consider:
In response, most organizations in healthcare take cautious approaches i.e. “affordability” is opined as a concern but defined explicitly by few if any. “Value” is promised but left to vague, self-serving context and conditions. “Quality” is about affiliations, capabilities and processes for which compliance can be measured but results (outcomes, diagnostic accuracy, efficacy, savings, coverage adequacy, et al) — hardly accessible. And so on.
For starters, the industry must address its prices, costs and affordability in the broader context of household discretionary spending. Healthcare’s insiders are prone to mistaken notions that the household healthcare spend is somehow insulated from outside forces: that’s wrong. Household healthcare expenditures constitute 8.3% of the monthly consumer price index (CPI); housing is 35.4%, food is 13.6% and energy is 6.4%. In the last 12 months, the overall CPI increased 2.9%, healthcare services increased 4.2%, housing increased 3.6%, food increased 3.2% and energy costs increased only 0.2%. In that same period, private industry wages increased 1.0% and government wages increased 1.2%. Household financial pressures are real and pervasive. Thus, healthcare services costs are complicit in mounting household financial anxiety.
The pending loss of marketplace subsidies and escalating insurance premiums means households will be expected to spend more for healthcare. Housing market instability that hits younger and lower-middle income households hardest poses an even larger threat to household financial security and looms large in coming months. Utilization of healthcare products and services in households during economic downturns shrinks some, but discretionary spending for health services—visits, procedures, tests, premiums, OTC et al—shrinks substantially as those bills take a back seat to groceries, fuel, car payments, student loan debt, rent/mortgage payments and utilities in most households.
Healthcare organizations must rethink their orientations to patients, enrollees and users. All must embrace consumer-facing technologies that empower individuals and households to shop for healthcare products and services deliberately. In this regard, some insurers and employers seem more inclined than providers and suppliers, but solutions are not widely available. And incentives to stimulate households to choose “high value” options are illusory. Data show carrots to make prudent choices work some, but sticks seem to stimulate shopping for most preference-sensitive products and services.
The point is this: the U.S. economy is slowing. Inflation is a concern and prices for household goods and necessary services are going up. The U.S. health industry can ill-afford to take a business-as-usual approach to how our prices are set and communicated, consumer debt collection (aka “rev cycle”) is managed and how capital and programmatic priorities are evaluated.
Net Promoter Scores, Top 100 Recognition and Star Ratings matter: how organizations address household financial pressures impacts these directly and quickly. And, as never before, consumer sentiment toward healthcare’s responsiveness to their financial pressures is at an all-time low. It’s the imperative that can’t be neglected.
