
Thought of the Day


Hospital and health system leaders spend countless hours reviewing financial dashboards, quality metrics, staffing ratios, and strategic plans. Yet one of the most impactful leadership tools is much more simple: lunch.
Yes, as in food and conversation. Specifically in this case, a simple practice called “Check-ins with Charles.”
At our June 2026 HealthLeaders CEO Exchange in Avon, Colorado, some of healthcare’s top executives gathered for an honest conversation about leadership, culture, financial performance, and the future of the industry.
During the discussion I moderated, Charles Williams, regional president at Baylor Scott & White, covered everything from revenue cycle management and physician engagement to CEO succession planning.
Yet one of the most compelling ideas shared that afternoon (and that had all the other CEOs rapidly engaging) had nothing to do with technology, reimbursement models, or operational restructuring. It was Williams’ leadership initiative “Check-ins with Charles.”
The concept is remarkably simple. On a regular basis, Williams invites a randomly selected group of employees—from nurses and environmental services staff to finance professionals and administrative team members—to an informal Chick-fil-A lunch. There is no PowerPoint presentation. There are no scripted talking points. There is no formal agenda. The purpose is simply to listen.
As Williams explained during the discussion, the impact has gone far beyond an hour spent sharing a meal.
“When that email goes out,” he told the group, “it’s not that guy, it’s Charles.”
That distinction may sound small, but in today’s healthcare environment, it represents something much larger: trust.
Healthcare executives spend enormous amounts of time analyzing financial statements, reviewing quality metrics, discussing workforce shortages, and developing strategic plans. Those activities are essential. But as the CEO Exchange conversation repeatedly demonstrated, strategy only succeeds when people believe in the leaders asking them to execute it.
Healthcare leaders often focus on execution. We talk about operating margins, revenue cycle performance, patient experience scores, physician productivity, employee retention, and quality outcomes.
Those metrics matter, but execution doesn’t begin with dashboards. It begins with trust.
One of the recurring themes throughout the CEO Exchange was that organizations often fail to communicate proactively because leaders and employees simply don’t know one another well enough. Everyone is busy. Calendars are full. Meetings dominate the day. Yet when leaders become disconnected from the frontline, small problems stay hidden until they become expensive crises.
Williams described how “Check-ins with Charles” has become one way to eliminate that disconnect.
The informal lunches allow employees to speak openly in a setting where titles disappear. Clinical and non-clinical staff have an opportunity to ask questions, offer suggestions, and discuss concerns directly with the CEO.
He complements those lunches with another simple communication strategy: a monthly three-minute video message. Sometimes the videos are intentionally lighthearted—wearing a Valentine’s shirt covered in hearts or joking with employees—to demonstrate vulnerability and approachability.
The objective isn’t entertainment, it’s accessibility, and employees stop seeing “the president” and begin seeing a person.
That shift has produced measurable results.
Williams shared that following these consistent communication efforts, his organization achieved the highest employee engagement survey participation rate in its history.
Participation itself isn’t the end goal, but it is an important indicator. Employees generally do not take time to provide honest feedback unless they believe leadership is genuinely listening and prepared to act on what they hear.
Several executives around the table reinforced the same lesson with their own experiences.
One CEO of a health system in Connecticut described taking over responsibility for revenue cycle despite coming from a nursing background. Rather than pretending to understand every technical aspect of billing and coding, she gathered everyone into one room and admitted what she didn’t know.
Many of those employees had worked in the same building for years but had never truly collaborated.
Together, they established shared expectations, defined key performance indicators, and began meeting regularly.
The results were dramatic.
Claim denials declined significantly. Departments that previously blamed one another started solving problems together. Frontline registration staff, physicians, coding teams, and revenue cycle leaders finally understood how each person’s work affected the others.
The improvement didn’t begin with a new software platform. It began with communication.
Another executive discussed regularly spending half a day shadowing frontline employees. Dressed in scrubs, he works alongside environmental services, nurses, and other team members—not as a symbolic exercise, but as a learning opportunity.
Those interactions consistently reveal operational problems that never surface in executive conference rooms.
Employees become comfortable sharing frustrations, identifying inefficiencies, and suggesting improvements because the hierarchy has temporarily disappeared.
Another participant emphasized that finance leaders should spend time in clinical environments, while clinicians should gain greater appreciation for financial decision-making. When each group understands the other’s daily challenges, collaboration replaces conflict.
As one executive noted, communication is often the bridge between operational excellence and financial performance.
Communication is frequently categorized as a ‘soft skill,’ and honestly my boss always told me to stay away from these soft stories, but the executives at the CEO Exchange argued exactly the opposite.
Strong communication produces measurable business outcomes.
Research has indicated that organizations that foster open dialogue often experience:
These observations align with broader workforce research. The firm Gallup has consistently found that highly engaged business units outperform less engaged teams across profitability, productivity, turnover, safety, absenteeism, and customer satisfaction. While healthcare has its own unique challenges, the underlying principle remains the same: Engaged employees produce stronger organizational performance.
The roundtable offered numerous examples.
Finance leaders make better decisions after seeing clinical operations firsthand.
Clinicians become more thoughtful stewards of organizational resources when they understand how financial performance affects future investments.
The conversation eventually shifted to another challenge facing healthcare organizations: executive turnover.
Participants noted that the average tenure of a hospital CEO today is generally somewhere between three and five years, a figure that aligns with data from the American College of Healthcare Executives (ACHE), which has long reported average hospital CEO tenure at approximately five years nationally.
The executives argued that frequent leadership turnover carries enormous organizational costs.
Every leadership transition requires employees to learn a new leadership style, interpret new priorities, and adapt to another strategic vision.
One executive described the experience as traumatic for organizations.
Instead of concentrating on executing strategy, employees spend valuable time trying to understand the expectations of the incoming CEO.
Another participant observed that boards are often searching for a “silver bullet” during difficult financial periods, replacing leaders before long-term strategies have time to mature.
The result can be an endless cycle of organizational resets.
Several executives pointed to health systems where senior leaders have remained in place for more than a decade as examples of how leadership stability creates a competitive advantage.
Williams discussed Baylor Scott & White’s intentional focus on developing internal leadership pipelines. Potential future presidents and chief operating officers are paired with experienced mentors well before succession becomes necessary, ensuring continuity and preserving organizational culture rather than forcing each new leader to reinvent it.
Perhaps the most memorable story shared during the discussion came from another longtime hospital CEO.
While ordering lunch in the cafeteria, he asked for a very small salad.
The cafeteria employee smiled, placed a single piece of lettuce into the bowl, and asked, “Is that small enough for you?”
Rather than feeling disrespected, he viewed it as one of the proudest moments of his career.
The interaction demonstrated that an employee felt comfortable enough to joke with the CEO.
There was no fear, there was trust.
That, the group agreed, is what culture looks like.
Not mission statements.
Not values posters hanging in hallways.
Not speeches from the executive suite.
Culture is built through everyday interactions that convince employees they are seen, heard, respected, and safe enough to speak honestly.
Healthcare continues to face unprecedented pressure—from workforce shortages and financial uncertainty to AI, rising consumer expectations, and increasing regulatory complexity.
No CEO can personally solve every challenge facing a modern health system.
Every CEO, however, can create an environment where employees feel comfortable identifying problems early, collaborating across departments, and contributing ideas before issues become crises.
That is the real lesson behind “Check-ins with Charles.”
It isn’t really about Chick-fil-A or even about lunch. It is about replacing hierarchy with humanity.
The conversations in Avon made one thing abundantly clear: Organizations that invest time in authentic communication build trust. Trust strengthens culture. Strong cultures execute strategy more effectively. And better execution ultimately produces stronger financial performance.
For healthcare leaders searching for a competitive advantage in an increasingly complex industry, one of the highest-return investments may not be found in the next technology platform or consulting engagement.
It may simply be sitting down at a table, sharing a meal, and asking one question:
“What do you think we could do better?”
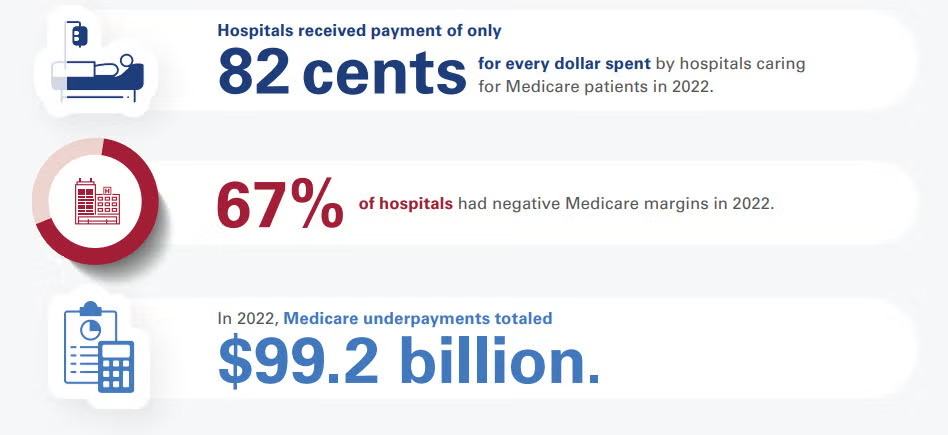
Medicare reimburses hospitals at an average of 82% to 87% of the actual cost of providing patient care. According to long-term data from the American Hospital Association (AHA) and the Congressional Budget Office (CBO), this means hospitals face a shortfall, receiving roughly 82 to 87 cents for every dollar they spend caring for Medicare beneficiaries.
Financial Impact and Hospital Margins
Because Medicare reimbursement rates are fixed by the federal government, they often fail to keep pace with the rising costs of labor, drugs, and supplies:
How Hospitals Balance the Deficit
To remain financially viable while absorbing underpayments from Medicare and Medicaid, hospitals rely on cost-shifting to the private sector:
If you are tracking hospital financials or healthcare policy, would you like to see how Medicaid reimbursement rates compare, or look closer at the differences between inpatient and outpatient Medicare payment structures?
Medicaid reimburses hospitals at an average of 88% to 90% of the actual cost of care, but this figure heavily relies on supplemental government funding. Without these extra state and federal payments, standard Medicaid base rates only cover roughly 58% to 65% of hospital costs.
Because Medicaid is jointly funded by federal and state governments, the exact payment-to-cost ratio varies wildly by state, fluctuating between 49% and 169% of Medicare benchmarks.
The Core Components of Medicaid Payments
Medicaid hospital payment structures are highly complex and divided into two primary tiers:
Operational Impacts on Hospitals
The gap between Medicaid base reimbursement and actual cost strains hospital systems in several distinct ways:

Hennepin’s financial struggles highlight how hospitals with heavy Medicaid and uninsured populations remain vulnerable when reimbursement growth lags expense inflation.
CFOs should model scenarios involving Medicaid funding reductions, rising uncompensated care, and sustained labor-cost pressures to assess liquidity and capital needs.
While government funding can provide short-term relief, finance leaders should focus on long-term sustainability through revenue diversification, service-line optimization, and proactive advocacy efforts.
Hennepin Healthcare’s financial crisis has become one of the most closely watched healthcare stories in the country. Now bolstered with state funding, its story illustrates the mounting pressure on safety-net hospitals.
Think of this headline as an underscore to the growing vulnerability of health systems whose payer mix is concentrated in government programs. Hennepin Healthcare’s situation demonstrates that even large, clinically essential institutions can find themselves in liquidity crises when reimbursement growth consistently trails expense inflation.
CFOs should view this as a warning to stress-test their organizations against scenarios involving Medicaid funding reductions, higher uncompensated-care volumes, and continued labor-cost pressure. The strategy lesson here is that traditional margin-improvement initiatives alone may not be enough. CFOs should be strengthening advocacy efforts, diversifying revenue streams where possible, reassessing service-line profitability, and building long-range capital plans that assume greater reimbursement volatility.
The market is tightening, and the broader takeaway is that safety-net economics are becoming a board-level risk issue. Organizations that wait until cash reserves deteriorate before pursuing structural solutions will find themselves relying on emergency legislative interventions rather than executing deliberate financial strategy.
Hennepin Healthcare leaders have warned lawmakers that the organization faces severe financial challenges driven by a combination of factors: rising labor and operating costs, inadequate reimbursement from government programs, and a heavily Medicaid-dependent population.
The system has already tried to shrink costs by reducing beds and eliminating services, while seeking additional state support to stabilize operations. But policymakers ultimately negotiated a funding package worth approximately $205 million to help preserve the organization’s role as Minnesota’s largest trauma center and a critical provider for vulnerable and low-income populations.
In an email to me, the system stated:
“Hennepin Healthcare is deeply grateful to the lawmakers who acted with urgency and collaboration, and to our employees, patients, and advocates whose voices brought needed attention to this crisis. The stabilization funding does not resolve the long-term impacts of HR1 or the structural deficits that uniquely challenge safety-net hospital systems. But it does accomplish two essential things: it delivers historic support that sustains us, and it gives us the time and stability to work with the state on durable, long-term solutions.
Our immediate priorities are to stabilize our team and invest in patient care while carefully stewarding the funds allocated to us. We have essential needs that have been deferred because of financial challenges, including staffing, equipment, and other investments that support patient care.
Looking ahead, our strategy is focused on both operational improvement and long-term sustainability. We will continue working with state leaders, the Governor-appointed task force, and our future professional governing board to identify lasting solutions that strengthen Minnesota’s healthcare safety net and ensure Hennepin Healthcare can continue serving patients for generations to come.”
It’s clear the system views the package only as a bridge. It’s obviously not a solution. But beyond that, it’s also clear that this is not a Minnesota-confined story.
Hennepin Healthcare showcases the financial fragility of safety-net hospitals nationwide. In 2023, well before any of today’s Medicaid chaos, safety-net hospitals provided roughly $11 billion in uncompensated care.
Roughly three-quarters of Hennepin Healthcare’s patients are uninsured or covered by public insurance programs, creating a structural gap between the cost of care and reimbursement levels.
Hennepin Healthcare was projecting up to $50 million in operating losses for 2026 and a staggering $1.7 billion in deficits over the next decade. The organization’s repeated losses and dependence on government intervention underscore the challenges many urban safety-net systems face as Medicaid funding uncertainty, amongst other pressures, converge.


Theodore Roosevelt believed that doing the right thing required courage, responsibility, and moral character—even when it was difficult or unpopular. He argued that people should act with integrity rather than seek the easiest path.
Roosevelt consistently taught that strong character was built through honest work, personal responsibility, and the willingness to stand up for what was just. He believed that individuals—and nations—became stronger when they chose duty over convenience.

Medicare is projected to grow faster than other payers, increasing exposure to lower reimbursement rates and tightening system-wide margins.
Utilization is driving costs. Post-pandemic service use remains elevated, undermining the assumptions that demand would normalize.
Rapid pharmaceutical growth and shifting federal pricing policy make pharmacy costs unpredictable and scenario-dependent.
The latest National Health Expenditure projections from Health Affairs and CMS confirm what CFOs already suspect: cost growth is structural. Total U.S. health spending is expected to grow at roughly 5.4% annually through 2034, consistently outpacing GDP growth of about 4.1%, pushing healthcare’s share of the economy from roughly 18% today to more than 20% by 2034.
The first major implication is funding-source imbalance. Medicare is projected to grow the fastest at roughly 7.7% annually, driven by demographics and utilization intensity. Medicaid and commercial insurance trail at about 5% each, but still above general inflation. This divergence matters. Payer mix will steadily tilt toward government payers with structurally lower reimbursement growth. Even small shifts in payer composition will exacerbate pressure on operating margins unless productivity gains or rate improvements offset them.
Secondly, utilization is what’s really driving the next wave of cost growth. Recent data show elevated service use across hospital, physician, and pharmaceutical categories, with little evidence that post-pandemic demand has normalized. That suggests budgeting cycles can no longer assume regression to pre-2020 utilization trends. For CFOs, this complicates volume forecasting: demand is becoming less predictable and more sensitive to coverage expansion and policy-driven enrollment changes.
Third, prescription drug spending is now the fastest-growing category, with retail pharmaceuticals set to outpace hospital and physician services through the projection window. The combination of specialty drug uptake and policy-driven price reforms creates a dual volatility problem: higher baseline spend alongside uncertain future savings from federal negotiations and benefit redesigns. CFOs in both provider and payer organizations should treat pharmacy cost projections as scenario-driven, not point estimates.
Fourth, federal policy is increasingly the dominant driver of revenue exposure. The federal government’s share of total health spending is expected to rise from roughly 31% to 33% by 2034, reinforcing dependence on Medicare and federal Medicaid financing. At the same time, policy volatility—particularly around subsidies, eligibility rules, and drug pricing—introduces new forecasting risk that cannot be diversified away. CFOs should expect more frequent mid-cycle reimbursement adjustments and greater lag between policy adoption and financial realization.
Fifth, the insured population is expected to slightly decline as a share of total population over the next decade. This is a subtle but important signal for providers, because even small coverage shifts can disproportionately affect elective volume, bad debt exposure, and charity care assumptions. CFOs should incorporate coverage elasticity into long-range planning models, especially in markets with high exchange enrollment sensitivity.
Finally, healthcare is steadily absorbing a larger share of the U.S. GDP. Look out for structural revenue tailwinds for the sector and intensifying political and payer pressure to contain costs. CFOs should expect sustained scrutiny on operating efficiency, administrative overhead, and price justification across all service lines.
Ultimately, the shift here is from static 10-year budgeting to dynamic scenario planning. Health systems that quickly model policy sensitivity, payer mix drift, and utilization volatility in real time will be better positioned than those relying on historical cost curves that just no longer hold up.