
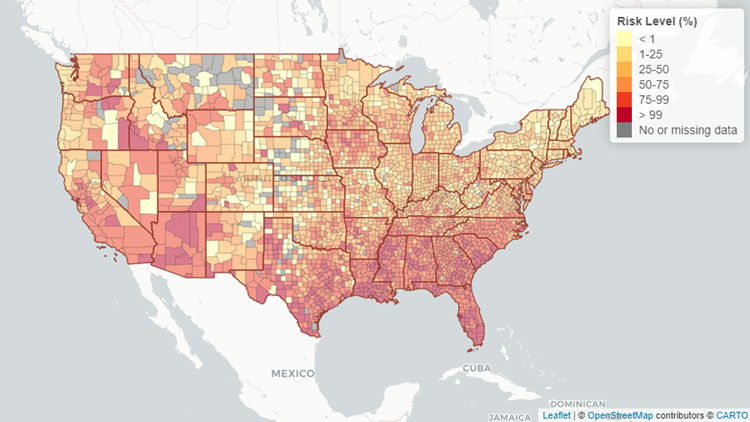
This map shows the risk level of attending an event, given the event size and location.
The risk level is the estimated chance (0-100%) that at least 1 COVID-19 positive individual will be present at an event in a county, given the size of the event.
Based on seroprevalence data, we assume there are ten times more cases than are being reported (10:1 ascertainment bias). In places with more testing availability, that rate may be lower.
Choose an event size and ascertainment bias below:
