Flared jeans are in style, an oil crisis is driving pain at the pump, and unemployment is rising: It’s not 1978, but it kinda feels that way.
The big picture:
Talk of stagflation is rising on Wall Street, as investors fret the dreaded pairing of high inflation and high unemployment is making a comeback.
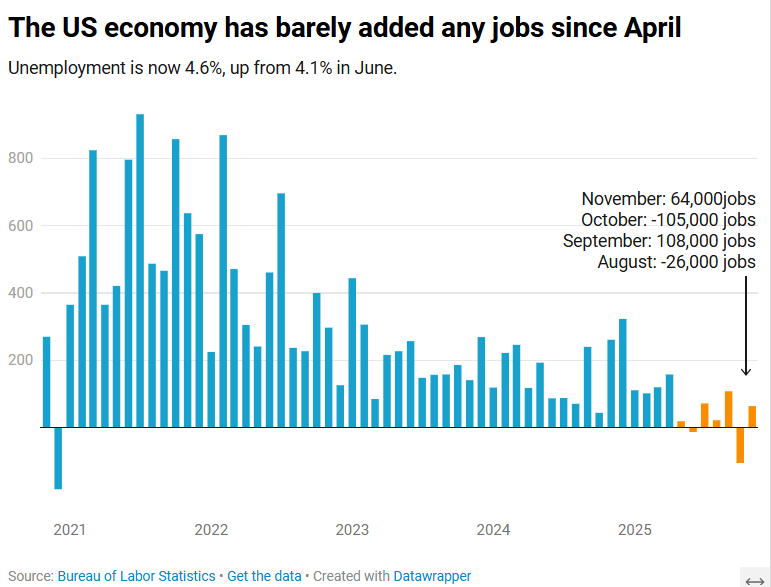
- A lousy jobs report, on top of rising oil prices, is driving the concern.
Zoom in:
On Monday alone, at least six notes from investment managers and Wall Street analysts warned of “stagflationary” concerns.
- Media outlets have run with this.
- Last Friday, Chicago Fed President Austan Goolsbee noted that rising unemployment on top of an oil price shock creates “exactly the kind of stagflationary environment that’s as uncomfortable as any that faces a central bank,” per the Wall Street Journal.
Flashback:
Analysts and media started tossing out the “s” word when inflation revved up back in 2021.
- The term “stagflation” really took off the next year, when Russia invaded Ukraine, spiking energy prices. Everyone then predicted a recession that never materialized.
State of play:
Today is different for two reasons. First, the job market is more sluggish than it was a few years ago.
- Second, the oil shock from the Iran war is potentially magnitudes larger than from the Russian war, taking 20% of global supply oil off the board.
- “Disruption to the Strait of Hormuz creates a far larger potential supply shock that extends beyond oil,” Skylar Montgomery Koning, a macro strategist with Bloomberg, wrote in a note.
- “Shipping flows more broadly are being disrupted. That is pushing up energy and food costs, lifting inflation and squeezing growth.”
- “This stagflationary mix is particularly toxic for markets, as it increases the risk that bonds and equities sell off together.”
Reality check:
It’s not the 1970s. Economists believe the Iran war will slow economic growth and cause an increase in inflation, but not to the extremes seen back then.
- “If you want the word ‘stagflation’ with a very little ‘s,’ you could,” says David Kelly, chief global strategist at JPMorgan Asset Management.
- He recently revised his economic growth projections slightly downward this year due to the war. And he is projecting slightly higher inflation.
- The difference between now and the 1970s is, back then, higher prices led to wage increases, which led to more inflation in a wage-price spiral that got out of hand, he says. Workers just don’t have the power for that today.
- “This is probably just going to slow the economy down, rather than trigger some long wave of inflation,” says Michael Madowitz, principal economist at the progressive Roosevelt Institute.
The bottom line:
This is not your father’s economic shock. Yesteryear’s bell bottoms would look a bit weird if you trotted them out today.