To avoid losing funding, many states are pursuing proven cost-saving strategies like downsizing inpatient care rather than untested approaches, some experts say.
Listen to the article7 min
The Rural Health Transformation Program is beginning to reshape how hospitals in rural America deliver care. But with nearly a trillion dollars in Medicaid cuts looming and pressure to show results or risk losing funding, many states are pursuing the safest path available: paying hospitals to downsize.
Congress established the $50 billion, five-year fund under the One Big Beautiful Bill Act to improve healthcare access, quality and outcomes in rural areas — and to win over a handful of Republicans who threatened not to vote for the bill over concerns it would gut Medicaid funding and take out rural hospitals in the process.
The funds are meant to improve rural healthcare access, which has been declining in the U.S. for years. More than 100 rural hospitals have closed in the past decade, and more than one-third are at risk of closing, according to the nonprofit Center for Healthcare Quality and Payment Reform.
The OBBBA will reduce Medicaid spending by an estimated $911 billion over the next decade and increase the number of uninsured people by 10 million, according to the Congressional Budget Office. The RHT program, meanwhile, could offset 37% of the estimated cuts to federal Medicaid spending in rural areas, or about 5% of the total estimated cuts to federal Medicaid spending, according to a KFF analysis of the CBO’s estimates.
In light of the massive funding cuts, the RHT program may not live up to its promises, experts say.
“If we weren’t facing a trillion-dollar cut in the Medicaid program over the next 10 years, this could be a once-in-a-generation policy,” said Bradley Cunningham, a regulatory and policy analyst at the Association of American Medical Colleges.
In December, all 50 states received their first-year awards, totaling $10 billion and averaging roughly $200 million per state. The program caps direct care spending at 15% of funds, steering the bulk of the remaining money toward infrastructure, technology, workforce and new care models.
However, states only had about seven weeks to prepare their applications. So, their plans largely focus on proven cost-cutting strategies rather than innovation, and now they’re locked into whatever they proposed.
“They had to prioritize speed over thoroughness,” said Aaron Bujnowski, a managing director with the healthcare industry group at consultancy Alvarez & Marsal.
As a result, rural health systems in at least 25 states will need to rightsize to receive funding, NPR reported in April. That can mean cutting services, such as dialysis or labor and delivery, or subsidizing conversions to the Rural Emergency Hospital designation, which requires eliminating inpatient care.
That could affect academic medical centers and other large providers, as they often absorb patients when rural facilities cut services or close. The wave of rural hospital closures over the past decade has already pushed patients to urban academic health systems, increasing volumes and straining capacity.
The point was driven home by an AAMC member who ran the only academic medical center in his state, said Leonard Marquez, senior director of government relations and legislative advocacy at the AAMC.
“He looked at me and said, ‘If my rural hospitals are not healthy, I cannot be healthy,’” Marquez said.
Five buckets, 50 plans
States are taking sharply different approaches to the RHT program. Bujnowski identified five broad categories: Downsizing and REH conversion, as in Kansas and Montana; workforce development, including Maine’s expanded scope of practice for physician assistants; technology and alternative payment models, with 42 of 50 states including some form of value-based care expansion; social determinants of health, including food-as-medicine programs in Arkansas and Pennsylvania; and states that are still refining their plans.
The applications for funding were “so divergent” that it’s difficult to discuss the program in holistic terms, Cunningham said.
Moreover, the program’s clawback authority, which allows the CMS to reduce a state’s funding in subsequent years if it fails to demonstrate outcomes, is weighing heavily on states’ decision-making.
Read More in Hospitals
Because of this, states have strong incentives to pursue proven models rather than untested approaches, as they must demonstrate measurable progress in the first year or risk losing funding in the second.
That dynamic likely limits innovation and spurs cuts because reducing services will quickly lead to direct and measurable progress. So, states are more inclined to expand capitated primary care payments or subsidize REH conversions — interventions with existing track records — than attempt something novel without a demonstrated history of results.
Still, not everyone sees the service cuts as a loss.
Framing the program as incentivizing hospitals to shrink is misleading, said Robert Parris, a managing director who leads government-focused healthcare advisory work at consulting firm Huron. What’s actually happening, he said, is that communities are getting more of what they need and less of what they don’t.
“It’s more about reallocation as opposed to taking away,” Parris said.
The program is also shifting how leaders think — from what services a facility can provide within its own walls to what care the surrounding population actually has access to, said Paul Johnson, a managing director who works directly with rural hospital clients at Huron.
Many hospitals had these changes on their wish lists for years, but they couldn’t justify the investment because they were focused on surviving the next budget cycle.
“It’s almost like a license for them to pivot into things that they know they’ve had to do,” Johnson said.
Programs over people
But with nearly half of rural hospitals operating in the red, the 15% direct-care cap doesn’t replace what they lost from Medicaid cuts, forcing difficult decisions about which services to keep.
Hospital boards are weighing four options, Bujnowski said: Close services, convert to a Rural Emergency Hospital, develop truly innovative payment models or improve access to technology like digital health tools.
In many instances, the first two offer the clearest path to continued funding under the RHT program.
The need to demonstrate outcomes, as well as the looming threat of funding clawbacks, could also cause hospital leaders to become overly focused on program management at the expense of the communities they serve.
“The most common mistake could be to put programs over people,” Bujnowski said.
The best leaders will ensure their initiatives stay aligned with what patients in their communities actually need. Boards should ask what sustained, community-appropriate care looks like beyond 2030, when the program’s funding runs out.
“That should be your North Star,” Bujnowski said.
But whether the program’s limitations allow for genuine transformation — or simply a managed, federally-funded downsizing — is a question that won’t be answered for years.
This week we’re highlighting a trio of stories that shed new light on issues An Arm and a Leg has been tracking closely:
A sharp investigation from our partners KFF Health News on who’s actually filing medical debt lawsuits.
How one state is cracking down on aggressive medical credit card marketing.
Some new, encouraging data suggesting more seniors can afford their medications.
Let’s go!
In at least one state, doctors are now suing patients more than hospitals are
One of the most perplexing realities we’ve come across while reporting on the U.S. health care system (and there are MANY) is this: Hospitals routinely sue their patients over medical debt, yet recoup very little money in the process. So why do they bother?
In fall 2023, we published a two–part investigation with Scripps News and The Baltimore Banner digging into that question.
Since then, we’ve been tracking efforts by advocates, lawmakers, and federal agencies to rein in the most aggressive medical debt collection practices — like destroying a patient’s credit, garnishing their wages, or foreclosing on homes.
And now, in at least one state — Connecticut — KFF Health News and the CT Mirror found that public pressure persuaded many hospitals to stop suing patients over medical debt altogether. Cool!
And recent legislation targeting aggressive medical debt collection practices doesn’t cover non-hospital health care providers. Neither do medical debt protection laws in most other states.
As one Connecticut state senator put it, lawmakers will need to to “go bigger if that’s where the heart of the matter is.”
On a brighter note, Connecticut has passed another law looking out for people facing medical debt…
New rules around CareCredit and other “medical” credit cards
Last week, Governor Ned Lamont signed a bill limiting the aggressive and confusing marketing of medical credit cards inside doctors’ offices and veterinary offices.
Connecticut joins California, Illinois, and New York in passing laws to protect patients from these financial traps.
Health care providers are increasingly pushing medical credit cards as an alternative to in-house payment plans. CareCredit, the biggest player in the field, says these cards are accepted at more than 285,000 locations, including many hospitals.
The appeal for providers is pretty straightforward: Outsourcing billing to a third party reduces administrative burden.
According to Patricia Kelmar, senior director of health campaigns with PIRG, patients frequently don’t understand what they’re agreeing to — whether they’re handed a form at the front desk or an iPad in the exam room.
“It’s just not the place to be looking at terms and conditions,” she says.
As we covered in a previous First Aid Kit, those terms and conditions usually include something scary: deferred interest. In most states, medical debt tied to medical credit cards also isn’t protected by the same consumer laws that cover regular medical debt — New York being the notable exception.
Connecticut’s new law adds meaningful friction that could make it harder for patients to sign up for something they don’t understand:
Health care providers can no longer submit or help fill out applications on a patient’s behalf.
Provider logos are banned from credit card marketing materials, making it clearer the card isn’t affiliated with the doctor or hospital.
Providers can’t charge these cards for services covered by Medicaid.
Kelmar, who’s collecting stories from patients, says it’s a step forward — and a pretty unlikely one, given that Synchrony Financial, which operates CareCredit, is based in Stamford, CT.
Apizza, anyone?
A law from 2022 is making a real difference for seniors
A new study in JAMA finds that legislation capping out-of-pocket prescription costs for seniors has helped many stay on top of their medications.
And, as Undark explains, those good results may be only the beginning. The law was only beginning to phase in during 2024; the full out-of-pocket cap took effect in 2025, and the study’s authors expect even stronger results to follow.
With commercial medical costs projected to increase 9.0% in 2027, patients are feeling the financial squeeze from administrative friction generated by the payer-provider AI arms race.
KEY TAKEAWAYS
PwC projects a 9.0% commercial medical cost trend for group plans in 2027, driven by structural inflators like AI-enabled documentation tools, rising specialty pharmacy costs, and IDR payments.
As payers aggressively deploy AI-driven pre-payment reviews to combat rising costs, providers are automating their defenses, creating an expensive administrative arms race that fails to lower systemic costs for the consumer.
To navigate this financial squeeze without alienating their communities, health systems must shift away from back-end collections and prioritize transparent, empathetic pre-service financial clearance.
Last year, PwC projected a 8.5% medical cost spike in the commercial group market. Unfortunately, the professional services company’s forecast for the next year does not suggest there will be any relief for rising healthcare costs.
According to PwC’s latest Medical Cost Trend: Behind the Numbers report, the 2026 group cost trend has been retroactively adjusted upward to 9.0%. Looking ahead to 2027, health plan actuaries expect that 9.0% growth rate to sustain in the group market, alongside an 8.5% increase in the individual market.
With historical deflators, like biosimilars and site-of-care shifts now fully embedded into the baseline, the cost environment heading into 2027 represents a structural shift rather than a temporary spike, according to the report.
Five Cost Inflators in 2027
Health plan actuaries point to five distinct inflators driving medical costs higher across the commercial sector.
1. AI-Enabled Revenue Optimization
While revenue cycle leaders may say that payers started the battle of the bots, provider use of AI-powered scribes and ambient documentation tools are leading to higher E/M levels and higher-severity DRG assignments. Consequently, health plans are seeing higher billed allowed amounts and increasing per-member-per-month trends without a corresponding change in actual care utilization or contracted rates.
2. Provider Reimbursement Pressures
Hospitals continue to face elevated labor expenses and rising input costs for drugs and supplies. To offset these structural costs, health systems are leveraging market consolidation to negotiate higher commercial reimbursement rates.
3. Surging Pharmacy Costs
Pharmacy trend continues to outpace overall medical trend. Spending on cancer medicines alone reached $143 billion in 2025. Additionally, high-cost GLP-1 therapies are expanding well beyond obesity treatment, securing FDA approvals for cardiovascular disease and chronic kidney disease.
4. Behavioral Health Utilization
Between 2018 and 2024, behavioral health visit rates increased by 62.6%. Unlike other medical categories that are driven by unit cost, the behavioral health trend is actively fueled by sustained increases in patient utilization.
5. IDR Arbitration
The No Surprises Act’s Independent Dispute Resolution (IDR) process has become a significant revenue driver for providers. Providers won roughly 88% of payment determinations in the first half of 2025. A 2025 report found that IDR had generated $5 billion in costs, including $2.24 billion in direct payments to providers.
Looking at the Bigger Picture
While AI has been sold as a tool to improve efficiency, the technology has so far driven an expensive administrative arms race rather than acting as a systemic cost deflator. On the health systems side, providers are using AI-powered scribes and documentation tools to capture greater complexity and patient acuity. Meanwhile, health plans are deploying their own technology to auto-triage complex claims, detect billing anomalies, and flag provider outliers before funds are ever released.
Administrative friction between providers and payers ultimately causes patients to delay or interrupt necessary clinical care. It is critical that payers and providers work together to prevent this, according to Ryan Thompson, Chief Revenue Cycle Officer at Providence.
“It’s incumbent on both payers and providers to identify what we can do differently to mitigate that friction that causes patients to interrupt or delay care,” Thompson says.
This puts revenue cycle leaders in a tricky position, where they are expected to drive collections from cash-strapped patients without alienating local communities by focusing solely on revenue optimization.
To counteract the 2027 cost trajectory without damaging patient trust, health systems must prioritize transparent, pre-service financial clearance. Ryan Klein, Senior Director of Patient Access and Financial Experience at UW Health, emphasized that leaning into empathy and flexibility ultimately protects both the patient and the bottom line.
“An experience-first approach, I don’t think it undermines revenue goals,” Klein stated. “I think it just simply sets up the patient to contribute to their out-of-pocket liability in the way that best works for them.”
There are a lot of eye-popping statistics that capture the burden high health care costs put on so many Americans. Nearly three in 10 adults say they have problems paying medical bills. More than 40% say they skip medications because of the cost.
The stat that always stops me in my tracks is the fact that Americans have nearly $200 billion in unpaid medical bills in collections,according to one recent estimate. The average consumer facing collections in 2020 had more medical debt than all other sources of debt — credit cards, phone, utilities — combined.
“If a debt collector is calling you up or is knocking on your door, more than half of the time, it’s for medical debt,” said Neale Mahoney, a Stanford University economist and one of the nation’s leading scholars on medical debt.
Mahoney has spent two decades studying the scale of the country’s medical debt problem, as well as the effectiveness of policies intended to relieve people’s medical debt. From 2022-2023, he worked in the Biden administration on regulations to remove unpaid medical bills from people’s credit reports.
We talked with Mahoney about the fate of those regulations under the Trump administration, and what we’ve learned about the best way to protect people from getting medical debt in the first place.
Here are a few of the takeaways:
The Trump administration is rolling back Biden’s regulation of medical debt. Credit agencies sued to prevent the federal government from banning overdue medical bills from credit reports, and the White House declined to defend it. New guidance under Trump also challenged state protections for medical debt.
Nonprofits — and some local governments — have paid off medical debt for millions of Americans, in hopes of easing stress and improving people’s health. Mahoney’s research points to bigger improvements in health outcomes for patients who got debt relief sooner rather than later. One recent study showed patients who got their bills cleared within a few weeks of getting care were more likely to get diagnosed and treated for heart disease and diabetes than those who didn’t get help. However, an analysis of people who had their debts wiped after carrying them for years found no improvements to self-reported physical or mental health.
Mahoney believes helping patients avoid medical debt through health insurance or hospital financial assistance, which wipes out some or all of a patient’s bill, is the most effective approach. Many people, however, struggle to take advantage of either due to obstacles like restrictions from insurers and extensive applications to get help from hospitals. Patients caught up in what Mahoney has dubbed “the annoyance economy” often end up in money-losing fights. “For too many of us, navigating the U.S. health care system can feel like a second job,” Mahoney said, “at the precise moment when we don’t have the time and energy to take on a second job.”
One promising option to prevent people from falling into medical debt, Mahoney said, is for hospitals to auto-enroll eligible patients for financial assistance — a process known as “presumptive eligibility.” California, Illinois, Oregon and North Carolina have adopted auto-enrollment requirements for hospitals, and more states are considering it. “I would be eager to see hospitals working on this and sharing best practices,” Mahoney said, “so that we can provide relief to people who need it while still recovering payments from people who can afford it.”
One of those reasons is the growing number of states looking to require hospitals to auto-enroll patients in financial assistance programs. I’ve been reporting on this idea of presumptive eligibility for years, and for the last few months, I’ve been working on a special series diving deep into the pros and cons of forcing hospitals to provide more charity care. Those stories will drop this fall.
The Federal IDR Operations final rule introduces vital changes to fees, batching, and eligibility, but a lack of federal enforcement leaves providers battling payers for post-decision payments.
KEY TAKEAWAYS
The final rule slashes administrative fees and relaxes batching constraints to make pursuing lower-dollar claims much more financially viable for providers.
Payers must now provide essential claim details upfront to streamline eligibility determinations and reduce administrative friction.
Revenue cycle leaders should advocate for legislative action to hold payers accountable because the new rule lacks mechanisms to enforce post-decision payments.
While there is a significant administrative lift that comes with navigating the Federal Independent Dispute Resolution (IDR) process comes with a heavy administrative lift, the system has proven to be a significant driver of recovered revenue for providers.
To address operational friction for all parties, federal regulators have finalized the Federal IDR Operations rule. This update includes adjustments designed to standardize data, clarify timelines, and streamline the process.
For revenue cycle leaders, understanding these updates is essential to maintaining compliance and optimizing cash flow without adding unnecessary overhead.
Open Negotiation and Communication
The final rule mandates that all parties use the federal open negotiation portal to initiate the dispute process.
This requires providers to submit standardized data elements, creating a uniform communication channel. By centralizing the exchange, regulators aim to move away from the chaotic web of emails and spreadsheets that have often complicated early-stage resolutions.
Clarifying Eligibility
Determining IDR eligibility has been a time-consuming step for revenue cycle teams, but the final rule shifts more responsibility to payers.
Payers must now provide essential claim details at the time of the initial payment or denial. This includes the Qualifying Payment Amount (QPA) and specific remittance codes indicating whether a claim falls under state or federal jurisdiction. This upfront transparency allows providers to accurately assess eligibility before committing resources to a dispute.
Reducing IDR Fees
Perhaps most notably, the final rule reduces the non-refundable administrative fee to just $15 per party, per dispute. This represents an 85% drop from the previous $115 rate.
While the final rule establishes that these fees will now be collected earlier in the workflow to maintain system capacity, the lower financial barrier to entry makes it far more viable for providers to pursue arbitration for lower-dollar claims. Ultimately, this allows revenue cycle teams to seek out-of-network reimbursements without the fear that the administrative cost of the dispute will eclipse the potential recovery.
Revamped Batching Rules
New batching rules will help providers to more efficiently manage IDR costs and consolidate efforts by relaxing previous constraints and offering clearer guidelines for grouping claims.
Providers can now batch items and services billed under the same or similar service codes. To qualify, these claims must involve the same provider and the same payer, and they must have occurred within a specified 30-day window.
Enforcing the Cooling-Off Period
The NSA originally established a 90-day cooling-off period following a final determination to help manage dispute volumes.
The final rule explicitly clarifies how this timeline is triggered and applied. Providers cannot continuously submit the same disputed item or service code for the same payer once a determination is made. Revenue cycle teams will need to refine their internal tracking processes to ensure compliance with the cooling-off window and avoid administrative dismissals.
Will Payers Play Nice?
While the final rule clarifies details of the IDR process, it neglected to address comments from providers calling for an enforcement mechanism. Health systems are increasingly winning their IDR cases, only to find that payers are simply refusing to remit the owed amounts, according to Kathy Stull, manager of revenue cycle and analytics for HFMA.
“Instead of even getting the incorrect payment, they’re not going to pay anything,” Stull noted during the recent HFMA Region 1 Annual Conference.
If payers fail to make post-decision payments, revenue cycle leaders and health system government relations teams should advocate for H.R. 4710, a proposed bill that would impose civil monetary penalties on insurers for every instance they fail to pay following an IDR loss.
Hospital monopolies get the headlines – but new research shows health insurance markets are highly concentrated in every state, giving insurers more pricing power than most policymakers realize.
Hospital consolidation dominates the discussion on health care costs – with good reason. There is overwhelming evidence that it raises prices. But every hospital must ultimately negotiate rates with insurers, yet the consolidation story in the health insurer market has only gotten a tiny fraction of the attention. This is a mistake. While the insurer market is not as highly consolidated as the hospital market, it is still highly concentrated by any reasonable antitrust standard, and a major (and under-estimated) driver of cost growth.
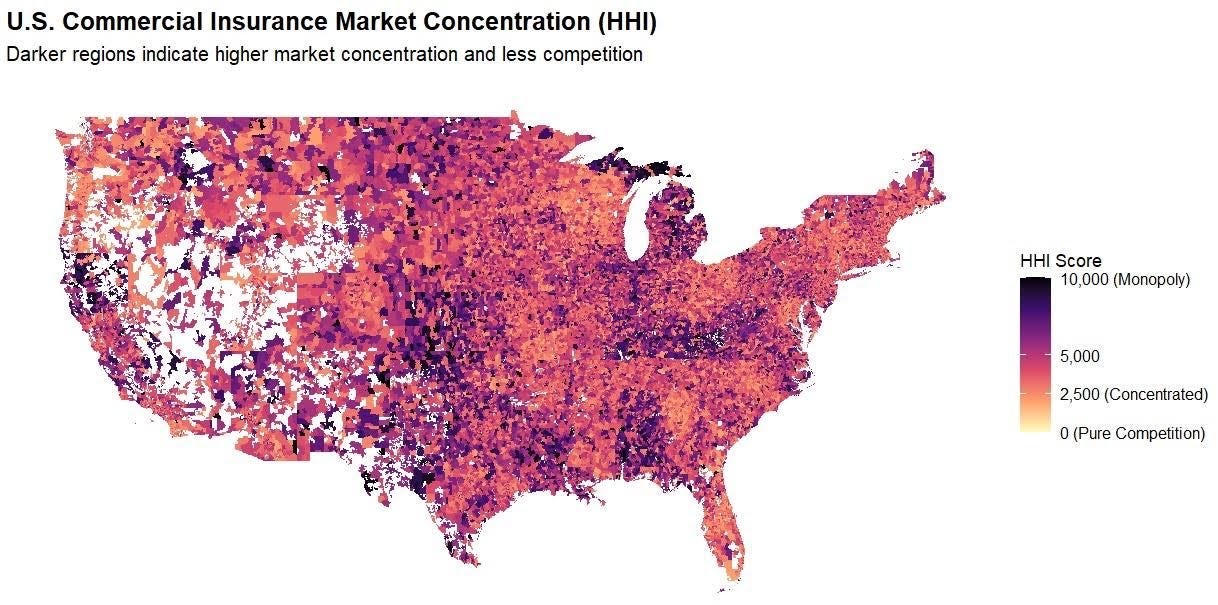
The Department of Justice (DOJ) and Federal Trade Commission (FTC) use the Herfindahl Hirschman Index (HHI) to measure market concentration, where >1,800 is highly concentrated, 5,000-7,500 is where a few firms hold substantial market power, and >7,500 is a near monopoly, where a single firm holds absolute (or near absolute) price-setting autonomy. The hospital market is heavily concentrated and has an average HHI score of 5,273, with 97% of markets being at least heavily concentrated and 64% being near or complete monopolies.
By comparison, our recent work similarly shows a high degree of consolidation among insurers. (Figure 1) We found that the state-level average HHI score in the commercial insurance market was 4,458, with 50 of 50 states (100%) at least heavily concentrated, comparable to hospital markets. This means that in almost every state, health insurers hold pronounced power in price-setting, a key component of the health care cost crisis roiling the country. The most competitive states (although still very highly concentrated) were Oregon (2,870), New York (3,203), and Georgia (3,222), whereas Kentucky (6,752) and Alabama (6,988) are near monopolies.
We find that insurers are even more consolidated than previously reported by the American Medical Association (AMA). Yet the market power of insurers, in combination with hospitals, is a vastly under-appreciated and under-studied driver of costs.
There are several reasons why it is important.
1. Vertical integration
Vertical integration is rapidly accelerating the ability of insurers to consolidate power and redefining what an insurer even is (UnitedHealth/Optum, CVS/Aetna, Cigna/Express Scripts, Elevance/Carelon, BCBSA/Ascendiun). This means that traditional plan-level data (such as that used by researchers and the DOJ/FTC) underestimates the true market power of insurers, and the shadowy network of MSOs, banks, and vendors makes it very difficult to quantify, absent new reporting or regulatory requirements
2. Geography
Where you live is important since it determines where you receive care and buy insurance. In some states, the average competition tells the story, e.g. Louisiana, Kentucky, Alabama, since certain insurers dominate the metro areas and everything in between. In others, the reassuring state averages (CA, NY) mask the variance, and hide the pockets of very uncompetitive markets, particularly in rural areas. Understanding this issue at a market level is important for creating transparency and accountability, to ensure that everyone has options and access to affordable health insurance.
3. Competition
Competition among insurers and hospitals matters, as power asymmetry and/or collusion create dysfunctional markets where costs are “optimized” for the purposes of power and profits, not to make health care more affordable for consumers. It is also important to look at competition among insurers. Market dominance confers advantages that have little to do with delivering better care, such as leverage over providers, captive employer relationships, and pricing power insulated from competition.
While insurer markets aren’t as concentrated as hospital markets, they’re concentrated enough to matter, and the structure of that concentration makes it a distinct and important part of the cost problem. In our next piece, we will show which carriers hold dominant positions and where, and why the answer surprised us.
This research was made possible by the support of Arnold Ventures.
Data from Clarivate Managed Market Surveyor dataset. Includes FI/SI/HMO/PPO/POS/ACA plans.
HHI scores weighted according to zip-level and policy volume. Concentration levels: Red – Extreme; Orange – Severe; and Yellow – Very High.
A Trump administration plan to overhaul wage levels for visa holders is jolting hospitals and long-term care facilities that are heavily reliant on foreign-born workers.
Why it matters:
It’s the latest immigration-related policy change to loom over the health care workforce, coming after President Trump’s $100,000 H-1B visa fee and the suspension of certain immigrants’ work authorization renewals.
The latest move could further drive up costs for providers already struggling with staffing shortages, thin margins and growing patient demand, because many health jobs can’t be outsourced or automated.
Driving the news:
The Department of Labor wants to change the formula for calculating what it considers “fair minimum pay” for workers on certain visas, like H-1Bs, and green card sponsorship jobs.
The administration says the change would make it harder for companies to use visa programs to obtain cheaper labor and undercut American workers.
But the rule could have an outsized effect on health systems, testing labs, nursing homes and research institutions that sponsor foreign-trained workers.
There’s special concern about rural health providers that rely heavily on foreign-born clinicians to fill gaps in care in underserved areas.
Critics say the changewon’t adequately account for regional wage differences or experience levels.
They also warn a higher wage requirement will force employers to raise pay for U.S. workers to comply with labor laws — and make it unsustainable to hire foreign-born talent.
The big picture:
The U.S. health care system is heavily dependent on a foreign-born workforce. Immigrants make up about 16% of registered nurses nationwide, per a KFF analysis.
They make up 28% of the U.S. long-term care workforce, KFF found.
“This has the potential to significantly limit the sector’s ability to provide timely and quality health care services to those in need, both now and in the future,” Dana Ritchie, associate vice president of the American Health Care Association and National Center for Assisted Living, wrote in public comments on the proposal.
Zoom in:
Lynn Bruder, the CEO of staffing firm Nucleus Healthcare, said wage rates for visa-holding nurses on the lower end of the pay scale could jump 25% to 35% in certain markets, or from about $40 an hour to more than $50 an hour.
“The likely outcome is continued reliance on significantly more expensive agency staffing solutions and reduced ability for hospitals to build stable, long term workforce pipelines,” Bruder wrote in comments about the rule.
The other side:
The Department of Labor declined to comment. But visa programs have long been criticized for suppressing wages across many industries.
The changes would force employers to pay an estimated $6.5 billion in additional wages and increase the average certified wage by approximately $14,000 per year, according to the proposed rule.
“These proposed revisions aim to better align prevailing wage levels with the wages paid to U.S. workers,” the Labor Department wrote.
The window for public comments on the proposal closed this week.
The bottom line:
Health care providers say the administration is treating hospitals and nursing homes like any other employer, even though the workforce is being squeezed by an aging population and rising demand for care.
“Larger hospital systems may be able to absorb this increase, but you’ll see employers who are much smaller or mid-sized won’t,” Ann-Rose Johnson-Lewis, director of legal services at WorldWide HealthStaff Solutions, told Axios.
“You’ll see rural heath care systems not be able to absorb that. We’ll see a reduction in the workforce, fewer new hires and, ultimately, the broader economy will see the consequence of that.”
Try making a doctor’s appointment at your primary care provider’s office or an urgent care clinic, and often, it won’t be with an MD or DO. As more people need more care—and as more types of preventative care are available—offices are increasingly relying on nurse practitioners (NPs) and physician assistants (PAs) to see patients and save costs.
That’s not necessarily a bad thing; though they don’t have as extensive training as an MD or DO, both nurse practitioners and physician assistants can deal with many of the complaints someone would have at their primary care office.
“An experienced PA or NP can do most of what a primary care physician does,” says Perri Morgan, a professor in family medicine and community health at Duke University School of Medicine who focuses on PAs and NPs in the health care work force. “And many practices find them to be a welcome addition to the bottom line” because they cost less to employ than physicians.
Nurse practitioners and physician assistants are paid less than doctors are, but in some states they can generate nearly as much income for practices because they can bill at the same rate as doctors, says Dr. David Chan, a professor at the University of California, Berkeley who studies health economics. Doctors make, on average, $239,200 a year, according to the Bureau of Labor Statistics—nearly double what physician assistants and nurse practitioners make.
In 2023, the most recent year for which data are available, there were 340,319 primary care physicians in the U.S., according to the National Center for Health Workforce Analysis. By contrast, there were an estimated 374,970 nurse practitioners and 29,433 physician assistants working in primary care in 2024.
Estimates suggest that in a decade, there will be many more NPs and PAs than MDs and DOs across medicine. While the number of physicians in the U.S. is projected to grow by just 3% between 2024 and 2034, according to the Bureau of Labor Statistics, the number of physician assistants is expected to grow by 20%, and the number of nurse anesthetists, nurse midwives, and nurse practitioners is expected to grow by 35% over that time.
In some states, nurse practitioners and physician assistants must be supervised by a physician to practice. But groups that represent the interests of NPs and PAs are advocating for more independence. They have persuaded many states to pass legislation that allows them to operate without a supervising physician. The American Medical Association, however, has worked to defeat such bills, calling the practice “scope creep” and arguing that it makes patients less safe.
Here’s what patients should know about PAs, NPs, and what you might get from one type of provider vs. another.
What is a nurse practitioner (NP)?
The technical name for a nurse practitioner is an advanced practice registered nurse, or APRN. There are four main types of APRNs: nurse practitioners, certified registered nurse anesthetists, certified nurse-midwives, and clinical nurse specialists.
Nurse practitioners can diagnose and treat illnesses, prescribe medications, manage chronic conditions, order and interpret diagnostic tests, and provide preventative care, says Valerie J. Fuller, president of the American Association of Nurse Practitioners (AANP). Fuller says NPs are unique because they are trained in nursing and so are extremely patient-centered. “I think patients who choose a nurse practitioner are really looking for a clinician who can diagnose, treat, manage their health needs, but who also takes the time to listen,” she says.
To become a nurse practitioner, you need an undergraduate nursing degree and a registered nurse license. Then you must go back to school to pursue a graduate degree: either a master of science in nursing or a doctor of nursing practice. After your graduate degree, you must pass a national certifying exam; only then can you receive an APRN license. (Not all states issue a specific APRN license; some issue similar authorization but call it a certification or registry.)
Nurse practitioners have what’s called full practice authority in 27 states, meaning they can practice without being supervised by a physician. That’s up from just 14 states in 2010. And although some states have passed legislation that requires visits with nurse practitioners to be compensated at the same rate as physicians, that’s not the case in all states. Medicare reimburses nurse practitioners at 85% of what they reimburse for physicians, Fuller says.
Fuller argues that allowing NPs to practice without a physician’s supervision encourages them to open up practices, helping close gaps in care. When Arizona allowed full practice authority, she says, the nurse-practitioner workforce grew by more than 50%. Millions of Americans don’t have access to basic primary care services, she says, and nurse practitioners can step up to help if they’re allowed.
What is a physician assistant (PA)?
Physician assistants came about in the wake of the Vietnam War, when thousands of medics were returning from overseas and looking for a place to fit in the medical field, says Morgan, of Duke. Today, to recognize their independence, the American Academy of Physician Associates (AAPA) is advocating for PAs to be referred to as “physician associates” rather than “physician assistants.”
PAs help fill gaps in medical care, just like NPs do. “They are trained as core generalists,” says Chantell Taylor, head of advocacy at AAPA. “They’re attractive to employers looking to lower wait times and increase patient access, particularly in rural and underserved areas.”
To start a PA program, students must have a bachelor’s degree, complete prerequisite coursework, and enter PA school with more than 3,000 hours of patient-contact experience, Taylor says. PA programs usually last three academic years that include more than 2,000 hours of clinical experience.
That clinical experience includes rotations in family medicine, emergency medicine, surgery, pediatrics, and other specialties, and prepares graduates to evaluate, diagnose, and treat patients across a broad range of medical specialties and practice settings. PAs graduate with a master’s degree—usually a Master of Science in physician assistant studies or a Master of Clinical Health Services—and then must pass the physician assistant certifying exam to receive national certification and obtain a state license.
Some PAs practice in primary care, but others specialize in surgery, oncology, and other areas, assisting doctors and making them more productive, says Morgan. A PA could prep patients for surgery and close a patient up after surgery, for instance, allowing the surgeon to see more patients, she says. “PAs in specialties add at least as much value as ones in primary care,” she says.
The AAPA is advocating for states to lift the requirement that PAs be supervised by a physician; so far, nine states have done so. Five states have passed legislation to change the title of PA from physician assistant to physician associate.
Are NPs and PAs as effective as MDs and DOs?
Patients may be hesitant to see a NP or PA because they have less education and medical training than a doctor. There have been recent reports of poorly trained NPs missing key indicators of illness, most notably in a Bloomberg series about the rising numbers of nurse practitioners.
Both AAPA and AANP say that PAs and NPs are essential to provide care in rural and underserved areas with physician shortages, and that having more non-physicians providing care helps increase access for all Americans. The American Medical Association, on the other hand, says that while it supports the role of non-physicians, “they are not a substitute for physicians,” and that numerous studies show that patients want care led by physicians.
The training differences are stark. Physicians complete four years of medical school plus a three-to-seven year residency program, which can include 12,000 to 16,000 hours of clinical training. Nurse practitioners do not have a residency requirement and have about 500-720 hours of clinical training, and PAs are required to have about 2,000 hours of supervised clinical practice.
“The country is facing a health care workforce shortage, including shortages of both physicians and nurses,” the American Medical Association said in a statement provided to TIME. “One way to alleviate this shortage is by supporting physician-led care teams that leverage the skills of non-physician practitioners while ensuring that all members of the care team work together, under the direction of a physician, toward optimal care for patients.”
What does the research show about the effectiveness of each type of provider? It depends on the study, says Chan of UC Berkeley, who has examined the difference between NPs and physicians in an emergency-room setting. In one study, Chan looked at what happened in emergency rooms when the Veterans Health Administration began allowing nurse practitioners to practice without physician supervision in 2016. His work suggested that NPs ordered more external tests than did physicians, had more patients returning to the ER with infections than did physicians, and were more likely than physicians to prescribe antibiotics. But “the evidence is still kind of limited,” Chan says. Some doctors will have better patient outcomes than some nurse practitioners, but the reverse is true, too.
Other research suggests that both NPs and PAs can be as effective as doctors at taking care of chronic conditions in medically complex patients—and that they can help save money. One study of patients with diabetes seen at the VA found no clinically significant differences in diabetes outcomes of patients seen by a NP, PA, or physician.
Another study of VA patients with diabetes found that the health care costs were about 7% lower for NP and PA patients than patients who saw a physician, because patients who saw a doctor were more likely to use the emergency room and inpatient services. Morgan of Duke, the lead author of that study, speculates that this is because it might be easier for patients to reach their PA or NP than their physician, allowing their provider to help them address concerns or adjust medications quickly without having to go to the emergency room.
What’s most important, experts say, is that NPs and PAs work together with physicians to help fill care gaps and treat patients. Exactly how that team works together is still up for debate. Taylor, of the AAPA, calls the physician-led model “outdated” and argues that it “doesn’t fully leverage all provider types.” The AMA, on the other hand, argues that physician-led, team-based care is higher quality and more cost effective. And both have a number of studies to point to that prove their point.
“Increasingly, health care is about teams,” Chan says. “So the next question is: How do we best organize teams with NPs and doctors and others?”
Presbyterian Healthcare Services’ decision to exit most Medicare Advantage plans and eliminate 150 positions underscores a growing reality for provider-sponsored health plans.
KEY TAKEAWAYS
Rising utilization, reimbursement pressure and regulatory scrutiny are forcing organizations to reassess participation in Medicare Advantage.
Presbyterian’s move reflects a decision to prioritize care delivery and long-term financial stability over maintaining an unprofitable business line.
Financial flexibility and access to capital increasingly depend on demonstrating disciplined balance-sheet management.
Albuquerque-based Presbyterian Healthcare Services has announced it will discontinue most of its Medicare Advantage (MA) offerings beginning in 2027, affecting roughly 30,000 members, while laying off approximately 150 health plan and administrative employees. The system will continue operating its Dual Plus Special Needs Plan serving Medicare-Medicaid beneficiaries. According to Presbyterian, remaining in the broader MA market would limit its ability to invest in care delivery, workforce development and access initiatives across New Mexico. The move is another indication that provider-sponsored health plans are facing mounting pressure as MA margins tighten nationwide.
Many health systems entered Medicare Advantage to create integrated delivery models, diversify revenue streams and capture greater value from population health initiatives. However, elevated medical utilization, changing reimbursement dynamics and increased regulatory oversight have altered the financial equation. Presbyterian’s decision suggests leadership determined that the returns no longer justified the capital and operational resources required to compete effectively in the market.
The regional implications are significant. Presbyterian is one of New Mexico’s largest healthcare organizations, operating hospitals, clinics, physician practices and a health plan across the state. While the layoffs are concentrated in health plan and administrative roles, the exit removes a major local MA option and will require thousands of seniors to seek alternative coverage. At the same time, Presbyterian argues the move will allow it to redirect resources toward direct patient care and workforce investments, potentially strengthening healthcare delivery capacity over the long term.
There’s a larger lesson centered on strategic focus. Organizations often face pressure to maintain market presence across multiple business lines, even when margins deteriorate. Presbyterian’s action demonstrates the importance of regularly evaluating whether each service line advances the system’s long-term mission and financial objectives. Exiting a business can be difficult, but preserving capital for higher-value investments may ultimately create greater organizational resilience.
The decision also highlights why credit ratings deserve ongoing executive attention. Strong ratings are not simply a borrowing metric; they influence an organization’s ability to finance facilities, technology modernization, workforce initiatives and strategic growth. Rating agencies increasingly scrutinize operating performance, liquidity, leverage, governance and management’s willingness to make difficult strategic decisions when market conditions change. Fitch continues to maintain coverage on Presbyterian Healthcare Services, underscoring the importance of external evaluation of health system financial strength.
Healthcare organizations that delay corrective action risk eroding margins, weakening liquidity and increasing borrowing costs. Conversely, systems that demonstrate disciplined portfolio management often preserve stronger credit profiles and maintain greater access to capital during periods of industry disruption.
Presbyterian’s Medicare Advantage could signal a move towards strategic capital allocation, a growing priority in today’s environment. As reimbursement uncertainty and utilization pressures continue across healthcare, CFOs should view the announcement as a reminder that financial sustainability sometimes requires difficult choices today to preserve organizational strength tomorrow.
Issue: The 2025 budget reconciliation law (the One Big Beautiful Bill Act, or H.R. 1) reduces federal funding for Medicaid, Affordable Care Act (ACA) marketplaces, and the Supplemental Nutrition Assistance Program (SNAP) by about $1.3 trillion but adds $50 billion for the new Rural Health Transformation Program (RHTP). Additionally, the ACA enhanced premium tax credits expired on January 1, 2026.
Goal: To estimate the impact of H.R. 1 and the expiration of enhanced premium tax credits on state economies and employment levels, and state and local tax revenues in 2026, the first year of implementation, and 2029, when the legislation is fully implemented.
Methods: We estimate federal funding changes for the RHTP, ACA marketplaces, Medicaid, and SNAP, and use the IMPLAN modeling system to project economic and employment impacts.
Key Findings and Conclusions: We project that in 2026, the RHTP’s modest economic gains will be overshadowed by losses from budgetary cutbacks. The predicted combined national impact is 229,000 job losses, primarily affecting larger and more urban states. By 2029, 1.65 million jobs could be lost nationally, a 1.0 percentage point increase in the unemployment rate. Every state would experience substantial economic and employment losses, driven primarily by large Medicaid cuts.
Introduction
The Rural Health Transformation Program (RHTP), which provides five years of federal funding to help states improve health care access and quality in rural areas, was created through the 2025 federal budget reconciliation law known as H.R. 1 or the One Big Beautiful Bill Act. The law also made sweeping cuts to Medicaid, Affordable Care Act (ACA) health insurance marketplaces, and the Supplemental Nutrition Assistance Program (SNAP).1 Although the net result is deep reductions in health and nutrition funding, the federal deficit will rise by over $3 trillion because of large tax cuts also included in the law.2 H.R. 1 is expected to cause more than 10 million Americans to lose their health insurance due to the ACA and Medicaid reductions, 3 million people to lose food assistance because of SNAP cutbacks, and a potential 51,000 preventable deaths due to Medicaid cuts.3 On January 1, 2026, months after H.R. 1 was signed into law, enhanced premium tax credits for the ACA marketplaces expired, causing ACA premiums to rise steeply and leading to rapid coverage losses.
This brief estimates the economic impacts of these sweeping changes to the health care landscape. Using the IMPLAN economic modeling system, we examine the combined effects of H.R. 1 and the expiration of the ACA tax credits on every state’s economy and employment in 2026, the first year of implementation, and 2029, when the law’s changes are fully implemented (see “How We Conducted This Study”). It builds on earlier briefs that have examined the potential economic effects of the U.S. House of Representatives version of the H.R. 1 legislation and the expiration of the ACA subsidies.4
Timeline and Scale of H.R. 1 Cuts and Expansions
The Congressional Budget Office (CBO) estimated that H.R. 1 will reduce federal Medicaid spending by more than $900 billion between the 2025 and 2034 fiscal years, while federal funding for the ACA marketplaces and SNAP will each be cut by almost $200 billion over the next decade. The RHTP adds $50 billion in funding over the decade.5 The expiration of ACA enhanced premium tax credits means federal funding is about $335 billion lower over a decade compared to if they were extended.6
H.R. 1 changes are phased in, as illustrated in cumulative dollar changes in Exhibit 1 and percentage changes in Exhibit 2. While the RHTP began on January 1, 2026, alongside the expiration of ACA tax credits, Medicaid and SNAP cuts will largely be implemented later. By 2034, cumulative federal Medicaid reductions will total $904 billion, exceeding cumulative reductions in ACA marketplace and SNAP outlays. However, although the dollar amounts lost from Medicaid are much greater, the ACA marketplace and SNAP cuts are deeper when measured as a percentage of their annual baseline expenditures. In 2029, for example, federal Medicaid funding will be cut by 12.7 percent, while ACA marketplace funding will fall by 23.4 percent and SNAP funding by 19.7 percent. Additional losses from the expiration of the ACA enhanced premium tax credits means the combined impacts on the ACA marketplaces are even larger than shown in the exhibit. Key policies changes are summarized in Exhibit 3.
Economic Consequences in 2026: Funding Losses Eclipse Modest Economic Gains
In 2026, we project the RHTP launch and the expiration of ACA tax credits — both beginning in January of this year — to have a largely net negative impact on state economies, jobs, and tax revenues.
Rural Health Transformation Program. Ten billion dollars in RHTP funds have been distributed across 50 states, ranging from $281 million and $272 million for Texas and Alaska to $147 million for New Jersey. State economies, as measured by their gross domestic product (GDP), will be $13.8 billion higher as a result (see Appendix 1). The number of new jobs across the country will likely rise by 110,100, of which 51,600 are health-related, and economic gains will contribute to $847 million in additional state and local tax revenues. Relative gains will be higher in smaller rural states.
ACA health insurance marketplace. In 2026, the expiration of the enhanced premium tax credits and other H.R. 1–related changes will see federal funding for the ACA marketplace fall by $31 billion. State GDPs will fall even more, by $40.7 billion (Appendix 2), while state and local tax revenues will fall by $2.5 billion. This will lead to the loss of 339,100 jobs, of which 154,200 are health-related. Southern states, which generally did not expand Medicaid eligibility, tend to be more reliant on the ACA marketplaces. For example, the ACA cuts will lead to 83,400 jobs lost in Texas and 57,500 in Florida, both nonexpansion states. In comparison, Medicaid expansion states California and Louisiana are expected to lose 20,300 and 7,000 jobs, respectively. Overall, the average expected job loss is approximately 2,800 in expansion states, compared with 22,300 in nonexpansion states.
One potential economic effect not captured in our analysis: those who continue to get coverage through the ACA marketplaces will have to pay hundreds or thousands of dollars more for coverage or shift to ACA plans with higher cost sharing, undermining their financial security and reducing spending power on other goods and services.7
Combined Economic Impacts in 2026
While the infusion of $10 billion into state economies for rural health contributes to some economic growth, it is overshadowed by the $31 billion in federal funding cuts to ACA marketplaces.
Exhibit 4 presents combined national estimates for 2026, including the states with the largest employment losses and the largest employment gains. States with the greatest losses — Georgia, Texas, Florida, South Carolina, Mississippi, Alabama, Tennessee, and Louisiana — are Southern states that rely more on the ACA marketplace. Georgia, Texas, and Florida lose between 30,700 and 79,500 jobs, equivalent to a 0.5 percent to 0.6 percent decline in the employment rate. States with job losses also have substantial reductions in their GDP and state and local tax revenues. States with the largest job increases — Alaska, Vermont, Wyoming, Montana, North Dakota, Rhode Island, Hawaii, and Maine — gain 900 to 2,000 jobs each, equivalent to a 0.3 percent to 0.6 percent increase in the employment rate. States with job gains also will have GDP gains and increased state and local tax revenues (Appendix 3 shows detail for all states in 2026).
Exhibit 5 presents the national map of states gaining and losing jobs. Our analysis indicates that 22 smaller and rural states will have net positive gains and job growth, while the District of Columbia and 28 states, generally larger and more urban, will have net federal funding losses and lose jobs in 2026. Many of the states losing jobs are Southern states that did not expand Medicaid.
Economic, Employment, and Tax Consequences in 2029: All States Will Lose
In 2029, when H.R. 1 provisions are fully implemented, we project that all states will lose federal funding and suffer substantial economic and employment losses.
Medicaid. In 2029, federal Medicaid funding will drop by $90.9 billion, causing state GDPs to fall by $118.5 billion (Appendix 4). Medicaid cuts also mean 996,000 fewer jobs nationwide in 2029, half of which will be health-related, including in hospitals, clinics, pharmacies, or nursing homes. States with the largest job losses include California, New York, Pennsylvania, Illinois, Texas, Arizona, Ohio, and Michigan, which lose between 150,200 and 36,600 jobs. States that expanded Medicaid eligibility under the ACA will likely face deeper losses because H.R. 1 targeted them with policies like Medicaid work requirements, restrictive enrollment procedures, and higher cost sharing only in expansion states. Individual and business income losses will cause state and local tax revenues to fall by $8.8 billion nationwide.
SNAP. Federal SNAP funding will be cut by $21.8 billion in 2029, causing state GDPs to decline by an estimated $18.3 billion (Appendix 5). The SNAP cutbacks will cause 135,500 jobs to be lost in 2029, of which about 75,000 are food-related jobs. Other research has examined SNAP’s importance in supporting revenues and jobs at grocery stores that feed all Americans.8 States with the greatest job losses due to the SNAP budget reductions include California, New York, Texas, Florida, Illinois, Pennsylvania, Michigan, Georgia, and North Carolina, which will lose between 23,000 and 4,200 jobs. Under H.R. 1, states with higher over- and underpayment error rates must pay 5 percent to 15 percent of SNAP benefit costs, leading to drastic reductions in federal payments. The expansion of SNAP work requirements and the halving of federal funding for administrative costs will likely make it harder for states to implement operational changes to lower their error rates.9 State and local tax revenues will decline by approximately $1.9 billion nationwide because of cuts to SNAP.
Combined Economic Impacts in 2029
Exhibit 6 summarizes key results for the combined economic impact of the RHTP and ACA marketplace, Medicaid, and SNAP funding changes. In 2029, RHTP is expected to continue providing $10 billion in federal funding to states, but it will be eclipsed by ACA marketplace losses amounting to over $57 billion. Federal funding for Medicaid will drop by almost $91 billion and SNAP funding by almost $22 billion. Combined, these cuts will total $160 billion (Appendix 6 presents more detail for all states.) Our IMPLAN analyses indicate that these changes will reduce state GDPs by $197 billion in 2029, about 23 percent more than the federal savings due to funding cuts being magnified by the “multiplier effect.”
Overall, there will be 1.65 million fewer jobs in 2029 — almost half of which will be in health care — roughly equivalent to a 1.0 percentage point reduction in the national employment rate. State and local tax revenues will be more than $14 billion lower in 2029.
To illustrate relative losses, Exhibit 6 shows job losses as a percentage of state employment in the eight hardest-hit states, all of which have expanded Medicaid eligibility. The exhibit also highlights states with the largest number, rather than percentage, of jobs lost, ranging from 207,100 in California to 51,000 in Ohio.
Over the next decade, funding cuts and changes to Medicaid, the Supplemental Nutrition Assistance Program, and Affordable Care Act marketplaces through H.R. 1, and the expiration of the ACA enhanced premium tax credits, have the potential to reshape the U.S. economy and health system. The $50 billion funding increase through the Rural Health Transformation Program will not offset the much larger losses in health insurance coverage, decreased access to care, and increased hunger caused by H.R. 1 cuts.
We focused on two years in this brief: 2026, the first year of the law’s implementation, and 2029, when the law’s changes are fully implemented. Economic and employment impacts across states will also occur in 2027 and 2028, though those interim years are not presented here. By 2029, federal funding cuts will total $160 billion, triggering 1.65 million job losses. Slightly less than half of the jobs lost would be in health care, the leading sector for job growth in recent years.10 Research suggests these cuts also could reduce the capacity of hospitals and community health centers to provide care.11 The RHTP might offset a small portion of these losses through 2030, but it will be eclipsed by larger losses, particularly in urban areas where most Americans live. The economic repercussions of jobs lost in other areas, including grocery stores and food-related industries, will likely ripple to sectors such as retail, real estate, and construction across the nation.
Under H.R. 1, cuts to health and nutrition programs largely harm Americans with lower incomes, while tax cuts primarily benefit those with higher incomes. The CBO estimates that Americans in with lowest 10 percent of incomes will lose about $1,200 per year (3.1% of their incomes), while those with the top 10 percent of incomes will gain $13,600 per year (2.7% of their incomes).12 Other analyses reached similar conclusions.13
This brief illuminates another aspect of the budget cuts: how they harm state economies. While the budget cuts create $160 billion in savings for the federal government in 2029, state economic losses will outstrip those savings: we project state GDPs will decline by $197 billion, or about 23 percent more than the federal savings.
Cuts to Medicaid and SNAP will directly shift costs from the federal government to states. However, H.R. 1 will also lower state and local tax revenues by around $14 billion in 2029, making it harder for states to offset lost funds. Federal funding and tax revenue losses will likely force states to make further cuts to assistance programs and other public services like education. Though not directly required by H.R. 1, states could be forced to scale back programs such as home and community-based services for disabled and elderly populations.14
Proponents of the law explained that the budget cuts were intended to exclude “undeserving” populations from accessing benefits, such as able-bodied people who choose to not work, claiming these changes would ultimately help them gain jobs and incomes.15 But evidence indicates that work requirement programs do little to increase employment because they fail to address underlying reasons for unemployment.16 Moreover, by reducing the number of jobs in low-income communities, the new law could make it even harder for people to find jobs.
How We Conducted This Study
Estimating State-Level Federal Funding Changes
An important element of this analysis is estimating changes in federal funding for each state, based on the many sections of the bill. We began by estimating state “baseline” federal benefit expenditures for each state, using state estimates of Medicaid expenditures for fiscal year 2025 and actual SNAP expenditures for fiscal year 2024. These were then inflated to 2029 levels, based on Congressional Budget Office baselines, using data and methods described previously.17 For the Affordable Care Act marketplace, we used data about state-level ACA premium tax credits in 2024 and inflated these to 2026 and 2029 levels.
To estimate the reductions in federal funding that would occur at state levels we relied on the following sources:
We used Centers for Medicare and Medicaid Services Rural Health Transformation Program federal allocations to the 50 states in 2026.18 The total level of federal funding ($10 billion) will be the same in 2027 to 2030, although state allocations may differ slightly in future years. We assume that all $10 billion allocated in 2026 is spent that year; if actual outlays are lower, then the economic gains in that year will be reduced.
For the ACA marketplace analyses, we relied on the Urban Institute’s estimates of the state-level effects of the expiration of the ACA subsidies, H.R. 1 policies, and the value of ACA subsidies.19
State-level Medicaid funding reductions were based on detailed analyses published by KFF of the final version of H.R. 1, which included estimates related to the effect of work requirements, changes in provider taxes and state-directed payments, and shortened certification periods.20
State-level Supplemental Nutrition Assistance Program funding reductions were based on a combination of estimates of the impact of expanded work requirements by the Urban Institute21 and SNAP payment error rates for 2024 (to predict state matching requirements).22 Adjustments were made to accommodate final compromises in the legislation, such as potential adjustments for states with very high error rates and for work requirements in noncontiguous states.
Finally, all these state-level estimates were aligned with the CBO’s estimates of changes in federal funding for each of these programs based on the enacted version of H.R. 1, adjusting for programmatic budget interactions.23
Despite our efforts to use the best estimates available, we recognize that all projections are uncertain and that actual impacts may differ due to changing economic circumstances or state policy actions. Nonetheless, the analyses in this brief should provide conservative estimates of the approximate impact on federal funding levels and economic and employment effects.
Estimating Economic, Employment, and Tax Impacts
Our estimates of the economic, employment, and tax effects of reduced federal funding are produced using IMPLAN, a widely used input-output economic impact software system.24 The underlying logic of our analyses is that funding changes have “multiplier effects” that are felt initially in the health care and food sectors but soon spread out to other economic and employment sectors as well.
IMPLAN enables us to estimate three key impacts for states, their businesses, and residents: 1) changes in state gross domestic products (GDPs) caused by the reduction in federal funding; 2) changes in the number of jobs in the state, which are categorized as direct (health or food), indirect (other sectors) and total employment; and 3) changes in state and local tax revenues caused by the changes in household and business incomes. The definitions of these metrics were described previously.25
For Medicaid, we partitioned each state’s Medicaid loss in four health care sectors: hospital, ambulatory care, pharmaceuticals, and long-term care, based on estimated Medicaid spending in these sectors.26 The analysis of ACA marketplace changes was similar, although it did not include the long-term care sector, which is not covered by ACA plans. Our IMPLAN-based analysis of the cuts in SNAP funding was similar but focused on changes in food-related expenditures. As described in an earlier brief, households must blend SNAP benefits and their own income to purchase enough food; research shows that SNAP induces a marginal propensity to purchase more food. Thus, we allocated each state’s share of SNAP reductions in two parts: a 30 percent reduction in food purchases and a 70 percent reduction in other consumer goods purchased by low-income households.
Data about the types of organizations that will receive RHTP funding within states is not yet known, although CMS issued some guidelines for states, such as no more than 10 percent allocated for administration.27 Using the IMPLAN industry categories, we allocated each state’s allocation into funding for state health departments, hospitals, and ambulatory health clinics. In many cases, allocations may initially go to nonprofit organizations or businesses to help with health care staffing or health information technology; in the end we expect that the funds will ultimately be received by health care organizations.
All these analyses use IMPLAN’s Multi-Region Input-Output (MRIO) methodology to account for cross-state effects of the policies (sometimes called “leakages”).28 For example, some of the food purchased in Georgia may have been grown in Kansas or processed in Tennessee, so lower grocery purchases in one state may trigger losses in other states. For example, a nurse who loses her job in a Louisiana clinic might reside in Texas; thus, a job lost in one state could create economic losses in another.
How the Multiplier Effect Works
The figure below illustrates how the multiplier effect works for Medicaid and SNAP. For Medicaid, the reduction in federal Medicaid funds lead to reductions in state Medicaid programs’ budgets. In turn, the loss of insurance coverage lowers revenue to health care providers, like hospitals, clinics, pharmacies, and nursing homes. These are the direct effects.
In turn, health care providers must compensate for revenue losses by reducing how much they spend on staff and on goods and services from vendors (such as medical supplies, equipment, rent, and IT services). These businesses also must reduce spending on labor, goods, and services; the reductions in labor expenses means health providers and other businesses must lay off staff and reduce compensation. These are the indirect impacts of the policy change.
Finally, as employees lose income, they purchase fewer consumer goods and services (such as retail goods, transportation, groceries or rent). These are known as induced losses, which in turn lead to economic and employment losses. Falling personal and business income also lowers state and local revenue from income, sales, and other taxes, such as real estate taxes.
These principles also apply to the loss of federal SNAP funding. Although SNAP is administered by state agencies and benefits are distributed to recipients, the SNAP funds flow directly to grocery stores for food purchases, although as described above, economists recognize that consumers redeploy their available household income to purchase other goods and services. Parallel to the Medicaid example, these effects can be viewed as direct, indirect, and induced effects.
We focus on the effects of changes in federal funding because they are exogenous changes (“shocks”) in the resources available to each state and its residents caused solely by the federal policy changes. States, businesses, or individuals may compensate for the reduction in federal funding by shifting resources away from other uses (for example, cutting services or raising taxes) which have similar economic repercussions. Focusing on the federal budgetary changes makes our estimates more conservative. Also, some economic multiplier studies report the effects on a broader measure of economic activity, sometimes called output, which may double-count losses in production, wholesale, and retail sectors. We present estimates of changes in state GDPs, based on the value added (or lost) within a state; these are much more conservative and consistent with standard approaches for measuring state economies.
Medicaid, ACA, and SNAP cutbacks could have other harmful effects on health, nutrition, and well-being. A large body of research has demonstrated how the expansion of Medicaid coverage under the ACA led to improved health access, better health, and greater financial and mental well-being.29 SNAP has also been associated with better health and lower financial strain.30 For example, one report estimated H.R. 1 could cause medical debt to rise by as much as $50 billion,31 while another estimated 51,000 preventable deaths.32 The loss of health and nutrition benefits could impair health or mental well-being, leading to additional losses in productivity or higher health care costs. Our analyses do not account for these other health and social costs; they are based entirely on the economic repercussions of federal funding reductions on state economies and employment.


 Listen to the article7 min