New analysis shows hospitals are increasingly closing in poorer communities while new facilities are built in wealthier ones, reshaping access to care along economic lines.
As I wrote a few days ago, 700 rural hospitals are in danger of closing because they’re not getting enough money from either private insurers or Medicare and Medicaid to stay open. That would be on top of the 743 general acute-care hospitals that have closed across the United States since 2000. In that same stretch of years, however, hundreds more hospitals have opened. Taken together, that sounds almost reassuring — a sector in churn, but not in freefall. Yale’s Health Care Affordability Lab, which just published the most comprehensive accounting of this churn to date, even framed it that way: for every ten hospitals that closed, eight opened.
But churn isn’t neutral. It matters enormously where the closing happens and where the opening happens, because, as it turns out, they are not the same places.
I pulled the underlying hospital-level data behind Yale’s new numbers and matched every closure and opening since 2000 to its county, then layered in U.S. Census data on income, poverty, and population density. The pattern that emerged is clear: The hospitals closing serve poorer communities than the hospitals opening. Almost all of the new hospitals were built in zip codes with wealthier residents.
The median household income in counties where hospitals closed was $45,992. In counties where hospitals opened, it was $52,873 — nearly $7,000 higher.
Breathe data into income quintiles and the divide sharpens further. Hospitals closing in the poorest fifth of U.S. counties outnumber hospitals closing in that same tier by three-to-one compared with openings. Meanwhile nearly three-quarters of all new hospitals — 73% — have opened in the richest 40% of counties. The country isn’t just losing hospitals and gaining hospitals. It’s losing them in one America and gaining them in another.
The easy explanation is that this is just population following growth — hospitals close in the declining Rust Belt and open in the booming Sunbelt, and income differences are just a side effect of which regions are growing. I checked for that, because it would matter: if that’s all this is, it’s a story about demographic drift, not about who a health system chooses to serve.
It isn’t just that. I broke the same comparison out by state, and in 23 of the 24 states with enough closures to compare, the hospitals that closed were in lower-income counties than the hospitals that opened — within that same state. Illinois lost hospitals in counties averaging $52,693 in household income while gaining them in counties averaging $65,217. Minnesota: $51,525 versus $72,971. North Carolina: $38,090 versus $49,874. Even in Texas — which added a net 40 hospitals, the best record of any state — the closed hospitals were in counties averaging nearly $10,000 less than the counties where new ones opened. The only state in the sample where this didn’t hold was Arizona, and there it was essentially a wash.
That consistency shows this isn’t primarily a story about regional growth patterns. It’s a story about who health systems — hospital operators, investors, health systems chasing better payer mix — decide is worth building for, and it’s happening inside the same state borders, sometimes inside the same metro areas, at the same time.
What “closure” actually means depends on the zip code
It’s important to be somewhat specific about which facilities are closing, because “hospital closure” isn’t one phenomenon. Some of what shows up in this data is the slow bleed familiar to anyone who’s covered rural health care: all too often, the last hospital in a county goes away and with it obstetrics, the ER, and in many cases the last stable employer in town. But some of the closures in dense urban counties are something else — consolidation, where systems fold a facility into a nearby campus.
What both kinds of closures share, though, is the income pattern. Whether it’s the last rural hospital in a county or an urban system trimming a facility in a lower-income neighborhood, the destination for new capital is disproportionately a wealthier community or across the state.
If you live in the county that lost its hospital, the fact that a gleaming new facility opened forty minutes away in a wealthier suburb does not shorten your ambulance ride, doesn’t help you deliver a baby, and doesn’t change the calculation an uninsured or underinsured patient makes about whether a symptom is worth the trip.
Health systems, quite rationally from a balance-sheet perspective, build where the payer mix is better — commercial insurance, higher reimbursement, wealthier patients who can absorb high-deductible cost-sharing. They close or shrink where the payer mix is worse — more Medicaid, more Medicare Advantage, more uninsured, more bad debt. Every individual decision can make business sense. The aggregate effect, repeated in state after state for a quarter century, is a health care system quietly re-sorting itself by income, county by county.
Why CFOs must prepare for more than just coverage loss.
KEY TAKEAWAYS
Higher deductibles and cost sharing are driving collection challenges even among patients with coverage.
ACA and Medicaid policy changes can quickly alter payer mix, making financial flexibility a competitive advantage.
Strengthening payer partnerships, optimizing revenue cycle performance, and investing in sustainable growth are becoming unarguably critical.
The expiration of enhanced ACA premium subsidies is not just a policy issue, but a steep revenue cycle and margin challenge. The loss of the subsidies represents far more than a temporary decline in insurance coverage, it’s a structural shift in payer mix, revenue predictability, and financial strategy that is reshaping how health systems plan for an uncertain future.
Recent earnings reports from major for-profit systems underscore the reality of the challenge. HCA Healthcare, Community Health Systems, and Tenet Healthcare have all reported that the impact of ACA marketplace disruptions has been more severe than expected. Rather than transitioning to employer-sponsored coverage or delaying care, many patients who lost subsidized exchange plans are continuing to seek treatment without the ability to cover their growing financial responsibility—meaning rising uncompensated care, higher bad debt expense, and increased pressure on operating margins.
CFO outlook is overall optimistic, and although healthcare demand has remained remarkably resilient, patients’ ability to pay has not. That reality is playing out in real time at hospitals across the country.
Bill Pack, CFO of Methodist Le Bonheur in Tennessee, describes the expiration of ACA subsidies as one of the system’s most significant financial headwinds. According to Pack, enrollment in Gold, Silver, and Platinum marketplace plans has fallen by approximately 70%, while enrollment in Bronze and catastrophic plans has increased by nearly 30%. For Pack’s organization, the disruption is driving a sharp increase in self-pay patients.
“To a certain extent, the mindset of a lot of people in government is ‘COVID’s over, so we don’t need these things anymore,'” Pack says. “But I don’t think there’s a good appreciation for the impact that has had.”
Technically patients are still insured, but many now carry substantially higher deductibles, copayments, and coinsurance obligations than they cannot realistically afford.
“This just adds to the self-pay as well because a lot of people are not going to be able to pay that patient portion,” Pack says.
Pack and his organization’s experience reflects a broader national trend. According to an HFMA analysis, the expiration of enhanced ACA premium tax credits is expected to leave approximately five million Americans without marketplace coverage, increasing uncompensated care while reducing hospital revenue. As a result, traditional payer mix metrics will likely no longer tell the full financial story, making revenue cycle performance and patient collections even more vital to margin preservation.
Further, this is also a subtle but meaningful evolution of the revenue cycle challenge: collections become more difficult, bad debt increases, and cash flow becomes less predictable despite stable patient volumes. At the same time, policy uncertainty is making long-term planning increasingly difficult.
Beyond labor shortages, inflation, reimbursement pressure, and supply chain costs, CFOs are now preparing for additional changes to Medicaid eligibility and future federal policy. Pack says the experience of the past several years has fundamentally changed how organizations approach financial planning.
“One thing we learned from COVID is no matter how hard we try, we cannot predict the future,” he says. “We’ve got to be very flexible. We’ve got to be nimble.“
That philosophy is growing amongst CFOs, ultimately because it has to.
Rather than relying on typical assumptions about reimbursement and payer mix, systems are building flexibility into their financial planning. For this Pack’s system, this means strengthening managed care contracting, deepening relationships with commercial payers, pursuing strategic service-line growth, maintaining disciplined cost management, and making thoughtful capital investments while preparing for potential Medicaid policy changes.
As the challenges persist, optimization is becoming the star of the CFO’s playbook. Today health systems depend on how they can optimize payer strategy, improve revenue cycle performance, make disciplined capital allocation decisions, and invest in services for long-term demand.
Hospital CEO turnover remained above last year’s pace through the first half of 2026 even as departures across industries decreased, continuing a trend that emerged earlier this year.
KEY TAKEAWAYS
While CEO departures across U.S. companies fell 26% during the first half of 2026, hospitals recorded an 8% increase, making healthcare one of the few sectors still experiencing elevated leadership turnover.
Increased hospital CEO exits during the first quarter carried into the first half of 2026, suggesting the rise in turnover has become more sustained.
As leadership changes continue at a higher rate than in most industries, hospital boards face greater pressure to strengthen executive pipelines and preserve continuity.
The wave of CEO departures that hit corporate America over the past two years has largely stabilized. Hospitals, however, continue to move in the other direction.
A report from Challenger, Gray & Christmas found U.S. companies announced 920 CEO exits during the first half of 2026, down 26% from 1,235 departures during the same period last year, while hospitals recorded 74 CEO exits through June, compared to 68 during the first half of 2025, for an increase of more than 8%.
The contrast suggests the spike in hospital leadership turnover that emerged during the first quarter has extended into a larger trend.
For June, hospitals announced 10 CEO departures, down from 17 during the same month last year. Earlier months produced increased activity, with 16 exits in March, 16 in April, and 14 in May.
Most other sectors, conversely, have experienced significant year-over-year declines in CEO turnover. Government/not-profit, which has announced the most exits over the past two years, saw departures drop from 256 through the first half of 2025 to 247 through June 2026.
The industries that also dealt with an uptick in year-to-date turnover were aerospace/defense (13 in 2026, eight in 2025), insurance (20, 17), media (15, 12), and pharmaceutical (22, 17), with none of those sectors coming close to the volume seen with hospitals.
The data reveals how much of an outlier hospital CEO turnover has been and the effect that financial pressures, workforce challenges, and policy changes have had on executive leadership.
For hospital boards, persistent and elevated turnover increases the importance of succession planning as a priority rather than a contingency.
Now and going forward, boards may place greater emphasis on developing internal leadership pipelines and maintaining continuity during executive changes.
“Boards continue to hold onto the leaders they have rather than reaching for change, and the first-half pace now sits a full quarter below last year,” Andy Challenger, labor expert and chief revenue officer for Challenger, Gray & Christmas, said in a statement. “After two years of elevated turnover, companies are prioritizing stability.”
Absence of mandatory federal reporting on 340B revenues and expenditures is viewed as the program’s core governance gap, despite existing audit authority focused on duplicate discounts and diversion.
Eligibility criteria tied to disproportionate Medicaid/uninsured volume remain contested, with examples showing large academic systems generating far more 340B margin than charity-care outlays compared with public safety-net hospitals.
Use of savings ranges from keeping small hospitals solvent to subsidizing high-cost service lines, yet lack of spending requirements can incentivize expansion in affluent markets and shift costs to payers.
Manufacturers are criticized for contract-pharmacy restrictions and demands for claims data, while also allegedly pricing 340B discounts into list prices; limited HRSA rulemaking authority perpetuates litigation.
Does the 340B program help hospitals provide care and other services to low-income patients? Or has the program grown beyond what was initially intended, with undeserving institutions taking advantage of it?
Two industry leaders addressed these questions and more during a webinar sponsored by Managed Healthcare Executive, Drug Topics and the Pharmacy Benefit Management Institute.
Tom Kraus, J.D., chief advocacy officer and vice president of government relations at the American Society of Health-System Pharmacists, argued in favor of the program’s value to patients. “Hospitals are still operating on incredibly thin margins across the board. The average is around 1%; almost half are operating at negative margins. It’s just not true that they’re somehow getting rich off this. They’re using it to provide patient care in communities that need it and to patients that need it.”
But Shawn Gremminger, president and CEO of the National Alliance of Healthcare Purchaser Coalitions, said the program has “grown out of control, and it doesn’t have the guardrails it needs. What 340B has tried to accomplish is absolutely valid; I fully support it. But it’s plainly obvious to anybody that the time is now for Congress and policymakers to get together and say we can make this program actually work.”
The 340B program allows qualifying hospitals and other providers, such as federally qualified health centers, to purchase medications at discounted rates from drug manufacturers and use the difference between the discounted price and the reimbursement from commercial insurers and other payers to fund patient care services.
The 340B program generated roughly $100 billion in discounted drug purchases last year, growing 23%, compared with less than 10% growth in overall U.S. prescription drug spending.
Since its implementation in 1992, more than half of U.S. hospitals participate in the program.
The Health Resources & Services Administration (HRSA), which oversees the 340B program, is currently reviewing comments and determining next steps for a pilot 340B rebate program for drugs that were part of the Inflation Reduction Act’s Medicare Drug Price Negotiation Program.
Here are four key takeaways from the webinar:
1: Transparency and oversight
There is no federal requirement that hospitals report how much 340B revenue they collect or how they spend it. Gremminger argued that this absence of reporting is the program’s central flaw. “The underlying problem with 340B is it creates economic distortions,” he said. “The program is so problematic because it has virtually no oversight. The Health Resources and Services Administration, which oversees nominally 340B, has been found by courts to have basically no ability to actually create rules.”
Gremminger said payers want to know how much hospitals make and what they do with the money. He pointed to states, such as Minnesota, that are beginning to require covered entities to report this information.
Kraus countered that HRSA and manufacturers already have audit authority when there is a specific concern, such as a suspected duplicate discount, and that 340B dollars are not separately traceable once they reach a hospital’s books.
2: What counts as a safety net hospital?
Much of the debate centered on which hospitals should qualify for participation in the program. Gremminger cited Minnesota data showing that M Health Fairview, the University of Minnesota’s academic medical center, netted more than $300 million in 340B revenue last year while providing about $17 million in charity care, compared with Hennepin Healthcare, a public safety-net hospital that made roughly $100 million in 340B revenue against $107 million in charity care. He argued dollars are flowing disproportionately to large, financially healthy systems rather than the rural and community providers the program was designed to protect.
Kraus said that hospitals in the program already treat a disproportionate share of Medicaid and uninsured patients to qualify. “The states have said payers should pay the normal rate, and they want the clinic or hospital to be able to use those dollars to subsidize care in their communities. I think that’s like a reasonable decision that states can make, and I think from my perspective, it helps us provide care to patients.”
3: What services should 340B dollars fund?
Kraus maintained that the law implies, though does not strictly require, that 340B savings support safety net care and noted three-quarters of small participating hospitals use the savings simply to stay open. Additionally, he said large academic centers often house the trauma centers, cancer centers, and emergency departments that require substantial, ongoing subsidy.
“At the end of the day, the program exists in order to subsidize the care of patients by allowing providers to purchase at a lower cost and sell to payers at a higher cost, which is the contracted rate. The program’s not designed to subsidize payers; it’s designed to subsidize providers so that they can survive.”
Gremminger said the lack of any spending requirement means some systems reinvest the 340B margin into facilities in higher-income, better-insured markets rather than expanding services for low-income patients, calling that an economic distortion that raises costs for employers, taxpayers, and working families through reduced Medicaid rebates and higher commercial pricing.
4: Pharma’s role in drug pricing
Both panelists were critical of drug manufacturers, although for different reasons. Kraus said pharmaceutical companies, which he noted operate on roughly 40% margins compared with hospitals’ roughly 1%, have pursued restrictions on contract pharmacy arrangements that have ended up in litigation. Manufacturers such as Eli Lilly are now requiring covered entities to turn over claims data as a condition of receiving discounts, which he characterized as a “fishing expedition” rather than a targeted integrity effort.
Gremminger agreed pharma bears responsibility for high drug prices because companies simply prices 340B’s cost into list prices, which he argued undermines any savings the program is meant to generate. Both agreed HRSA lacks the statutory authority for meaningful rulemaking, a gap they said invites continued litigation between manufacturers and hospitals.
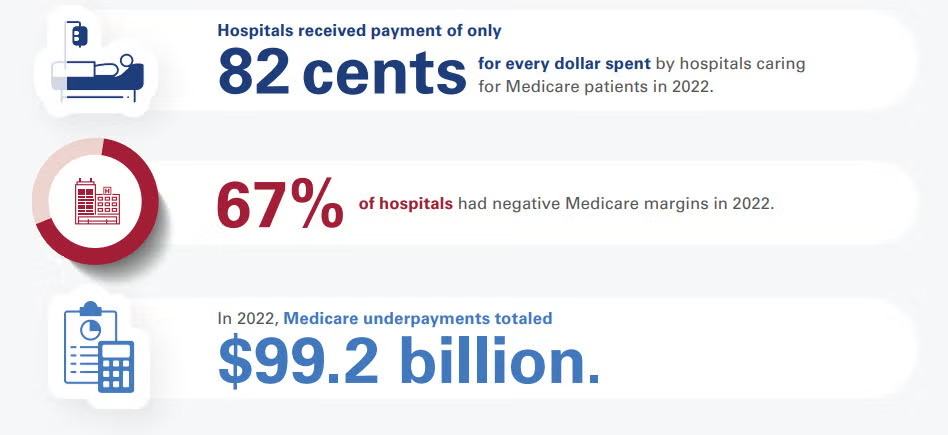
Medicare reimburses hospitals at an average of 82% to 87% of the actual cost of providing patient care. According to long-term data from the American Hospital Association (AHA) and the Congressional Budget Office (CBO), this means hospitals face a shortfall, receiving roughly 82 to 87 cents for every dollar they spend caring for Medicare beneficiaries.
Financial Impact and Hospital Margins
Because Medicare reimbursement rates are fixed by the federal government, they often fail to keep pace with the rising costs of labor, drugs, and supplies:
Negative Profit Margins: The Medicare Payment Advisory Commission (MedPAC) reported that hospitals experienced an average -12% margin on fee-for-service Medicare services, with projections remaining deeply negative at -10%. [1]
Widespread Losses: Approximately 67% of all U.S. hospitals operate at a net financial loss specifically on their Medicare patient population. [1]
Aggregate Underpayments: This payment-to-cost deficit translates to roughly $99.2 billion in annual underpayments that hospitals must absorb or offset through other revenue streams.
How Hospitals Balance the Deficit
To remain financially viable while absorbing underpayments from Medicare and Medicaid, hospitals rely on cost-shifting to the private sector:
Commercial Insurance Rates: Private, employer-sponsored health plans pay hospitals significantly more to subsidize public program shortfalls. On average, commercial insurers reimburse hospitals at 196% to 199% of Medicare rates.
Payer Mix Vulnerability: Hospitals located in regions with high concentrations of elderly or low-income residents are at higher financial risk. At 96% of U.S. hospitals, government programs (Medicare and Medicaid) account for more than half of all inpatient days.
If you are tracking hospital financials or healthcare policy, would you like to see how Medicaid reimbursement rates compare, or look closer at the differences between inpatient and outpatient Medicare payment structures?
Medicaid reimburses hospitals at an average of 88% to 90% of the actual cost of care, but this figure heavily relies on supplemental government funding. Without these extra state and federal payments, standard Medicaid base rates only cover roughly 58% to 65% of hospital costs.
Because Medicaid is jointly funded by federal and state governments, the exact payment-to-cost ratio varies wildly by state, fluctuating between 49% and 169% of Medicare benchmarks.
The Core Components of Medicaid Payments
Medicaid hospital payment structures are highly complex and divided into two primary tiers:
Base Rates (Severe Shortfalls): Standard Fee-For-Service (FFS) base rates and Managed Care Organization (MCO) plans pay well below actual expenditures. According to industry data published by the American Hospital Association (AHA), standard MCO plans cover just 65 cents on the dollar, while FFS base payments plummet to 58 cents on the dollar.
Supplemental Payments (The Lifeline): To minimize this gap, states issue extra payments to hospitals. These account for over 52% of total Medicaid hospital spending nationwide and are broken down into:
Disproportionate Share Hospital (DSH) Payments: Extra funds legally required for safety-net hospitals serving high volumes of low-income or uninsured patients.
Non-DSH Supplemental Payments: Upper Payment Limit (UPL) adjustments and state-directed payments meant to artificially boost base rates closer to commercial or Medicare levels.
Operational Impacts on Hospitals
The gap between Medicaid base reimbursement and actual cost strains hospital systems in several distinct ways:
Widespread Financial Loss: Even after accounting for all safety-net supplemental payments, roughly 62% of U.S. hospitals operate at a net loss on their Medicaid patient populations.
Aggregate Underfunding: The total nationwide Medicaid underpayment deficit adds up to approximately $24.8 billion annually that hospitals must absorb.
The Commercial Subsidy: Because public programs underpay, hospitals shift costs onto employer-sponsored health plans. As a result, private insurers are charged nearly double (up to 200%) what Medicare and Medicaid pay for the exact same medical services.
Minnesota lawmakers approved a $205 million funding package to stabilize Hennepin Healthcare, but it underscores that the safety-net risk is escalating. Here’s what Hennepin told us.
KEY TAKEAWAYS
Hennepin’s financial struggles highlight how hospitals with heavy Medicaid and uninsured populations remain vulnerable when reimbursement growth lags expense inflation.
CFOs should model scenarios involving Medicaid funding reductions, rising uncompensated care, and sustained labor-cost pressures to assess liquidity and capital needs.
While government funding can provide short-term relief, finance leaders should focus on long-term sustainability through revenue diversification, service-line optimization, and proactive advocacy efforts.
Hennepin Healthcare’s financial crisis has become one of the most closely watched healthcare stories in the country. Now bolstered with state funding, its story illustrates the mounting pressure on safety-net hospitals.
The CFO Take Away
Think of this headline as an underscore to the growing vulnerability of health systems whose payer mix is concentrated in government programs. Hennepin Healthcare’s situation demonstrates that even large, clinically essential institutions can find themselves in liquidity crises when reimbursement growth consistently trails expense inflation.
CFOs should view this as a warning to stress-test their organizations against scenarios involving Medicaid funding reductions, higher uncompensated-care volumes, and continued labor-cost pressure. The strategy lesson here is that traditional margin-improvement initiatives alone may not be enough. CFOs should be strengthening advocacy efforts, diversifying revenue streams where possible, reassessing service-line profitability, and building long-range capital plans that assume greater reimbursement volatility.
The market is tightening, and the broader takeaway is that safety-net economics are becoming a board-level risk issue. Organizations that wait until cash reserves deteriorate before pursuing structural solutions will find themselves relying on emergency legislative interventions rather than executing deliberate financial strategy.
The System
Hennepin Healthcare leaders have warned lawmakers that the organization faces severe financial challenges driven by a combination of factors: rising labor and operating costs, inadequate reimbursement from government programs, and a heavily Medicaid-dependent population.
The system has already tried to shrink costs by reducing beds and eliminating services, while seeking additional state support to stabilize operations. But policymakers ultimately negotiated a funding package worth approximately $205 million to help preserve the organization’s role as Minnesota’s largest trauma center and a critical provider for vulnerable and low-income populations.
In an email to me, the system stated:
“Hennepin Healthcare is deeply grateful to the lawmakers who acted with urgency and collaboration, and to our employees, patients, and advocates whose voices brought needed attention to this crisis. The stabilization funding does not resolve the long-term impacts of HR1 or the structural deficits that uniquely challenge safety-net hospital systems. But it does accomplish two essential things: it delivers historic support that sustains us, and it gives us the time and stability to work with the state on durable, long-term solutions.
Our immediate priorities are to stabilize our team and invest in patient care while carefully stewarding the funds allocated to us. We have essential needs that have been deferred because of financial challenges, including staffing, equipment, and other investments that support patient care.
Looking ahead, our strategy is focused on both operational improvement and long-term sustainability. We will continue working with state leaders, the Governor-appointed task force, and our future professional governing board to identify lasting solutions that strengthen Minnesota’s healthcare safety net and ensure Hennepin Healthcare can continue serving patients for generations to come.”
It’s clear the system views the package only as a bridge. It’s obviously not a solution. But beyond that, it’s also clear that this is not a Minnesota-confined story.
Hennepin Healthcare showcases the financial fragility of safety-net hospitals nationwide. In 2023, well before any of today’s Medicaid chaos, safety-net hospitals provided roughly $11 billion in uncompensated care.
Roughly three-quarters of Hennepin Healthcare’s patients are uninsured or covered by public insurance programs, creating a structural gap between the cost of care and reimbursement levels.
Hennepin Healthcare was projecting up to $50 million in operating losses for 2026 and a staggering $1.7 billion in deficits over the next decade. The organization’s repeated losses and dependence on government intervention underscore the challenges many urban safety-net systems face as Medicaid funding uncertainty, amongst other pressures, converge.
New National Health Expenditure projections show sustained cost growth outpacing GDP, driven by Medicare expansion, rising drug spend, and persistent utilization pressures.
KEY TAKEAWAYS
Medicare is projected to grow faster than other payers, increasing exposure to lower reimbursement rates and tightening system-wide margins.
Utilization is driving costs. Post-pandemic service use remains elevated, undermining the assumptions that demand would normalize.
Rapid pharmaceutical growth and shifting federal pricing policy make pharmacy costs unpredictable and scenario-dependent.
The latest National Health Expenditure projections from Health Affairs and CMS confirm what CFOs already suspect: cost growth is structural. Total U.S. health spending is expected to grow at roughly 5.4% annually through 2034, consistently outpacing GDP growth of about 4.1%, pushing healthcare’s share of the economy from roughly 18% today to more than 20% by 2034.
The first major implication is funding-source imbalance. Medicare is projected to grow the fastest at roughly 7.7% annually, driven by demographics and utilization intensity. Medicaid and commercial insurance trail at about 5% each, but still above general inflation. This divergence matters. Payer mix will steadily tilt toward government payers with structurally lower reimbursement growth. Even small shifts in payer composition will exacerbate pressure on operating margins unless productivity gains or rate improvements offset them.
Secondly, utilization is what’s really driving the next wave of cost growth. Recent data show elevated service use across hospital, physician, and pharmaceutical categories, with little evidence that post-pandemic demand has normalized. That suggests budgeting cycles can no longer assume regression to pre-2020 utilization trends. For CFOs, this complicates volume forecasting: demand is becoming less predictable and more sensitive to coverage expansion and policy-driven enrollment changes.
Third, prescription drug spending is now the fastest-growing category, with retail pharmaceuticals set to outpace hospital and physician services through the projection window. The combination of specialty drug uptake and policy-driven price reforms creates a dual volatility problem: higher baseline spend alongside uncertain future savings from federal negotiations and benefit redesigns. CFOs in both provider and payer organizations should treat pharmacy cost projections as scenario-driven, not point estimates.
Fourth, federal policy is increasingly the dominant driver of revenue exposure. The federal government’s share of total health spending is expected to rise from roughly 31% to 33% by 2034, reinforcing dependence on Medicare and federal Medicaid financing. At the same time, policy volatility—particularly around subsidies, eligibility rules, and drug pricing—introduces new forecasting risk that cannot be diversified away. CFOs should expect more frequent mid-cycle reimbursement adjustments and greater lag between policy adoption and financial realization.
Fifth, the insured population is expected to slightly decline as a share of total population over the next decade. This is a subtle but important signal for providers, because even small coverage shifts can disproportionately affect elective volume, bad debt exposure, and charity care assumptions. CFOs should incorporate coverage elasticity into long-range planning models, especially in markets with high exchange enrollment sensitivity.
Finally, healthcare is steadily absorbing a larger share of the U.S. GDP. Look out for structural revenue tailwinds for the sector and intensifying political and payer pressure to contain costs. CFOs should expect sustained scrutiny on operating efficiency, administrative overhead, and price justification across all service lines.
Ultimately, the shift here is from static 10-year budgeting to dynamic scenario planning. Health systems that quickly model policy sensitivity, payer mix drift, and utilization volatility in real time will be better positioned than those relying on historical cost curves that just no longer hold up.
At least 568 healthcare facilities operate through nonprofit-private equity joint ventures, according to a new report calling for scrutiny into those arrangements.
The figure is likely an undercount, considering only public data were used. The report (PDF) was published by the Private Equity Stakeholder Project (PESP), a nonprofit that advocates for more disclosure about private equity deals.
More than a fifth of private equity (PE)-owned hospitals operate under joint venture arrangements with nonprofit health systems.Apollo Global Management-owned Lifepoint Health, for instance, runs nearly two-thirds of its hospitals through joint ventures.
Such joint ventures extend beyond hospitals, spanning subsectors such as inpatient rehab, hospice, home health, behavioral health, ambulatory surgery centers and urgent care, per the report. And regulations have not kept up with these evolving complex ownership structures.
“While joint ventures may be advantageous configurations for the businesses involved, PE-backed joint ventures may still represent the risks associated with PE buyouts in healthcare,” the report said.
The report identified several patterns related to such arrangements. First, joint ventures with a provider offer an opportunity for a PE-backed company to expand into new markets. Joint ventures may also help companies get around regulatory restrictions, like in some states that forbid non-doctors from owning medical practices. It may help avoid the challenges associated with converting a health system from a nonprofit to a for-profit. Joint ventures also grant access to private capital and may drive revenue from the sale of real estate, a practice critics have said fueled high-profile health system bankruptcies in recent years.
One negative pattern, the report cautioned, is patient and caregiver risks due to poor facility conditions, declining care quality, reduced services and higher prices. PESP gave as an example Lifepoint’s involvement in Duke, where associated facilities have seen poor quality of care and have cut services. Lifepoint was the subject of a recent bipartisan Senate investigation, supported by other PESP research, which found underinvestment has affected patient care.
Another example worthy of caution, per the report, is Ascension, which, in addition to having a joint venture with Lifepoint, also works with PE firm TowerBrook Capital to acquire healthcare companies. This case study shows how executives and PE businesses make outsized profits from entering healthcare markets, despite clinician concerns about future negative impacts to patient care.
While much of the public and an increasing share of policymakers have been wary of PE’s involvement in healthcare due to these cases and others,proponents contend that funds can help fill in gaps where public funding for healthcare falls short, such as by supporting services in underserved areas or providing resources and managerial expertise that would otherwise be out of reach.
PESP’s report said the examples it documented “expose significant gaps in federal and state oversight of private equity in healthcare.”
To address this, PESP recommends that the IRS update its joint venture guidance; that the HHS Office of the Inspector General update its guidance on anti-kickback statutes; and that CMS clarify whether exceptions to Stark Law—which protects medical decisions from financial conflicts of interest—apply in PE-backed joint ventures. PESP also called on the Federal Trade Commission and the Department of Justice to better scrutinize joint ventures that don’t trigger individual premerger review, but still amass market influence.
Additionally, the report was accompanied by a public searchable database of 568 nonprofit-PE joint ventures as identified by PESP. The database is embedded on PESP’s site.
“Patients, payers and employees need protection from the risks associated with PE ownership of healthcare systems and joint ventures expose significant gaps in oversight and regulation,” the report concluded.
In today’s issue:Hospitals are facing simultaneous payment cuts, new oversight and transparency proposals as policymakers look to rein in health care spendingDemocrats are making the GOP’s tax-and-spending law a centerpiece of their midterm messaging as Republicans pivot to selling its tax cutsA federal judge temporarily blocked Colorado’s first-in-the-nation prescription drug payment cap, handing Amgen an early win… and more.Happy Monday, and welcome back to Health Brief. Hope everyone had a relaxing holiday! Congress isn’t here this week, but the health policy world is showing no signs of slowing down. So let’s get into it. What do you have on your radar?
Speaking of the $900 billion in impending cuts to Medicaid: The One Big Beautiful Bill Act was supposed to be a crowning legislative achievement for Republicans to tout while campaigning in the midterm elections. Among other things: It prevented massive tax increases for most Americans and established a program that allows parents to open investment accounts for children born during President Donald Trump’s second term and receive $1,000 from the government. But the legislation has emerged as a central talking point for the Democratic Party, with congressional Democrats mentioning the law twice as often as Republicans, report Matthew Choi and Clara Ence Morse in The Washington Post newsroom. Democratic candidates are deriding it as the “Big Ugly Bill” and linking the changes it brought to Medicaid and food assistance programs to voters’ anxieties about the cost of living. Republicans, meanwhile, have largely retreated from talking about the law by name, instead opting to emphasize the tax savings and other proposals. Democrats assert that the shift is a sign of the Republican Party’s acknowledgment of the law’s low overall approval. “I don’t care what you call it. It’s what delivers for America,” House Republican Conference Chair Lisa McClain (Michigan) told my colleagues.
Read the full story: “Democrats invoke ‘big, beautiful bill’ far more than Republicans as midterms near. ”INDUSTRY RXA federal judge temporarily blocked Colorado from enforcing a state-set payment cap on a pricey medication for autoimmune disorders called Enbrel, siding with Amgen, the company that makes it, while the lawsuit moves forward. The case centers on whether Colorado’s Prescription Drug Affordability Review Board has the authority to limit what can be reimbursed for a patented drug. The board had determined that Enbrel was unaffordable and set a maximum payment level at roughly 70 percent below Amgen’s wholesale price. The judge found that Amgen is likely to win because an earlier federal appeals court ruling says states cannot impose price caps on patented drugs if doing so conflicts with federal patent law. The court said Congress — not individual states — gets to decide how to balance affordable drug prices with the financial incentives that patents provide for developing new medicines. The judge also agreed that Amgen could suffer “significant harm” if the cap took effect, including weaker negotiating power with wholesalers and contracts that would be difficult to undo later. It rejected the state’s claims that any harm was balanced by carveouts in the law, such as the payment limit applying to employer-based plans. “This is an argument about the scope of damages, not their existence,” the judge wrote.
Why it matters: States across the country have been setting up their own Prescription Drug Affordability Boards (PDABs) in an effort to try and rein in drug costs. Some act as advisory panels that develop policy, while others — including Colorado — are able to set upper payment limits. Enbrel’s price cap became the first in the nation, proving to be a test for other PDABs nationwide.The boards’ overall effectiveness and ability to lower medication prices in the states in which they’ve been established has come into question and became one of the reasons Democratic Gov. Abigail Spanberger (Virginia) vetoed bipartisan legislation to set up a PDAB in the state.“Drug manufacturers took a huge sigh of relief from this decision,” Andrew Twinamatsiko, a director of the Center for Health Policy and the Law at Georgetown Law, tells me.For now, Colorado cannot enforce the payment limit for Enbrel while the lawsuit continues. The ruling does not decide the entire case, but it pauses the state’s price cap until the court reaches a final decision.
What’s next: The court leans on a federal ruling that struck down a pharmaceutical price gouging law in Washington D.C., but Twinamatsiko said that structure of the law — which utilized international reference pricing — is different from how Colorado’s PDAB operates and “there are creative ways” the state could differentiate the two legally.
The tax and spending law known as H.R. 1 includes provisions to revise what is counted as a Medicaid payment error and to recoup more federal funds. The new rules, which go into effect in 2029, target payments with inadequate documentation.
Goals: To review the scope of improper Medicaid payments and the potential impact of H.R. 1 policies on states, providers, and patients.
Methods: Analysis of research, government data, proposals, final rules, and laws.
Key Findings and Conclusion:
Although the provisions aim to reduce erroneous Medicaid payments, error rates could rise due to new Medicaid work requirements and other H.R. 1 provisions that make eligibility determination processes more complex for states. More than 20 states already have improper payment rates that exceed the threshold, meaning they could face significant financial penalties when the provisions go into effect. Policymakers could help reduce payment errors and the financial risk to states by encouraging the Centers for Medicare and Medicaid Services (CMS) and the U.S. Department of Health and Human Services to share best practices with states, use state audit data to improve oversight, and streamline Medicaid regulatory requirements. Additionally, CMS and states already have processes in place — including corrective action plans — to address erroneous payments.
Introduction
The tax and spending law, H.R. 1 (originally titled the “One Big Beautiful Bill”), enacted in July 2025, includes more than $900 billion in cuts to Medicaid, the public health insurance program financed jointly by the federal government and states. Some analysts have projected that, along with the law’s other changes to Medicaid, these cuts — the largest in the program’s 60-year history — will cause more than 7 million Americans to lose their Medicaid health coverage.1 The cuts will also shift costs to states, weaken the fiscal stability of health care providers, and diminish patients’ access to care.2
Supporters of H.R. 1 have asserted that it contains measures to address fraud, waste, and abuse. One of these provisions requires the U.S. Department of Health and Human Services (HHS) to recoup federal dollars for erroneous Medicaid payments — such as payments made for medical services when billing paperwork was missing or Medicaid eligibility paperwork was incomplete — once those payments exceed a certain level. The most recent data from the Centers for Medicare and Medicaid Services (CMS) released in January 2026 indicate that the nationwide error rate is 6.12 percent, slightly more than twice the 3 percent rate allowed under H.R. 1.3 According to that report, 77.17 percent of erroneous payments are due to incomplete documentation (namely missing paperwork), which is not generally indicative of fraud or abuse.4
The Congressional Budget Office (CBO) estimates that the policy change will reduce federal Medicaid spending by $7.55 billion and cause 100,000 individuals to lose their coverage as states tighten their processes to avoid penalties.5 To reduce error rates to comply with the new requirement and avoid financial penalties, states could further restrict eligibility determination processes to add greater certainty to ensuring all documentation has been submitted or require prior authorization before a provider can provide care.
Cumulatively, the implementation of H.R. 1’s broader Medicaid changes — such as implementation of work requirements, more frequent coverage renewals for certain enrollees, and changes to provider taxes — could make reducing improper payments more difficult.6 These changes will increase the administrative burden for states and patients while decreasing the funding available for Medicaid programs. With more administrative requirements and fewer dollars with which to implement programs, the chance of error increases.
This brief defines erroneous Medicaid payments and explores whether improper payment rates are an accurate measure of fraud. We describe how H.R. 1 expands the definition of an erroneous payment while limiting the federal government’s ability to waive penalties on states with improper payment rates that exceed a certain threshold even if they are making good faith efforts to address the errors. We also present data showing the disproportionate impact on some states and offer alternative strategies for policymakers to better support states in reducing improper Medicaid payments.
Defining Improper and Erroneous Medicaid Payments
Improper Medicaid payments, as defined in statute, can be overpayments, underpayments, and payments where there is not enough information to determine whether the payment was correct — such as when medical billing codes are inaccurate, provider paperwork is missing, or applicants submit incomplete documentation. Improper payments also include payments made for individuals who were enrolled in Medicaid despite being ineligible, as well as payments for services that do not comply with Medicaid program requirements such as duplicative payments.
The federal government determines what’s “improper” by reviewing Medicaid fee-for-service claims, managed care payments, and eligibility decisions. “Improper payments” is a broad category, while “erroneous payments” — payments that are incorrect under program rules — represent a more specific subset within it.7 Sometimes the terms are used interchangeably.
How CMS Defines Improper Payments
Improper payments can result from a variety of circumstances, including:
Items or services with no documentation.
Items or services with insufficient documentation.
Items or services with documentation that does not substantiate the payment.
Items or services where the payment was to the right recipient for the right amount, but the payment process did not comply with applicable statutory or regulatory payment requirements.
With respect to Medicaid and CHIP, there is no record of the required verification of an individual’s eligibility factors, such as income.
According to CMS, the improper payment rate is not a “fraud rate” but rather a measurement of payments made that did not meet statutory, regulatory, or administrative requirements.8
More than 75 percent of improper payments — just over 77 percent in 2025, as mentioned above — are due to insufficient documentation, and most involve a state, contractor, or provider missing an administrative step.9 With additional documentation, these payments may be correct.
Calculating Improper Medicaid Payments
Each year, CMS conducts a payment error rate measurement (PERM) audit in 17 states — one-third of all states — so every state is reviewed once every three years. Each state’s improper payment rate is calculated by dividing the total value of overpayments and underpayments in a representative sample from three categories (Medicaid eligibility, fee-for-service, and managed care) by the state’s total Medicaid expenditures.10 CMS also publishes a national Medicaid improper payment rate, which was 6.12 percent in the most recent data.11 In 2025, these improper payments totaled $37.9 billion, including $10.8 billion (28.6%) from fee-for-service Medicaid, $27.0 billion (71.4%) from eligibility, and $0 from managed care Medicaid.12
Since 1983, federal law has set an allowable improper payment rate of 3 percent. When a state exceeds this threshold, the HHS secretary is required to recover the federal share of the excess erroneous payments as a penalty. However, the secretary has long had discretion to waive these repayments if a state was making a good faith effort not to exceed the allowable error rate, and the secretary has generally waived penalties.13
Medicaid Improper Payment Rate for Fiscal Year 2025
Medicaid appropriate federal payment rate: 93.88%; $573.6 billion
Percentage of improper payments resulting from insufficient documentation: 77.17%
Notes: Each year approximately 17 states are reviewed. The national improper payment rate is a combination of the more recent three cycles in 2023, 2024, and 2025. In contrast to the 3 percent allowable error rate for Medicaid, Medicare is allowed a 10 percent error rate.
What Is the Current Process for States to Address Error Rates?
States are required to develop a Medicaid corrective action plan (CAP) and submit it to CMS within 90 days of receiving their PERM error rate to address the errors identified in the PERM review.14 The CAP serves as the formal vehicle through which the state explains why errors occurred and identifies root causes across fee-for-service, managed care, and eligibility categories. In the CAP, which is intended to serve as a performance management tool, a state also commits to specific corrective actions designed to reduce future improper payments.
Once CMS approves the state’s PERM CAP, the state is required to implement the corrective actions in accordance with the approved schedule, usually over the course of multiple years. CMS collaborates with states by providing guidance, technical assistance, templates, and other supports.15 All states are required to keep CMS updated regarding the status of the CAP implementation, but states with PERM error rates above 3 percent are required to do so every other month according to federal regulations.16
A state is deemed to be making a good faith effort if it is meaningfully implementing its CAP in alignment with the underlying regulation even if the state has not yet fully eliminated improper payments. As mentioned, historically the HHS secretary has been allowed to waive penalties if the state was making a good faith effort; however H.R. 1 eliminates the option to do so.
Key Findings
H.R. 1 expands what’s considered an erroneous payment and restricts HHS’ authority to waive penalties.
The law alters erroneous payments, which are included in CMS’ PERM audits, in two primary ways: it expands the definition of an erroneous payment, and it adds restrictions to HHS’ ability to waive the penalty for erroneous payments.
Widening the scope of erroneous Medicaid payments. H.R. 1 expands the definition of erroneous payments to include payments made on behalf of individuals who the state does not know for sure are eligible for Medicaid because insufficient information is available to prove their eligibility (such as someone whose documentation was not saved correctly at enrollment or renewal). Expanding the definition in this way risks overstating improper activity by the states by equating administrative uncertainty with fraud.
Restricting HHS’ authority to waive penalties. The law also limits which erroneous payments can be waived: HHS can waive up to the total amount paid in overpayments on behalf of eligible individuals, or payments where there is not enough information available to prove eligibility. HHS can no longer waive penalties for payments made on behalf of individuals who were ineligible for Medicaid, or for services provided to patients with insufficient information to confirm their eligibility. Guidance from CMS will clarify how this will be implemented. Ultimately, this change takes away HHS’ flexibility to waive financial penalties when states are making good faith efforts to address their errors.
H.R. 1 also expands the type of audits that can be used to determine Medicaid erroneous payment rates. Whereas historically these audits have been conducted by CMS, the law gives the secretary authority to conduct audits directly or to use state audits, such as the Medicaid Eligibility Quality Control program.17
These erroneous payment provisions take effect in fiscal year 2030, which begins on October 1, 2029. In November 2025, CMS indicated that it plans to issue further guidance to states on how to implement this section of the law.18 That guidance has not yet been released and could come in the form of preliminary guidance or a proposed regulation. H.R. 1 does not require CMS to use a specific regulatory pathway for implementation.
H.R. 1’s erroneous payment provisions will have a disproportionate impact on some states.
The following table illustrates the state rates during the most recent audits, including which states had rates over the 3 percent threshold, making them subject to penalties under the new law starting in 2029. As mentioned, the most recent national Medicaid PERM rate is 6.12 percent.19
H.R. 1 already puts extensive strain on state budgets, shifting costs for Medicaid, the Supplemental Nutrition Assistance Program (SNAP), and other programs from the federal government to states. The erroneous payment provision contributes to this by adding yet another potential reduction in federal funding and further jeopardizing states’ fiscal stability. In response, states may adopt stricter approaches to eligibility determinations, such as requiring complete documentation or prior authorization before payments are made. These changes could delay treatment for patients, add additional medical debt or uncompensated care if care is not covered, add additional administrative burden for patients and providers, and put states out of compliance with federal application processing times.
Although the provision is intended to reduce erroneous payments, error rates are likely to rise as states implement other H.R. 1 provisions that make processes more complex — such as adding Medicaid work requirements and doubling the frequency of eligibility redeterminations for individuals eligible for Medicaid under the Affordable Care Act Medicaid expansion. These changes increase the risk of errors, and states may not have sufficient time to fully adjust before the new erroneous payment rules go into effect in 2029.
Recommendations for Reducing Fraud, Waste, and Abuse
Given the potential negative impact of the H.R. 1 provisions on states, policymakers have an opportunity to identify other options that could be more effective at reducing erroneous Medicaid payments. The Medicaid and CHIP Payment and Access Commission (MACPAC), Government Accountability Office (GAO), and National Association of Medicaid Directors (NAMD) have each offered recommendations to reduce unnecessary spending in Medicaid.20
About Medicaid Program Integrity
When designed and implemented well, program integrity initiatives help to ensure that:
eligibility decisions are made correctly
prospective and enrolled providers meet federal and state participation requirements
services provided to enrollees are medically necessary and appropriate, and
provider payments are made in the correct amount and for appropriate services.
Of these, NAMD’s recommendations are particularly helpful to consider as state Medicaid agencies share the federal government’s commitment to safeguarding Medicaid funds. Program integrity efforts depend on effective collaboration between state Medicaid agencies and CMS. NAMD recently outlined five core areas of recommendations to improve program integrity in Medicaid:
Strengthen the federal and state partnership through training, technical assistance, and structured collaboration. Expanding access to the Medicaid Integrity Institute and strengthening peer-to-peer learning opportunities are two options. Other strategies include enhancing the role of the Fraud, Waste, and Abuse Advisory Group and convening key program integrity partners, including Medicaid agencies, program integrity units, and others.
Provide targeted support for high-risk service areas that present elevated program integrity risks. Suggestions include developing national risk indicators for high-risk services and providers, and offering more targeted guidance on monitoring strategies, including more frequent provider reverification and clearer documentation expectations.
Improve data sharing and national visibility. Enhancing use of CMS’ nationwide dataset, the Transformed Medicaid Statistical Information System (T-MSIS), could allow program integrity efforts to be driven by actionable nationwide data — rather than a single state’s data. Agencies could then identify cross-state billing patterns, detect emerging fraud schemes, and flag providers operating across multiple jurisdictions.
Enhance information sharing on providers and enforcement actions across programs. This would involve shifting from passive data collection to actionable intelligence across multiple programs, such as Medicaid, Medicare, and Veterans Affairs.
Expand access to tools, technology, and analytic capacity to support program integrity efforts. Predictive modeling, data analytics, interoperable systems, cross-program datasets, and artificial intelligence tools — with appropriate safeguards — could help states develop a more complete picture and effectively identify suspicious patterns.
Additional details regarding these recommendations are available from NAMD.21
Of note, these strategies — as well as those set forth by MACPAC22 and GAO23 — are collaborative, not punitive. They focus on ensuring states have the resources they need to effectively prevent and address erroneous payments. They acknowledge that as fraud schemes grow increasingly complex and span multiple programs and jurisdictions, stronger coordination, expanded data sharing, and more closely aligned federal and state/territorial strategies are needed to effectively identify and address emerging risks. Both states and CMS can play key roles in helping this happen effectively.
In contrast, H.R. 1’s erroneous payment provisions — combined with the law’s broad Medicaid cuts — create considerable financial risk for states without pairing that with the supports necessary for states to effectively address erroneous payments. As a result, states may need to limit coverage or erect barriers to services for beneficiaries, who are the least likely actors to commit fraud against Medicaid.24
HOW WE CONDUCTED THIS STUDY
This study was conducted by analyzing the underlying statute of the One Big Beautiful Bill (H.R. 1) that was signed into law on July 4, 2025; reviewing CMS data on Medicaid program integrity, including the most recent data from FY2025 that was released in 2026; analyzing relevant regulations that govern requirements related to improper payments and Medicaid corrective action plans; reviewing the preliminary and interim guidance released by the Centers for Medicare and Medicaid Services (CMS) to date to implement H.R. 1; reviewing previous guidance from CMS regarding erroneous payments; reviewing recommendations from advisory bodies such as the Medicaid and CHIP Payment and Access Commission (MACPAC) and the Government Accountability Office (GAO); considering recommendations from entities such as the National Association of Medicaid Directors; and conducting a literature review.