Health Insurers: The Other Half of the Consolidation Story

Hospital monopolies get the headlines – but new research shows health insurance markets are highly concentrated in every state, giving insurers more pricing power than most policymakers realize.

Hospital consolidation dominates the discussion on health care costs – with good reason. There is overwhelming evidence that it raises prices. But every hospital must ultimately negotiate rates with insurers, yet the consolidation story in the health insurer market has only gotten a tiny fraction of the attention. This is a mistake. While the insurer market is not as highly consolidated as the hospital market, it is still highly concentrated by any reasonable antitrust standard, and a major (and under-estimated) driver of cost growth.

The Department of Justice (DOJ) and Federal Trade Commission (FTC) use the Herfindahl Hirschman Index (HHI) to measure market concentration, where >1,800 is highly concentrated, 5,000-7,500 is where a few firms hold substantial market power, and >7,500 is a near monopoly, where a single firm holds absolute (or near absolute) price-setting autonomy. The hospital market is heavily concentrated and has an average HHI score of 5,273, with 97% of markets being at least heavily concentrated and 64% being near or complete monopolies.

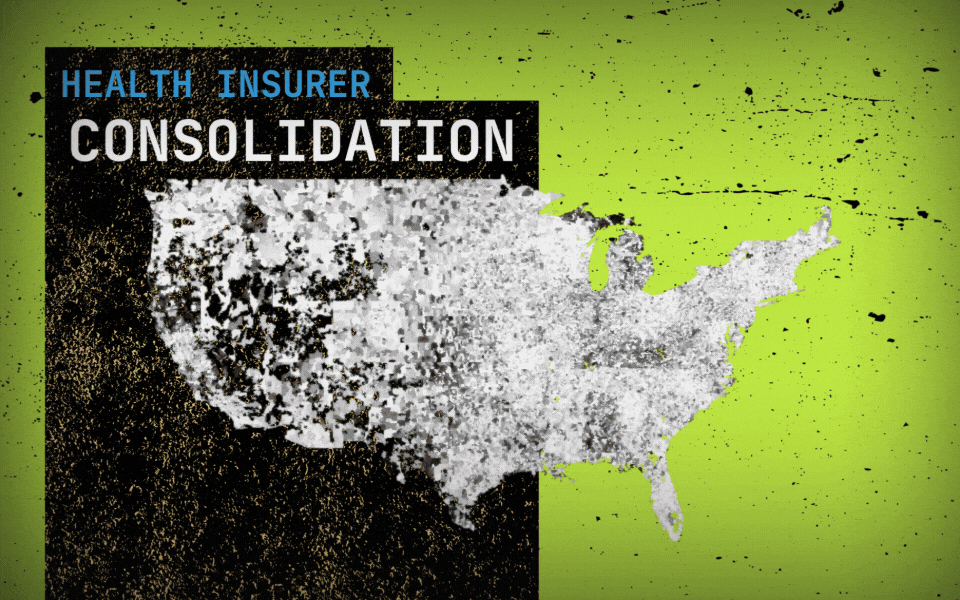
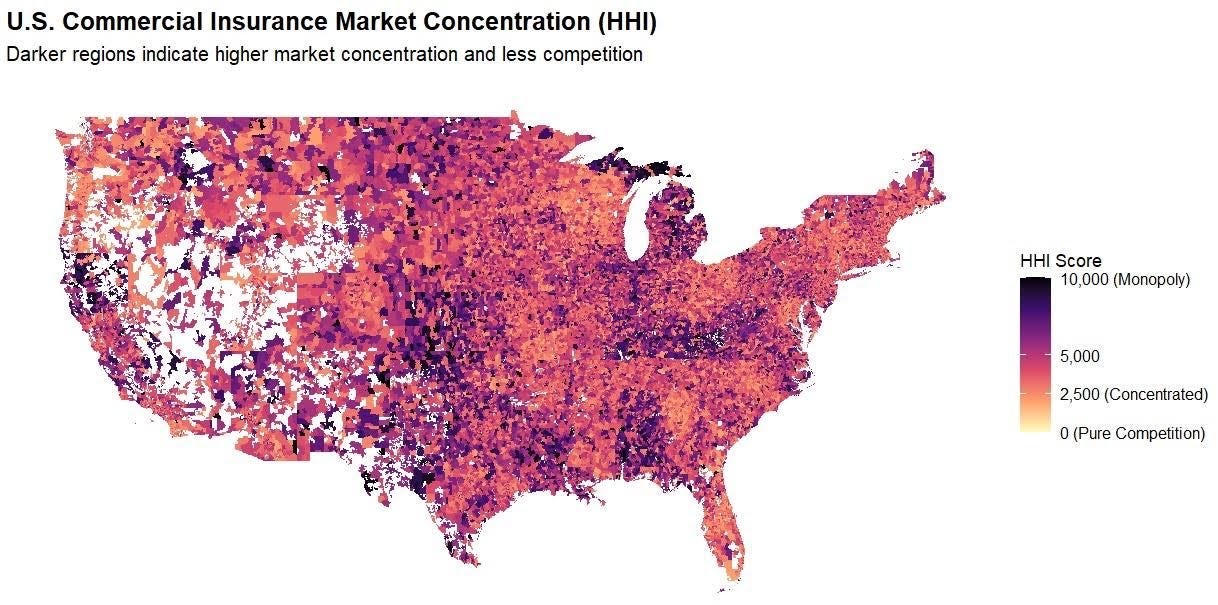
By comparison, our recent work similarly shows a high degree of consolidation among insurers. (Figure 1) We found that the state-level average HHI score in the commercial insurance market was 4,458, with 50 of 50 states (100%) at least heavily concentrated, comparable to hospital markets. This means that in almost every state, health insurers hold pronounced power in price-setting, a key component of the health care cost crisis roiling the country. The most competitive states (although still very highly concentrated) were Oregon (2,870), New York (3,203), and Georgia (3,222), whereas Kentucky (6,752) and Alabama (6,988) are near monopolies.

We find that insurers are even more consolidated than previously reported by the American Medical Association (AMA). Yet the market power of insurers, in combination with hospitals, is a vastly under-appreciated and under-studied driver of costs.

There are several reasons why it is important.

1. Vertical integration

Vertical integration is rapidly accelerating the ability of insurers to consolidate power and redefining what an insurer even is (UnitedHealth/Optum, CVS/Aetna, Cigna/Express Scripts, Elevance/Carelon, BCBSA/Ascendiun). This means that traditional plan-level data (such as that used by researchers and the DOJ/FTC) underestimates the true market power of insurers, and the shadowy network of MSOs, banks, and vendors makes it very difficult to quantify, absent new reporting or regulatory requirements

2. Geography

Where you live is important since it determines where you receive care and buy insurance. In some states, the average competition tells the story, e.g. Louisiana, Kentucky, Alabama, since certain insurers dominate the metro areas and everything in between. In others, the reassuring state averages (CA, NY) mask the variance, and hide the pockets of very uncompetitive markets, particularly in rural areas. Understanding this issue at a market level is important for creating transparency and accountability, to ensure that everyone has options and access to affordable health insurance.

3. Competition

Competition among insurers and hospitals matters, as power asymmetry and/or collusion create dysfunctional markets where costs are “optimized” for the purposes of power and profits, not to make health care more affordable for consumers. It is also important to look at competition among insurers. Market dominance confers advantages that have little to do with delivering better care, such as leverage over providers, captive employer relationships, and pricing power insulated from competition.

While insurer markets aren’t as concentrated as hospital markets, they’re concentrated enough to matter, and the structure of that concentration makes it a distinct and important part of the cost problem. In our next piece, we will show which carriers hold dominant positions and where, and why the answer surprised us.

This research was made possible by the support of Arnold Ventures.

Data from Clarivate Managed Market Surveyor dataset. Includes FI/SI/HMO/PPO/POS/ACA plans.

HHI scores weighted according to zip-level and policy volume. Concentration levels: Red – Extreme; Orange – Severe; and Yellow – Very High.

Wage Rule could shake up hospital hiring

A Trump administration plan to overhaul wage levels for visa holders is jolting hospitals and long-term care facilities that are heavily reliant on foreign-born workers.

Why it matters: 

It’s the latest immigration-related policy change to loom over the health care workforce, coming after President Trump’s $100,000 H-1B visa fee and the suspension of certain immigrants’ work authorization renewals.

  • The latest move could further drive up costs for providers already struggling with staffing shortages, thin margins and growing patient demand, because many health jobs can’t be outsourced or automated.

Driving the news: 

The Department of Labor wants to change the formula for calculating what it considers “fair minimum pay” for workers on certain visas, like H-1Bs, and green card sponsorship jobs.

  • The administration says the change would make it harder for companies to use visa programs to obtain cheaper labor and undercut American workers.
  • But the rule could have an outsized effect on health systems, testing labs, nursing homes and research institutions that sponsor foreign-trained workers.
  • There’s special concern about rural health providers that rely heavily on foreign-born clinicians to fill gaps in care in underserved areas.

Critics say the change won’t adequately account for regional wage differences or experience levels.

  • They also warn a higher wage requirement will force employers to raise pay for U.S. workers to comply with labor laws — and make it unsustainable to hire foreign-born talent.

The big picture: 

The U.S. health care system is heavily dependent on a foreign-born workforce. Immigrants make up about 16% of registered nurses nationwide, per a KFF analysis.

  • They make up 28% of the U.S. long-term care workforce, KFF found.
  • “This has the potential to significantly limit the sector’s ability to provide timely and quality health care services to those in need, both now and in the future,” Dana Ritchie, associate vice president of the American Health Care Association and National Center for Assisted Living, wrote in public comments on the proposal.

Zoom in: 

Lynn Bruder, the CEO of staffing firm Nucleus Healthcare, said wage rates for visa-holding nurses on the lower end of the pay scale could jump 25% to 35% in certain markets, or from about $40 an hour to more than $50 an hour.

  • “The likely outcome is continued reliance on significantly more expensive agency staffing solutions and reduced ability for hospitals to build stable, long term workforce pipelines,” Bruder wrote in comments about the rule.

The other side: 

The Department of Labor declined to comment. But visa programs have long been criticized for suppressing wages across many industries.

  • The changes would force employers to pay an estimated $6.5 billion in additional wages and increase the average certified wage by approximately $14,000 per year, according to the proposed rule.
  • “These proposed revisions aim to better align prevailing wage levels with the wages paid to U.S. workers,” the Labor Department wrote.
  • The window for public comments on the proposal closed this week.

The bottom line: 

Health care providers say the administration is treating hospitals and nursing homes like any other employer, even though the workforce is being squeezed by an aging population and rising demand for care.

  • “Larger hospital systems may be able to absorb this increase, but you’ll see employers who are much smaller or mid-sized won’t,” Ann-Rose Johnson-Lewis, director of legal services at WorldWide HealthStaff Solutions, told Axios.
  • “You’ll see rural heath care systems not be able to absorb that. We’ll see a reduction in the workforce, fewer new hires and, ultimately, the broader economy will see the consequence of that.”

Wall Street stagflation chatter rises

Flared jeans are in style, an oil crisis is driving pain at the pump, and unemployment is rising: It’s not 1978, but it kinda feels that way.

The big picture: 

Talk of stagflation is rising on Wall Street, as investors fret the dreaded pairing of high inflation and high unemployment is making a comeback.

Zoom in: 

On Monday alone, at least six notes from investment managers and Wall Street analysts warned of “stagflationary” concerns.

  • Media outlets have run with this.
  • Last Friday, Chicago Fed President Austan Goolsbee noted that rising unemployment on top of an oil price shock creates “exactly the kind of stagflationary environment that’s as uncomfortable as any that faces a central bank,” per the Wall Street Journal.

Flashback: 

Analysts and media started tossing out the “s” word when inflation revved up back in 2021.

  • The term “stagflation” really took off the next year, when Russia invaded Ukraine, spiking energy prices. Everyone then predicted a recession that never materialized.

State of play: 

Today is different for two reasons. First, the job market is more sluggish than it was a few years ago.

  • Second, the oil shock from the Iran war is potentially magnitudes larger than from the Russian war, taking 20% of global supply oil off the board.
  • “Disruption to the Strait of Hormuz creates a far larger potential supply shock that extends beyond oil,” Skylar Montgomery Koning, a macro strategist with Bloomberg, wrote in a note.
  • “Shipping flows more broadly are being disrupted. That is pushing up energy and food costs, lifting inflation and squeezing growth.”
  • “This stagflationary mix is particularly toxic for markets, as it increases the risk that bonds and equities sell off together.”

Reality check: 

It’s not the 1970s. Economists believe the Iran war will slow economic growth and cause an increase in inflation, but not to the extremes seen back then.

  • “If you want the word ‘stagflation’ with a very little ‘s,’ you could,” says David Kelly, chief global strategist at JPMorgan Asset Management.
  • He recently revised his economic growth projections slightly downward this year due to the war. And he is projecting slightly higher inflation.
  • The difference between now and the 1970s is, back then, higher prices led to wage increases, which led to more inflation in a wage-price spiral that got out of hand, he says. Workers just don’t have the power for that today.
  • “This is probably just going to slow the economy down, rather than trigger some long wave of inflation,” says Michael Madowitz, principal economist at the progressive Roosevelt Institute.

The bottom line: 

This is not your father’s economic shock. Yesteryear’s bell bottoms would look a bit weird if you trotted them out today.

CBO’s Updated Projections of the Hospital Insurance Trust Fund’s Finances

The Congressional Budget Office regularly updates the Congress on our projections of the Hospital Insurance (HI) Trust Fund’s financial position as well as changes in our outlook on that position. This blog post serves as that update.

The HI trust fund is used to pay for benefits under Medicare Part A, which covers inpatient hospital services, care provided in skilled nursing facilities, home health care, and hospice care. The fund derives its income from several sources. Over the next 30 years, about three-quarters of its annual income comes from the Medicare payroll tax and roughly one-eighth comes from income taxes on Social Security benefits. The rest comes from other sources.

Budget Projections

We estimate that the HI trust fund’s balance is exhausted in 2040. The balance generally increases through 2031, but spending begins to outstrip income in the following year.

That projection is based on our demographic projections published in January 2026, our economic and 10-year budget projections published on February 11, 2026, and our long-term budget projections that extend those earlier projections. It does not account for any effects, including effects on the economy or the budget, of the Supreme Court’s ruling on tariffs on February 20, 2026 (Learning Res., Inc. v. Trump, Nos. 24-1287, 25-250, slip op. (S. Ct. Feb. 20, 2026)).

As required by the Deficit Control Act, our projections reflect the assumption that benefits would be paid as scheduled even after the HI trust fund was exhausted. If the balance of the fund was exhausted and the fund’s spending continued to outstrip its income, total payments to health plans and providers for services covered under Part A would be limited by law to the amount of income credited to the fund. Total benefits would need to be reduced (in relation to the amounts in our baseline projections) by an amount that rises from 8 percent in 2040 to 10 percent in 2056, we estimate. It is unclear what changes the Centers for Medicare & Medicaid Services would make to operate the Part A program under those circumstances.

We estimate that the HI trust fund’s actuarial balance measured over a 25-year period is negative: an actuarial deficit of 0.30 percent of taxable payroll (or 0.13 percent of gross domestic product, or GDP).

The actuarial balance is a single number that summarizes the fund’s current balance and annual future streams of revenues and outlays over a certain period. It is the sum of the present value of projected income and the current trust fund balance minus the sum of the present value of projected outlays and a year’s worth of benefits at the end of the period. A present value is a single number that expresses a flow of current and future income or payments in terms of an equivalent lump sum received or paid today. And taxable payroll is the total amount of earnings—wages and self-employment income—subject to the payroll tax.

To eliminate the actuarial deficit, lawmakers would need to take action. They could increase taxes, reduce payments, transfer money to the trust fund, or take some combination of those approaches. The estimated size of the change needed—0.30 percent of taxable payroll—excludes the effects of changes in taxes or spending on people’s behavior and the economy. Those effects, which would depend on the specifics of the policy change, would alter the size of the tax increase, benefit reduction, or transfer needed to eliminate the actuarial deficit.

Changes in Our Projections Since March 2025

The year in which the HI trust fund’s balance is exhausted in our current projections, 2040, is 12 years earlier than in our most recent estimate of that date, which was published in March 2025. Measured in relation to taxable payroll, the trust fund’s 25-year actuarial deficit is 0.17 percentage points greater in the current projections than in last year’s. (Measured in relation to GDP, the actuarial deficit is 0.07 percentage points greater than we projected last year.) Those changes are driven largely by projections of less income to the fund. Projections of greater spending also contribute to the changes.

Our projections of income to the HI trust fund are less this year than last year for three main reasons:

  • First, revenues from taxing Social Security benefits are smaller in the current projections because of changes put in place by the 2025 reconciliation act (Public Law 119-21), which lowered tax rates and created a temporary deduction for taxpayers age 65 or older.
  • Second, we decreased our projections of revenues from payroll taxes to account for projections of lower earnings.
  • Finally, we now project interest income credited to the trust fund to be smaller than estimated last year because of the smaller trust fund balances in this year’s projections.

Spending is projected to be greater mainly because of an increase in expected spending per enrollee. Per-enrollee spending in Medicare Part A’s fee-for-service program in 2025 and bids in 2026 by providers of Medicare Advantage plans were both higher than we expected, leading to projections of greater per-enrollee spending in both programs.

Projections of the HI trust fund’s balances are sensitive to small changes in projections of its spending and income. As a result, those estimates are highly uncertain.

CMS’ 2024 Health Spending Report: Key Insights

As media attention focused on Minneapolis, Greenland and Venezuela last week, the Center for Medicaid and Medicare Services (CMS) released its 2024 Health Expenditures report Thursday: the headline was “Health care spending in the US reached $5.3 trillion and increased 7.2% in 2024, similar to growth of 7.4% in 2023, as increased demand for health care influenced this two-year trend. “

Less media attention was given two Labor Department reports released the Tuesday before:

  • Prices: The consumer-price index (CPI) for December came in somewhat higher than expected with an increase of 0.3% and 2.7% over the past 12 months. Overall inflation isn’t rising, but it also isn’t coming down.
  • Wages: The Labor Department reported average hourly earnings after inflation in the last year rose 0.7% during the first five months of this year, but real hourly earnings have declined 0.2% since May. They’re stuck.

Prices are increasing but wages for most hourly workers aren’t keeping pace. That’s why affordability is the top concern for voters.

Meanwhile, the health economy continues to grow—no surprise.  It’s a concern to voters only to the extent it’s impacting their ability to pay their household bills. They don’t care or comprehend a health economy that’s complex and global; they care about their out-of-pocket obligations and surprise bills that could wipe them out.

As Michael Chernow, MedPAC chair and respected Harvard Health Policy professor wrote:

“The headline number, 7.2% growth in 2024, is concerning but hardly a surprise. It follows 7.4% growth in 2023. This rate of NHE growth is not sustainable. It exceeds general inflation and growth in the gross domestic product (GDP), pushing the share if GDP devoted to health care spending to 18%  in 2024; the share of GDP devoted to health care is projected to rise to 20.3% by 2033. In fact, these figures may be an underestimate of the fiscal burden of the health care system because spending on some things, such as employer administrative costs, are not captured… Given all the attention to prices and insurer profits, it is important to note that those factors are not the main drivers of spending growth—this time, it’s not the prices, stupid. There was virtually no excess medical inflation (medical inflation above general inflation) for 2023 or 2024. In fact, prices for retail drugs (net of rebates) rose at a rate below inflation. There will certainly be cases of rising prices driving spending, but on average, price growth is not the problem. This does not mean high-priced products and services are not an important component of spending growth, but instead it implies that their contribution to spending growth on average stems from their greater use, not rising prices. The main driver of spending growth is greater volume and intensity of care…”

My take:

Since 2000 to 2024, total healthcare spending in the U.S. has been volatile:

  • 2000–2007: High growth, typically 6–8% per year (driven by rising utilization and prices).
  • 2008–2013: Growth slowed to 3–4% during and after the Great Recession.
  • 2014–2016: Growth ticked up to 4.5–5.8% with ACA coverage expansion.
  • 2017–2019: Moderation around 4.5%.
  • 2020: COVID‑19 shock—growth slowed to ~2% due to deferred care.
  • 2021: Rebound to ~4%.
  • 2022: 4.8%, close to pre‑pandemic norms.
  • 2023: 7.4%, fastest since 1991–92.
  • 2024: 7.2%, reaching $5.3 trillion (18% of GDP)

Between 2000 and 2024, total health spending in the U.S. increased $3.9 trillion (279%) while the U.S. population grew by 58 million (20.4%). 2025 spending is expected to follow suit. The underlying reason for the disconnect between health spending and population growth is more complicated than placing blame on any one sector or trend: it’s true in the U.S. and every other developed system in the world. Healthcare is expensive and it’s costing more.

This is good news if you’ve made smart bets as an investor in the health industry but it’s problematic for just about everyone else including many in the industry who’ve benefited from its aversion to spending controls and cost cutting.

The current environment for the healthcare economy is increasingly hostile to the status quo. Voters think the system is wasteful, needlessly complicated and profitable. Lawmakers think it’s no man’s land for substantive change, defaulting to price transparency, increased competition and state regulation in response. Private employers, who’ve bear the brunt of the system’s ineffectiveness, are timid and reformers are impractical about the role of private capital in the health economy’s financing.

The healthcare economy will be an issue in Campaign 2026 not because aggregate spending increased 7-8% in 2025 per CMS, but because it’s no longer justifiable to a majority of Americans for whom it’s simply not affordable. Regrettably, as noted in Corporate Board Member’s director surveys, only one in five healthcare Boards is doing scenario planning with this possibility in mind.

P.S. The President released his Great Healthcare Plan last Thursday featuring his familiar themes—price transparency for hospitals and insurers, most favored pricing and elimination of PBMs to reduce prescription drug costs—along with health savings accounts for consumers in lieu of insurance subsidies. The 2-page White House release provided no additional details.

CMS’ 2024 Health Spending Report: Key Insights

As media attention focused on Minneapolis, Greenland and Venezuela last week, the Center for Medicaid and Medicare Services (CMS) released its 2024 Health Expenditures report Thursday: the headline was “Health care spending in the US reached $5.3 trillion and increased 7.2% in 2024, similar to growth of 7.4% in 2023, as increased demand for health care influenced this two-year trend. “

Less media attention was given two Labor Department reports released the Tuesday before:

  • Prices: The consumer-price index (CPI) for December came in somewhat higher than expected with an increase of 0.3% and 2.7% over the past 12 months. Overall inflation isn’t rising, but it also isn’t coming down.
  • Wages: The Labor Department reported average hourly earnings after inflation in the last year rose 0.7% during the first five months of this year, but real hourly earnings have declined 0.2% since May. They’re stuck.

Prices are increasing but wages for most hourly workers aren’t keeping pace. That’s why affordability is the top concern for voters.

Meanwhile, the health economy continues to grow—no surprise.  It’s a concern to voters only to the extent it’s impacting their ability to pay their household bills. They don’t care or comprehend a health economy that’s complex and global; they care about their out-of-pocket obligations and surprise bills that could wipe them out.

As Michael Chernow, MedPAC chair and respected Harvard Health Policy professor wrote:

“The headline number, 7.2% growth in 2024, is concerning but hardly a surprise. It follows 7.4% growth in 2023. This rate of NHE growth is not sustainable. It exceeds general inflation and growth in the gross domestic product (GDP), pushing the share if GDP devoted to health care spending to 18%  in 2024; the share of GDP devoted to health care is projected to rise to 20.3% by 2033. In fact, these figures may be an underestimate of the fiscal burden of the health care system because spending on some things, such as employer administrative costs, are not capturedGiven all the attention to prices and insurer profits, it is important to note that those factors are not the main drivers of spending growth—this time, it’s not the prices, stupid. There was virtually no excess medical inflation (medical inflation above general inflation) for 2023 or 2024. In fact, prices for retail drugs (net of rebates) rose at a rate below inflation. There will certainly be cases of rising prices driving spending, but on average, price growth is not the problem. This does not mean high-priced products and services are not an important component of spending growth, but instead it implies that their contribution to spending growth on average stems from their greater use, not rising prices. The main driver of spending growth is greater volume and intensity of care…”

My take:

Since 2000 to 2024, total healthcare spending in the U.S. has been volatile:

  • 2000–2007: High growth, typically 6–8% per year (driven by rising utilization and prices).
  • 2008–2013: Growth slowed to 3–4% during and after the Great Recession.
  • 2014–2016: Growth ticked up to 4.5–5.8% with ACA coverage expansion.
  • 2017–2019: Moderation around 4.5%.
  • 2020: COVID‑19 shock—growth slowed to ~2% due to deferred care.
  • 2021: Rebound to ~4%.
  • 2022: 4.8%, close to pre‑pandemic norms.
  • 2023: 7.4%, fastest since 1991–92.
  • 2024: 7.2%, reaching $5.3 trillion (18% of GDP)

Between 2000 and 2024, total health spending in the U.S. increased $3.9 trillion (279%) while the U.S. population grew by 58 million (20.4%). 2025 spending is expected to follow suit. The underlying reason for the disconnect between health spending and population growth is more complicated than placing blame on any one sector or trend: it’s true in the U.S. and every other developed system in the world. Healthcare is expensive and it’s costing more.

This is good news if you’ve made smart bets as an investor in the health industry but it’s problematic for just about everyone else including many in the industry who’ve benefited from its aversion to spending controls and cost cutting.

The current environment for the healthcare economy is increasingly hostile to the status quo. Voters think the system is wasteful, needlessly complicated and profitable. Lawmakers think it’s no man’s land for substantive change, defaulting to price transparency, increased competition and state regulation in response. Private employers, who’ve bear the brunt of the system’s ineffectiveness, are timid and reformers are impractical about the role of private capital in the health economy’s financing.

The healthcare economy will be an issue in Campaign 2026 not because aggregate spending increased 7-8% in 2025 per CMS, but because it’s no longer justifiable to a majority of Americans for whom it’s simply not affordable. Regrettably, as noted in Corporate Board Member’s director surveys, only one in five healthcare Boards is doing scenario planning with this possibility in mind.

Paul

P.S. The President released his Great Healthcare Plan last Thursday featuring his familiar themes—price transparency for hospitals and insurers, most favored pricing and elimination of PBMs to reduce prescription drug costs—along with health savings accounts for consumers in lieu of insurance subsidies. The 2-page White House release provided no additional details.

CMS’ 2024 Health Spending Report: Key Insights

As media attention focused on Minneapolis, Greenland and Venezuela last week, the Center for Medicaid and Medicare Services (CMS) released its 2024 Health Expenditures report Thursday: the headline was “Health care spending in the US reached $5.3 trillion and increased 7.2% in 2024, similar to growth of 7.4% in 2023, as increased demand for health care influenced this two-year trend. “

Less media attention was given two Labor Department reports released the Tuesday before:

  • Prices: The consumer-price index (CPI) for December came in somewhat higher than expected with an increase of 0.3% and 2.7% over the past 12 months. Overall inflation isn’t rising, but it also isn’t coming down.
  • Wages: The Labor Department reported average hourly earnings after inflation in the last year rose 0.7% during the first five months of this year, but real hourly earnings have declined 0.2% since May. They’re stuck.

Prices are increasing but wages for most hourly workers aren’t keeping pace. That’s why affordability is the top concern for voters.

Meanwhile, the health economy continues to grow—no surprise.  It’s a concern to voters only to the extent it’s impacting their ability to pay their household bills. They don’t care or comprehend a health economy that’s complex and global; they care about their out-of-pocket obligations and surprise bills that could wipe them out.

As Michael Chernow, MedPAC chair and respected Harvard Health Policy professor wrote:

The headline number, 7.2% growth in 2024, is concerning but hardly a surprise. It follows 7.4% growth in 2023. This rate of NHE growth is not sustainable. It exceeds general inflation and growth in the gross domestic product (GDP), pushing the share if GDP devoted to health care spending to 18%  in 2024; the share of GDP devoted to health care is projected to rise to 20.3% by 2033. In fact, these figures may be an underestimate of the fiscal burden of the health care system because spending on some things, such as employer administrative costs, are not captured… Given all the attention to prices and insurer profits, it is important to note that those factors are not the main drivers of spending growth—this time, it’s not the prices, stupid. There was virtually no excess medical inflation (medical inflation above general inflation) for 2023 or 2024. In fact, prices for retail drugs (net of rebates) rose at a rate below inflation. There will certainly be cases of rising prices driving spending, but on average, price growth is not the problem. This does not mean high-priced products and services are not an important component of spending growth, but instead it implies that their contribution to spending growth on average stems from their greater use, not rising prices. The main driver of spending growth is greater volume and intensity of care…”

My take:

Since 2000 to 2024, total healthcare spending in the U.S. has been volatile:

  • 2000–2007: High growth, typically 6–8% per year (driven by rising utilization and prices).
  • 2008–2013: Growth slowed to 3–4% during and after the Great Recession.
  • 2014–2016: Growth ticked up to 4.5–5.8% with ACA coverage expansion.
  • 2017–2019: Moderation around 4.5%.
  • 2020: COVID‑19 shock—growth slowed to ~2% due to deferred care.
  • 2021: Rebound to ~4%.
  • 2022: 4.8%, close to pre‑pandemic norms.
  • 2023: 7.4%, fastest since 1991–92.
  • 2024: 7.2%, reaching $5.3 trillion (18% of GDP)

Between 2000 and 2024, total health spending in the U.S. increased $3.9 trillion (279%) while the U.S. population grew by 58 million (20.4%). 2025 spending is expected to follow suit. The underlying reason for the disconnect between health spending and population growth is more complicated than placing blame on any one sector or trend: it’s true in the U.S. and every other developed system in the world. Healthcare is expensive and it’s costing more.

This is good news if you’ve made smart bets as an investor in the health industry but it’s problematic for just about everyone else including many in the industry who’ve benefited from its aversion to spending controls and cost cutting.

The current environment for the healthcare economy is increasingly hostile to the status quo. Voters think the system is wasteful, needlessly complicated and profitable. Lawmakers think it’s no man’s land for substantive change, defaulting to price transparency, increased competition and state regulation in response. Private employers, who’ve bear the brunt of the system’s ineffectiveness, are timid and reformers are impractical about the role of private capital in the health economy’s financing.

The healthcare economy will be an issue in Campaign 2026 not because aggregate spending increased 7-8% in 2025 per CMS, but because it’s no longer justifiable to a majority of Americans for whom it’s simply not affordable. Regrettably, as noted in Corporate Board Member’s director surveys, only one in five healthcare Boards is doing scenario planning with this possibility in mind.

Paul

P.S. The President released his Great Healthcare Plan last Thursday featuring his familiar themes—price transparency for hospitals and insurers, most favored pricing and elimination of PBMs to reduce prescription drug costs—along with health savings accounts for consumers in lieu of insurance subsidies. The 2-page White House release provided no additional details.

Healthcare 2026: Three Realities

Congress returns to DC this week to debate the merits of extending the advanced premium tax credits that enable coverage for 4 million in a climate of high anxiety about U.S. intervention in Venezuela and heightened tension with Russia and China.

For many, these unfolding events are numbing: helplessness, frustration and fear are widespread. As 2026 unfolds for U.S. healthcare, the realities are these:

  • The healthcare economy will be under pressure to do more with less. The health economy is increasingly controlled by private investors and large publicly traded companies in every sector whose shareholder obligations are primary. Public funding from federal, state and local sources is shrinking as a result of the Big Beautiful Bill and pushback from taxpayers who think the system wasteful and ineffective. The S&P Health Index for 2025 closed the year underperforming the broader market. Private equity investments in healthcare except AI solutions that reduce operating costs at scale are troubled. Thus, in 2026, operating margins in every sector will be stressed, access to private capital will be vital and business as usual obsolete.
  • Mass populism will magnify attention to the healthcare affordability. Per polls, costs of living are issue one to voters. While prices for gas and groceries have moderated, housing and healthcare prices have escalated unabated. Voters think both essential but the majority think consolidation, corporatization and regulatory protections advantage the biggest players and protect special interests. In housing, it’s simpler for consumers: mortgages, rent and utility costs are straightforward. But healthcare is more complicated: out of pocket costs—premiums, co-pays, deductibles, caregivers, OTC et al—are not easily calculable and price estimator tools, patient support and revenue cycle management policies make it easier for consumers. The net result: a large and growing majority of voters think healthcare is unaffordable and government intervention needed.
  • The mid-term election November 3, 2026 will be likely be the reset for healthcare’s future in 2028 and beyond. All 435 House Seats, 35 U.S. Senate seats and 39 state/territorial governors will be elected. All will face voters anxious about the future and how they’ll pay their bills. The 2026 results will set the stage for 2028 Presidential campaigns that will feature a wide range of alternatives to the healthcare status quo. Some will be incremental; others labeled radical. But all will promise changes unwelcome to many of its prominent incumbents.

Each sector in healthcare—hospitals, physician services, long-term care, insurers, life science manufacturers, enablers and advisors—is vulnerable. None welcomes unflattering attention and all spend heavily on messaging and advocacy to protect themselves.  All recognize the elephant in the room—large employers that have patiently funded the system’s profitability and value protective regulation that limit disruption. And in all, implementation of AI solutions that lower operating costs and streamline performance is THE immediate priority.

The realties of 2026 for healthcare are foreboding: business as usual is not an option.

The year the U.S. economy bent but didn’t break

https://www.axios.com/2025/12/30/economy-trump-jobs-inflation

The U.S. economy was beaten and battered in 2025, and powered ahead despite it all.

The big picture: 

The question for 2026 is whether the underlying sources of weakness that are already evident will broaden out into something that threatens to undermine its overall resilience.

Threat level: 

Beneath buoyant growth in GDP and asset prices are serious worries.

  • The labor market is looking softer by the month.
  • Elevated inflation is pinching family budgets.
  • And fears are rising that the AI-fueled boom could leave ordinary workers worse off.

The big picture: 

Those pain points have already caused public opinion on the economy to turn sharply negative.

  • At the same time, one lesson of 2025 is that the U.S. economy is awfully adaptable and can withstand more challenges than you might expect.

Zoom in: 

In April, President Trump’s “Liberation Day” tariffs sent the stock market swooning and economists upgrading their recession odds.

  • It wasn’t the only sign of trouble. Job growth came to a near-halt over the summer. Deportations and restrictionist immigration are part of the story, along with the aging of the native-born workforce. But part of it is that companies are trying to get leaner.
  • Inflation, meanwhile, has become the fire that will not be fully doused. While the sky-high inflation of 2022 is a thing of the past, inflation has been above the Federal Reserve’s target 2% target every single month since March 2021.
  • Affordability is top of mind in public opinion.

Reality check: 

It’s important to remember, though, that the $30 trillion U.S. economy, for all its flaws, can weather a lot, at least at the macro level. It is, as RSM chief economist Joe Brusuelas puts it, a “dynamic and resilient beast.”

By the numbers: 

The headline data numbers have held up just fine, a trend punctuated by Tuesday’s report that GDP rose at a 4.3% annual rate in Q3, amid strong consumer spending and the AI-investment surge.

  • The S&P 500 is up more than 17% so far this year.
  • The unemployment rate edged up over the course of the year, to 4.6% in November. But that’s still lower than it has been in 69% of months dating back to 1948.

Yes, but: 

You can’t eat GDP, or points of the S&P. And the biggest issues for the U.S. economy — and the things that look like pre-eminent risks for 2026, are in what you might call the peripheral data.

  • While layoffs are still few, employers have slowed their hiring rates, which means those who do lose their jobs face hard sledding.
  • Job creation has been overwhelmingly driven by health care, with usual cyclical sectors like manufacturing and transportation and warehousing shedding jobs.
  • Consumer demand is displaying “K-shaped” trends, being highly concentrated among the affluent Americans enjoying surging stock wealth — while the household finances of lower earners are increasingly on a razor’s edge.

What they’re saying: 

The fact that strong third-quarter GDP growth coincided with weak job creation, Brusuelas writes in a note, “implies a decoupling between robust topline growth and soft jobs creation which in our estimation is likely to be the major economic narrative looking forward into 2026.”

What we’re watching: 

The 2026 economy is set to receive a boost from Washington, as the signature tax law passed in July — the One Big, Beautiful Bill Act — acts as a fiscal stimulus alongside the delayed impact of the Federal Reserve three interest-rate cuts since September.

  • It’s hard for companies to experience the kind of robust demand for goods and services they’ve seen in 2025 and not eventually have to hire more workers to help fulfill it.

The bottom line: 

There are plenty of risks on the horizon for 2026, but the economy’s striking resilience in 2025 is a reminder that doom-and-gloom predictions for the U.S. economy often prove wrong.

America’s Three Economies: Vibes Sinking, Data Treading Water, Elites Sailing Away

Roosevelt Forward bar chart showing the share of jobs added in Health Care and Social Assistance from 2015 to 2025. 2024 has a large spike near 90%, while other years, except 2020-2021, are below 30%. 2020 and 2021 data are missing.

As we approach the end of 2025, it’s a good time to take stock of the US economy. There’s justifiable concern that this year has entrenched a K-shaped economy, where the have-mores leave the haves and have-nots behind. But there are more than two stories going on right now.

First, the vibes are bad (just ask anyone coming out of a grocery store). Second, the real economy—prices, jobs, and consumer and business spending, among other factors—is worse than it was a year ago, but holding up OK (4.4 percent unemployment, GDP growth over 2 percent, and inflation around 3 percent is hardly the stuff of recession). Third, a small number of people and companies are doing extremely well.

Depending on where you stand, you’re hearing very different things about the economy, but a pretty consistent theme is an administration that has not delivered on promises made to voters—while delivering to the president’s family and friends.

Under the Hood, the Story Gets More Complicated

It’s been a predictably rough year for the US economy. Tariffs have raised goods prices and hit manufacturing jobs, immigration crackdowns have crippled the labor force, and reversing energy policies dramatically has unwound an energy investment boom. As a result, the job market is softer, prices are still high, and inflation is up and apparently rising based on the data flow that has (finally) started to trickle back in.

That said, if the data are weaker, the economic mood of the country is, in a word, awful. Consumer sentiment in October was only exceeded by lows from the worst of the early 1980s recession, the peak of the 2022 inflation, and the months following the “Liberation Day” tariff announcement this year. Since January, consumer sentiment has plunged, giving up essentially all gains from a steady rise after the inflation peak of 2022.

That pessimism isn’t purely emotional—it reflects months of higher grocery and utility bills. In fact, across both the major household expectations surveys, families expect inflation to keep going up next year—which most economists expect as well. And roughly twice as many consumers surveyed by the Conference Board expect the jobs picture to be weaker rather than stronger in the next six months.

This view is both pessimistic and realistic given the data we’ve seen so far this year. It’s unmistakably true that the labor market and the inflation picture are weaker than last fall. What’s worrying to the wonkier economy watchers, however, is that the pressures on both inflation and unemployment are in the wrong direction. There are real risks that both inflation and the jobs picture could get worse, but (short of policy reversals) few predictable shocks are likely to make either improve in the near term.

Job growth has stayed positive but slowed dramatically, from an average 167,000 jobs a month in January to just 109,000 in September (and will likely be revised down further with annual revisions early next year). Over 87 percent of all jobs added this year are in health care and social assistance (a given in an aging country), while the rest of the economy has added just 71,000 jobs all year. And there’s little sign that tariffs are about to bring down prices, nor are there signs that the demand side of the economy is about to pick up.

It’s Not Great, but There’s Plenty of Time to Panic Later

The closer you are to the data, the less pessimistic you probably are right now. But, as we can see in recent Fed meeting minutes, the debate is largely between two camps: The first is those who think the labor market is middling and the risks of rising inflation are serious. The second is those who think the risks of rising inflation are less worrisome than the chances the labor market deteriorates further.

It’s clearly too soon to panic about a recession, and the best labor market data we have say things are holding up well by historical standards—September’s 4.4 percent unemployment is better than about 80 percent of months since 2000—it’s just that there’s little to suggest things are about to improve significantly.

That said, the economy continues to chug along on the strength of spending by resilient, yet quite frustrated, consumers. The final reading on second quarter GDP shows US consumer spending keeping the economy going, even as savings deplete.

Early holiday spending numbers look strong, so it seems like US consumers are going to muddle through tariffs. The distribution of consumer spending remains pretty narrow—high earners are doing much more of the broad-based spending in the economy

However, if you get your news from stock markets, or even from retirement statements, the world is different entirely, and much more optimistic—at least from a high level. After a massive swoon in April, the US stock market has had a great year, powered by tax cuts for corporations and the wealthy and an AI investment boom that looks bubble-like to some inside it.

Yet, like in the real economy, the more you dig into the data the farther from the extremes your views can go. Job and corporate earnings growth are concentrated in increasingly narrow slices of the economy. Corporate earnings are notoriously concentrated at this point, with the top 1.4 percent of S&P 500 companies accounting for almost all of stock market gains this year—just seven companies are now one-third of the value of S&P 500.

How Do We Square These Takes?

Overall, the data are on a more even keel than either the awful vibes most Americans are feeling from an affordability crisis or the anxiously warm vibes of investors. We’re not living through the economic boom tech investors see everywhere, nor the near-term dystopia consumers are feeling. The economy is weaker than last year and likely to continue to soften a bit more over the first part of next year, but the good news is at least for now things are not as bad in the data as in the headlines. The bad news is . . . that’s the good news.