Last Friday, I had the honor of meeting with Fellows in the Milbank Memorial Fund program where top state health department and elected leaders discuss policy issues facing their states. Their issues are mounting and complicated. Their role and the scope of their responsibilities are expanding. Per the National Association of State Budget Officers, health programs accounted for 31% of the average state’s budget in FY2025 though what’s included and how it’s spent varies widely by state.
Most are compensated below their private sector peers. All work long days. All share similar challenges:
State legislatures are asking for simple answers to complex problems about costs, coverage and services.
Governors are asking for solutions to politically-sensitive problems that don’t disturb voter confidence.
Program leads in state health agencies want increased funding and less administrative oversight.
Healthcare trade associations are amping-up their advocacy machinery to protect their interests and fend off election-year losses.
And federal policies, rules and guidelines from HHS, CMS, VA, CDC, DOD, FDA, DOA et al are changing almost daily prompting court actions and regulatory chaos. In tandem. funding cuts via the One Big Beautiful Bill, uncertainty about programs like Rural Health Transformation and vaccine policy, and endless directives paralyze state health leader effectiveness.
The federal government played a back seat to states until the modern era. That changed as Medicare and Medicaid became the primary banks for healthcare. By design, states oversaw the delivery and financing of healthcare services within their borders, often experimenting with innovations in coverage to address growing access issues in underserved populations.
Today, states have a full plate: control licensing and scope of practice, insurer solvency and coverage requirements, retail pharmacies, public health programs, competition, price transparency, facility adequacy and safety (hospitals, nursing homes et al) and many much more. Since the conservative leaning Supreme Court’s decision in Dobbs v. Jackson Women’s Health Organization (2022), tricky issues like abortion rights and others have defaulted to states to adjudicate further taxing the state’s healthcare leadership and resources.
The road ahead for state healthcare regulators will be harder regardless of the state’s population, partisan leaning and resources. Spending levels are not sustainable, dissatisfaction with the health system is at an all-time high and neither political party has advanced solutions that achieve the triple aim: better care, lower cost and universal access. Reality:
The healthcare industry changes faster than its laws and regs. As a result, policy changes are primarily focus on corrections to known flaws rather than systemic reforms that enable sustainability long-term.
Short-term opportunities for healthcare investors benefit from the dysfunction. Winners in the industry leverage regs and rules that favor specialty care, consolidation, cost+ business models and profit maximization. Non-profit status protects favorable tax treatment at local, state and federal levels while day to day operations is indistinguishable from investor-owned competitors.
In 2009 in preparation for the White House Office of Health Reform Affordable Care Act deliberations with industry groups, I examined the structures, financing and clinical results of health systems in developed economies (OECD) of the world. Each was unique, but all operated at lower cost than the U.S. and all produced population-based clinical results that rivaled the U.S. Of the 12 I studied closest, the U.S, ranked in the bottom 3 on almost every measure except one: cost.
No two countries are alike like no two states are alike, but three structural elements were apparent in every system that outperformed the U.S.:
Primary and Preventive Health Gatekeeping: Developed systems integrate public health (social determinants) with physical and mental health, nutrition, prophylactic dentistry and restrictive formularies. They enable primary care for all, and facilitate access to specialty services through gatekeeping for the substantial majority of citizens.
Clinical standardization based on evidence: Every system of the world that outperforms the U.S. operates an independent NGO whose purpose is to monitor science and align diagnostics and therapeutics with what is proven to work. As AI-enabled clinical directives become mainstream tools in the U.S. system, adherence to what works best in what order (step therapies) will enable reduction in unnecessary care and engagement of individuals in self-care.
Global budgets: Remarkably, countries that out-perform the U.S. set national budgets for their healthcare programs and ration care toward system-wide priorities. They spend 8-12% of the country’s total GDP (vs. 18% in the U.S.) and appropriate more resources to primary and public health and less to acute services proportionately.
The conundrum for Milbank Fellows is the obvious: big, structural changes like these require federal involvement. They’re common sense. They’re not about bad people; they’re about structural flaws in the status quo that need fixing.
It will require a thoughtful, national plan to transform the U.S. system. States can be the stimulus for change, especially through interstate initiatives and knowledge-sharing akin to the Milbank Fellows Program.
Ultimately, it will require a federal Manhattan Project that subordinates the proprietary wishes of the industry special interests and political gamesmanship by partisans to achieve a system that’s sustainable, effective, efficient and operates with and for the people served.
States are the frontline for system reform in U.S. healthcare.
Last week was business as usual for the U.S. health system as other events grabbed the lion’s share of media attention:
Healthcare affordability and fraud were frequent mentions as GOP candidates railed against socialized medicine and industry’s lack of competition at the 2-day ‘Trumpalooza’ event in Dallas.
An apocalyptic prediction released on X by Evan Hubinger, a former Anthropic alignment lead, that ‘there’s a 10% chance that RSI (recursive self-improvement) AI could kill all humans in the next decade’ prompted social media frenzy and calls for AI regulation.
Wars in Iran and Ukraine continued.
The Jewish High Holy Days began with celebrations of Rosh Hashanah Friday just after 9-11 commemorations concluded across the land.
And the August CPI report from the Bureau of Labor Statistics showed prices elevated as the Iran war’s energy shock spiked an inflation and prompted concern the Fed might raise interest rates at its meeting this week.
With the exception of continued commentary about the Lindsay Clancy’s mistrial and post-partum psychosis defense, the healthcare system was virtually unscathed last week. For many in healthcare, ‘out of sight, out of mind’ is OK. It allows the system to operate without distraction from unwelcome criticism—disdain for media coverage has long been the preferred modus operandi in healthcare, preferring instead its own PR, ads and behind the scenes advocacy to keep things in order to its liking. It isn’t working.
Reality:The U.S. healthcare industry is not the crown jewel of our national pride. At the opening ceremony of the 2012 Olympic Games in London, the Danny Boyle-produced tribute to the National Health Service opened the games. A similar sentiment about the U.S. system is unimaginable. In its place, a dark cloud hovers above U.S. healthcare today. It is the industry’s biggest threat. The eminent cloud burst will wrack havoc on every provider, every investor, every user and every taxpayer in the U.S. unless preparedness is taken seriously.
It did not form overnight: it’s been building for 30 years but it darker and more threatening today than ever before. Here’s why:
Systemic arrogance: For decades, Americans have been told our health system is the envy of the world. We’ve embraced the industry hubris—the best doctors, the best hospitals. the newest drugs, the latest technology and most modern facilities and so on. But through these decades, costs have soared while population health and longevity have declined. Better ways to diagnose, treat, and deliver services are confined to privately-funded organizers whose shareholders see financial upside, while the less lucrative needs are left to public programs and do-gooders to bootstrap. Benign neglect for educating the U.S. population about how the health system works, how it’s organized and financed, how to use it is is the system’s original sin. It was designed so that dependence on the system via doctors, insurance, hospitals and drug companies was its foundational presumption. Evidence shows done right; it works. But it hasn’t. It declares its exceptionalism while hiding its business practices to avoid scrutiny. It rejects self-care deeming it only applicable to simple problems and presumes its concept of value always keeps ‘high quality’ distant from ‘low price’ in the public psyche. And it reinforces politics and policies that keep primary care, preventive health and social services for lower income and older populations subordinate to specialty services. Ironically, its workforce—25 million strong—that’s been warning of the cloud burst loudest. They think compensation for health executives is excessive, un-deserved and contributing to the storm.
Corporatization-driven wealth: The industry’s business practices have created massive wealth for some. 45 of the Fortune 500 companies is an investor-owned healthcare corporation. The industry’s executive class is among the highest paid compared to peers in other industries and the differential between the industry’s working class and its senior managers is the highest of all industries. Physicians have protected the profession’s distinction as the U.S. highest paid career even after accounting for the three-fold median gap between primary care and some surgical specialties. Polls show the majority of voters aren’t sure what ‘not-for-profit’ means or if it matters. Investing in healthcare is a safe bet, especially when overall market conditions are less welcoming. That’s the secret sauce that let’s the industry maintain prominence in wealth creation for risk takers, high compensation for its managers, executives and surgeons and carry grow in the aggregate faster than GDP and household wages. It’s a business, not a calling, for its management ranks, their advisors and private funders, because corporatization produces sizeable wealth for some.
Blame and Shame Advocacy: The major trade associations in healthcare have contributed to the cloud’s growing intensity. Protection of their members’ interests has takes precedent over the overall sustainability of the health system. That’s understandable: their Boards expect no less from their CEOs and teams. Thus, blame and shame advocacy is a priority over coalition building for systemic reform. But voters, employers and lawmakers increasingly recognize the obvious, no trade group in healthcare effectively represents the system as a whole. Short-term wins on proposed regulations, spending authorizations and policy shifts threatening to a specific tribe are their domain. It’s for others to fix the system even as the cloud gets darker.
Political campaigns obscure facts and oversimplify solutions to complex challenges like fixing the health system. Protecting the status quo in healthcare is what its insiders want and it’s why they’re on defense.
Paul
PS On 9/11/01, I was in Harry Jacobson’s conference room at Vanderbilt Medical Center discussing plans for our new Center for Integrative Health. The pictures of planes crashing into the World Trade Center, souls jumping to their deaths, fire-fighters running toward danger and dusty New Yorkers in zombi-like bewilderment are etched forever in my memory. It makes faith and family more meaningful and industry issues less. But in those days and after, our country seemed, if only for short while, united for a purpose. That spirit is needed for transformational change to the health system. It’s collapsing like the twin towers.
Last week, the American Hospital Association released a study by Kaufman Hall, its preferred data vendor, that took issue with methodologies used by critics of hospital consolidation:
“These findings suggest that a more comprehensive analysis of hospital M&A transactions, one that considers impacts on all patients served, broadens the focus to impacts beyond pricing, and considers the consequences if an M&A transaction is not permitted to proceed, would ensure not only competitive but also healthy hospital markets that can continue to provide the fullest possible range of services.”
The report discusses how hospital merger reviews should look beyond the potential impact on commercial insurance prices and consider what proposed transactions mean for all patients, particularly the nearly 60% of hospital patient days attributable to Medicare, Medicaid and Medicare Advantage beneficiaries whose payment rates are largely set by government programs.” Drawing on analyses of challenged and canceled transactions, the report also finds that hospitals seeking partners often serve more vulnerable communities and face greater financial pressures, and that when proposed deals do not move forward, struggling hospitals can experience significant financial deterioration that threatens services, workforce stability and access to care.”
Kaufman Hall added this disclaimer: “The findings contained in this document may contain predictions based on current data and historical trends. Any such predictions are subject to inherent risks and uncertainties. Past performance is not necessarily indicative of future results. Kaufman Hall accepts no responsibility for actual results or future events.
Also last week, a Health Affairs commentary “In 2026, States Are Leading On Health Care Affordability” noted that “Researchhasconsistentlyshown that hospital prices are the largest driver of commercial health care spending growth. Hospital markets are dominated by monopolies, whichenablehospitals to charge higher prices without improving quality or outcomes. State policymakers are increasingly looking for options to limit excessive hospital prices. Ourresearchshows that capping the highest, most egregious prices charged by hospitals can meaningfully improve health care affordability while still allowing hospitals to generate a healthy margin…
A key driver of rising health care prices is consolidation in health care systems, including through hospital acquisitions of physician practices. These acquisitions, which are a form of vertical integration, increase hospital prices by 3 to 5%. This can be attributed to greater bargaining power, more intensive coding practices, and hospitals charging facility fees at what were previously independent physician practices but are now treated as “hospital outpatient departments.” To address these issues, states are increasingly considering facility fee bans or “site-neutral” policies that would cap prices for certain routine hospital outpatient services that could be provided safely in an office setting.”
Both positions are defensible.
Not for profit and public hospitals are at a disadvantage in managing their finances because they’re obligated to serve entire communities without regard to local economies or population health. Investor-owned hospitals and insurance companies have fewer restrictions and can exit markets at will.
And almost every hospital is dependent on reimbursement from commercially insured patients to offset what is the widely-accepted calculus that Medicare and Medicaid reimbursement doesn’t cover the total cost of care provided enrollees. Thus, across the hospital industry, the playbook has been straightforward: to optimize hospital finances….
Maximize the attractiveness of hospital services that attract privately insured patients via contracting with private insurers.
Negotiate favorable rates with private insurers to enhance cost-shifting to Medicare and Medicaid by private plans.
Optimize leverage (scale) over insurers by consolidating hospitals, acquiring physician practices, expanding ancillary activities and deploying capital to potentially profitable ventures.
Advocate for state and federal laws that dissuade hospital price caps, 340B cuts, site-neutral payments, unreasonable price transparency requirements and limits on private-equity partnerships.
Assert that hospitals are efficient stewards of the public’s trust but disadvantaged by corporate insurers and drug companies that are allowed to enter and exit markets at will, price at “what the market will bear” and put shareholder profit above all else.
This scheme has worked for 40 years to enable hospitals to control at least 50% of total health spending: 31% for traditional hospital services, 12% of total physician services, and ventures, partnerships, ancillary services and post-acute services in addition. In the aggregate, hospitals are the most important cog in the healthcare wheel. They’re labor intense, capital intense, complicated businesses that enjoy public trust that’s slipping away, especially among the 25 million who work in the industry. Complicating matters, distinctions between rural and government safety net hospitals and highly profitable investor-owned and not-for-profit systems are attracting unwanted scrutiny from regulators and in media coverage.
While Kaufman Hall raises legitimate questions about current methodologies used by state and federal regulators to assess consolidation, it does not answer the bigger question: what role should hospitals play in the U.S. system as AI-derived clinical innovation proliferates, labor and supply costs accelerate and fewer people can afford services?
It’s not clear.
Should “hospital services” be redefined bifurcating facility-dependent inpatient services (Part A) and an expanded set of services inclusive of self-care provided in homes, schools, workplaces and virtually?
Should “community-benefits” and “charity care” be redefined so that methodologies are consistent and gaming to receive tax benefits eliminated?
Should hospital clinical performance be linked to improved outcomes and lower costs (affordability)?
Should local primary care and preventive health services (inclusive of nutrition, physical and mental health, prophylactic dentistry) be integrated with hospital services to improve population health and control demand for hospital services?
Should specialized tertiary and quaternary hospital programs be rationalized to optimize outcomes and improve efficiency?
Should consolidated hospital systems disclose administrative costs, functions and allocation methodologies publicly?
Should hospital boards be required to conduct scenario planning that’s comprehensive?
Should hospital administrative services and costs be standardized to facilitate caps on spending and management performance comparisons?
Should physician ownership of hospitals be enabled to increase competition?
And many others.
The American Hospital Association is right to be concerned about how regulators are addressing hospital consolidation and its impact on prices. And they’re right to challenge methodologies applied to questions about hospital prices and competition. But they fall short in offering a vision for the future of the health system that’s plausible, affordable and compelling. Rather, they offer a hospital-centric vision based on suspect assumptions and inadequate sensitivity to market trends not directly associated with traditional health services.
Every stakeholder in the health system—including hospitals and physicians—face heightened pressure to eliminate unnecessary utilization and costs due to willful or unknowing fraud. Just as insurer prior authorization practices have been frustrating to providers, unnecessary care is confounding to regulators and employers. The use of agentic AI tools to examine appropriateness of tests, procedures, medications and visits will exponentially change how “quality of care” is defined and regulated, and how its delivered. It’s a big deal everywhere, especially in Medicaid programs.
As lawmakers develop a national artificial intelligence framework, health insurers are already using automated decision-making tools to influence Americans’ access to care.
Barack Obama spent an hour last week telling House Minority Leader Hakeem Jeffries and a room of Democratic donors that artificial intelligence is “moving very fast in private hands” and that the party needs a real plan before it gets away from them entirely. He said a public framework on AI safety was urgently needed and that Democrats should make AI safety a “central agenda” in January when the next Congress is sworn in and when attention begins to shift to the 2028 elections.
House Democrats apparently are working on the kind of “framework” Obama called for. Jeffries launched the House Democratic Commission on AI and the Innovation Economy last December, and the commission reportedly has a policy framework due this fall. That’s good news – and a good start. Rules governing how AI is built, tested and deployed will inevitably shape how health insurers can use it. But that framework also has to account for what happens when AI moves into high-stakes, industry-specific decisions. But if it doesn’t mention health insurance by name, it will have missed the industry that is already furthest along in using AI to make decisions about who lives, who dies, and who pays — with almost no oversight at all.
THE BOTTOM LINE: Health insurers are already using algorithms to influence coverage decisions. Any federal AI framework should require meaningful human review, clinician override authority, transparency and patient appeal rights.
This isn’t a hypothetical harm sitting somewhere out on the horizon, the way a lot of the AI safety conversation still is. It’s happening in claims systems right now. And the company doing it loudest and proudest is none other than the biggest and most profitable health insurance conglomerate, UnitedHealth.
UnitedHealth told shareholders and Wall Street financial analysts when it announced first quarter profits in April that it’s spending $1.5 billion on AI in 2026 alone, with executives promising a “conservative” 2-to-1 return within 12 to 18 months. A third of that money is going into new AI software products the company hopes to sell to other health systems. The other two-thirds is going into what Optum Insight’s CEO called “signature end-to-end processes” — the internal machinery of how the company handles care.
Some of that machinery is aimed at speeding up prior authorization decisions, and the company points to real numbers: turnaround times cut, call volumes down, a pharmacy tool that reportedly shrank prescription approval from eight hours to under 30 seconds. That’s good if true and the whole story. Nobody is nostalgic for eight-hour prior auth waits.
But the same earnings calls that tout faster prior auth decisions (denials as well as approvals) are the ones that tout a lower medical loss ratio — the industry’s term for the share of premium dollars that actually goes to patient care. UnitedHealth’s second-quarter medical care ratio fell 270 basis points this year, and executives credited the AI investment directly for that unexpectedly big decline in medical spending. When a company brags to Wall Street that artificial intelligence helped it spend less on medical care, that is not a customer-service story. It’s a story about how the company is boosting profit margins, and patients are the input being optimized.
The algorithms already have a body count
UnitedHealth and Humana are both being sued right now over their use of an algorithm called nH Predict, which families allege was used to cut off coverage for elderly and disabled patients in extended care — sometimes overriding the judgment of the company’s own medical staff — based on a tool plaintiffs say gets it wrong up to 90% of the time on appeal. Cigna is fighting a parallel case over its PxDx system, which ProPublica found had denied more than 300,000 payment requests in a two-month span, with a company doctor spending an average of 1.2 seconds per claim.
Both cases, which are still working their way through the courts, rest on the same basic allegation: that a health plan let software stand in for the individualized medical review its own policies promised. A federal judge has already allowed the Cigna case to move forward on exactly that theory.
Elizabeth Nicholas, writing in Vanity Fair last week about her own fight with her insurer during breast cancer treatment, put the trajectory more starkly than I have. Her argument is that the industry has already trained the humans who run it to set their humanity aside and act like machines — which is exactly what will make humans so easy to replace. (Several big insurers, including Cigna where I used to work, have said they are laying off thousands of workers this year.) Soon, she writes, “there won’t even be executives left to email; only code,” carrying out profit directives with no capacity for hesitation or mercy. Her essay’s whole premise was that she still had a CEO’s name to put in an email she sent begging the insurer to reverse a denial of a life-saving treatment. Take the human off both ends of that exchange and there’s no one left to shame, sue, or vote out.
A handful of states aren’t waiting for Congress. Colorado now requires bias audits and guaranteed appeal rights for AI-driven coverage decisions. But even bias audits raise a bigger question of what exactly counts as bias when an insurer builds these tools? An algorithm can pass checks for discrimination and still be designed to advance the insurer’s financial interests, including reducing spending on medical care. And as insurers increasingly build their tools on general-purpose AI models, biases embedded in those underlying systems can carry into whatever gets built on top of them.
California and Texas have both moved to require that a licensed physician, not an algorithm alone, sign off on any denial based on medical necessity. That’s real progress — and it’s also proof of how far behind federal policy is. Coverage decisions shouldn’t depend on which state you happen to live in.
Jeffries has already put two members of his caucus in charge of a group that presumably will come up with recommendations on health care reform priorities. Alexandria Ocasio-Cortez of New York and Terri Sewell of Alabama are co-conveners of House Democrats’ Cost of Living Healthcare Working Group, tasked with building out the party’s affordability agenda on health care. So far, the public framing of that group has been about premiums, Medicaid cuts, and ACA tax credits. None of that is wrong. But if AI’s growing role in coverage denials isn’t part of what Ocasio-Cortez and Sewell put forward, the working group will have missed the fastest-moving cost driver in the field they were assigned to cover. They’re the two members with the standing and the mandate to put specific, concrete AI proposals on the table — not vague concern, but actual legislative language on human review requirements, transparency, and audit rights. That’s the natural home for this work, and it shouldn’t wait for the broader framework Jeffries is still finishing.
Every argument Obama made to Jeffries about why Democrats need an AI framework applies with more force, not less, to health insurance. He talked about job displacement from AI — insurers are already using it to displace human medical judgment. He talked about AI moving fast in private hands — seven for-profit companies control most of the American health insurance market, and they answer to shareholders, not patients. He said he didn’t want to be a “doomer,” and neither am I. AI genuinely could help identify fraud, speed up legitimate approvals, and cut the paperwork that eats a doctor’s week. Nobody serious is arguing it should be banned from health care.
The argument is narrower than that: When an algorithm is making or heavily influencing a decision about whether a person gets the care their doctor ordered, someone accountable has to be able to explain why, a licensed clinician has to be able to overrule it, and the patient has to have a real path to appeal. Right now, in most of the country, none of that is guaranteed.
Any Democratic AI framework that talks about jobs, misinformation, and existential safety risk while staying silent on the algorithms already deciding who gets a breast cancer treatment, a hip replacement or a nursing home stay isn’t a serious framework. It’s an incomplete one. Jeffries has the chance to make sure it isn’t — and given that he reportedly brought up the resignation letter of an Anthropic employee warning about the dangers of AI development in his conversation with Obama, he’s clearly already thinking about where AI could do real damage. Health insurance should be at the top of that list, not an afterthought to it.
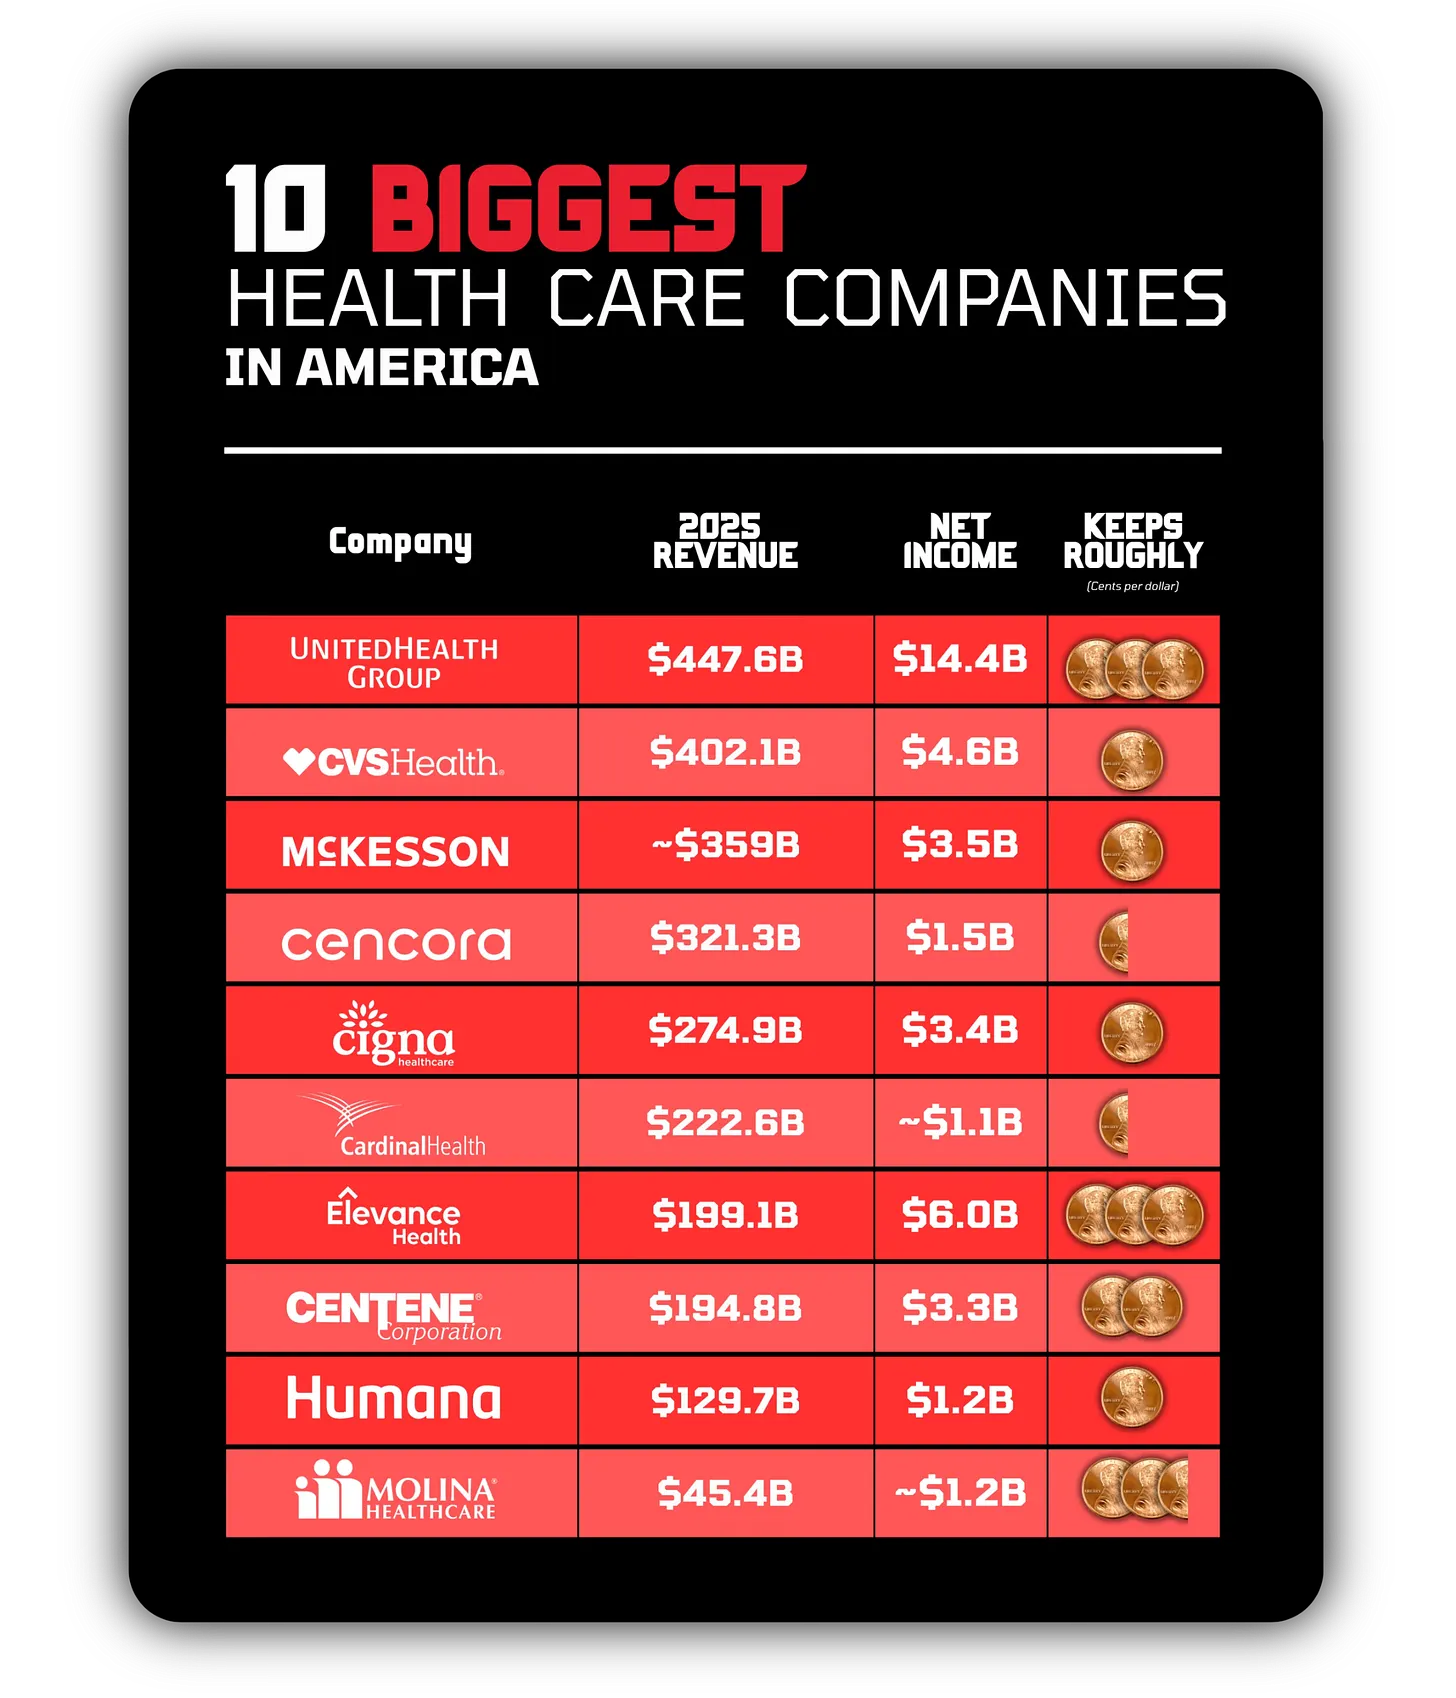
It started as a simple question. Who are the biggest health care companies in the United States?
If you rank the ten largest health care companies in America by revenue, you will not find a single hospital system or drugmaker. Not Pfizer, not Eli Lilly, not the Mayo Clinic or HCA. Every company in the top ten is a middleman, and together they take in about $2.6 trillion a year.
Above is a list showing how much of every dollar of revenue each company keeps as net income. Then read about what these companies actually do.
Three of these companies are insurers that swallowed pharmacy benefit managers:UnitedHealth owns Optum Rx; CVS owns Caremark and Aetna; and Cigna owns Express Scripts. Three are drug distributors that move pills from the factory to the pharmacy and touch almost none of them. Three more are built on Medicare and Medicaid managed care. Every one of them sits between the people who deliver care and the money that pays for it.
The sheer size of these companies is another distinctly American feature of the system. On the 2026 Fortune Global 500, UnitedHealth ranks fourth in the world, ahead of Apple; McKesson is seventh; CVS is ninth; and Cigna, where I worked for 15 years, ranks 14th in the U.S. and 21st in the world. Every health care company near the top of the global list is an American intermediary in one way or another. There is no foreign health care business of any nature that comes close.
The closest thing another country has to one of our giants is Allianz, in Germany. Allianz is the largest insurance company in Europe. But it is a general insurer built on property, life and asset management, and health is a minor line. Even at home, Allianz is only the third largest health insurer in Germany. There, roughly nine in ten people are covered by nonprofit sickness funds, which are barred by law from operating as for profit and must send any surplus in funds back into the system.
None of these countries built the kind of for-profit middleman layer that exists in the U.S., where some of those companies have grown into the largest corporations in the world. Pharmacy benefit managers are also a uniquely American creation, which helps explain why that entire category of health care giant does not exist elsewhere.
What the middleman layer costs
The United States spent $5.3 trillion on health care in 2024. That was the first year the country ever crossed $5 trillion, and it is the most recent year with actual figures rather than projections. (The Centers for Medicare and Medicaid Services estimates total U.S. health spending will reach $6 trillion this year.)
A large share of that money never reaches care and instead is consumed by the U.S. health care system’s complicated administration and payment systems.
In 2021, the United States spent $925 per person on health administration, meaning the overhead of insurers and government programs. The average wealthy country spent $245. That gap of $680 a person accounts for about 12% of the entire difference between what America spends on health and what its peers spend. As a share of the total, administration eats about 7.6% of U.S. health spending against 3.8% across comparable nations. We devote twice the share of every health dollar to running our absurd machinery.
The $925 figure counts insurer and government overhead and does not include what hospitals and doctors spend on billing, coding and prior authorization just to get paid. When those costs are included, estimates put total administrative spending between 15% and 25% of all U.S. health care spending — or, based on 2024 spending, roughly $800 billion to $1.3 trillion a year.
The countries with the leanest administrative spending tend to be those (you guessed it!) with the fewest middlemen.
Middlemen spend to keep the status quo
I know how a system this profitable defends itself because I used to help do it. Back at my old gig at Cigna, my team and I wrote talking points for lobbyists to use with lawmakers, and we doled out campaign cash to candidates we liked.
The health sector spent $743.9 million lobbying the federal government in 2024, more than any other sector of the economy and the only one to clear $700 million. UnitedHealth alone spent $16.6 million in the 2024 election cycle. The insurance industry’s trade group, AHIP, and the biggest insurance conglomerates pour tens of millions more into the same effort year after year, and the pharmacy benefit managers keep their own operation running through another insurance industry funded trade group called the Pharmaceutical Care Management Association (PCMA), whose spending has roughly doubled since 2022.
That spending helps protect Medicare Advantage payments, fight efforts to rein in pharmacy benefit managers and oppose proposals that would move the country toward universal coverage. Compared with the $70 billion in combined profit of the seven biggest for-profit insurers last year, the lobbying bill is relatively small.
The price of “choice”
The industry says all of this is the price of “choice,” which they want folks to believe is sacred. It is the argument insurers and their allies reach for every time Congress looks at a single-payer bill or public option or any other approach, for that matter, that could move us closer to reining in the worst abuses of the industry.
Americans say they want to choose their own doctor and their own hospital, but that is exactly the kind of choice the middleman system can take away through narrow networks and prior authorization. What the industry defends instead is the choice among insurers. And for most working people, even that choice is made by an employer. We pay hundreds of billions of dollars a year to run a marketplace of middlemen, and in return we get narrower networks and more denials than patients face in the countries that never built the marketplace at all.
Depending on the results of the next two election cycles, Congress will almost certainly debate how to restructure health care again, with the familiar goals of lowering costs, expanding coverage and improving care. But any serious attempt to do that will have to confront the enormous middleman industry the current system has created and allowed to flourish.
After UnitedHealthcare denied his surgery, Donald Grant took his 11-page legal and medical appeal straight to UnitedHealth Group CEO Stephen Hemsley — and got his request approved.
Last month, Elizabeth Nicholas wrote in Vanity Fair about being diagnosed with breast cancer at 36 and then watching her insurer refuse to pay for a recommended course of chemotherapy. Her oncologist delivered the news. Nicholas’s response was to email the company’s CEO directly, laying out her case in plain, human terms rather than routing it through the black box of the standard appeals process.
I mentioned her essay briefly in the piece we published recently on artificial intelligence and health insurance denials. Since then, another case landed in my inbox that is worth looking at alongside hers. This patient fought back with an extraordinarily detailed appeal that shows just how sophisticated patients are becoming when an insurer denies critically important care.
You have to write a letter built to break through the corporate bureaucracy
On September 12, I was copied on an email from Donald E. Grant Jr., a 49-year-old industrial-organizational psychologist in Valley Village, California. It was addressed to UnitedHealth Group CEO Stephen Hemsley and copied to more than a dozen other people, including UnitedHealthcare executives, Optum’s chief medical officer, a California state senator, the lieutenant governor’s office, Attorney General Rob Bonta, and two health care reporters. Attached was Grant’s formal appeal, which runs eleven pages and cites the Code of Federal Regulations, ERISA case law and Department of Labor guidance, chapter and verse.
Grant’s situation was — and still is— serious and getting worse. A fall in August 2025 caused the sudden loss of sensation in his legs. Workup found severe congenital cervical stenosis. An in-network surgeon performed a two-level artificial disc replacement in December 2025, but it failed to adequately decompress his spinal cord. By March 2026, imaging showed new myelomalacia — scarring inside the cord itself that wasn’t there before surgery — spreading across four vertebral levels. He now has bilateral foot drop, no sensation in his lower legs, a hand going numb and weak, and new bowel and bladder problems. His surgeon, Dr. Hyun Bae at Cedars-Sinai, is a leading authority on multilevel cervical arthroplasty and its revision — one of the physicians who ran the original FDA trials for the very device implanted in Grant’s neck.
UnitedHealthcare has no in-network surgeon with comparable qualifications, and Grant argues none can safely operate within the window his deteriorating spinal cord allows. The surgery is scheduled for October 14. Everything but the surgeon himself — the hospital, the anesthesia team — is in network. He’s asking UnitedHealthcare to cover Dr. Bae at the in-network rate through a network exception.
What sets Grant’s letter apart isn’t the medicine. It’s the legal architecture around it, and that’s because he had help from Claimable, the AI-assisted appeal service founded by Warris Bokhari. The letter invokes the federal urgent-care claim regulation and its 72-hour decision clock. It demands that the reviewing physician be named, board-certified in the relevant specialty, and walled off from whoever issued the original denial — citing the exact subsection of the claims-procedure regulation that requires it. It requests the complete claim file and designated record set under both ERISA and HIPAA. It puts UnitedHealthcare on notice to preserve every internal record connected to the claim. And it names, as a co-recipient with real leverage, David Ellison — chairman and CEO of Paramount Skydance, the company whose self-funded plan is actually paying these claims, and therefore the ERISA plan administrator and fiduciary who can lean on UnitedHealthcare from above.
There’s also a section I want to draw special attention to, because it’s the clearest expression I’ve seen from a patient of a concern I’ve been raising for months: Grant explicitly demands that no algorithm, predictive model, or automated tool be used at any stage of deciding his appeal, and he wants written confirmation of that in the response. He backs the demand with a tight legal and factual history — ProPublica’s reporting on Cigna’s PXDX system, the nH Predict litigation against UnitedHealth, the Senate Permanent Subcommittee on Investigations’ 2024 report on Medicare Advantage denials, and California’s Physicians Make Decisions Act. His argument is that a federal regulation most patients have never heard of already requires what California’s algorithm-ban requires: a qualified human being in the relevant specialty, not a model trained on aggregate outcomes, deciding whether his particular spinal cord can wait.
The strategy worked. Grant told me this week that UnitedHealthcare has now approved both Dr. Bae and the procedure at the in-network rate, clearing the way for the October 14 surgery. And Grant was careful to give the insurer credit for how it handled the process once his appeal was underway. He said UnitedHealthcare employees were responsive and patient in helping him understand the approval and what he would owe out-of-pocket at the in-network rate.
“I realize this is not always the case,” Grant wrote, “but this time it worked out well.”
That’s an important part of this story too. The point isn’t that every appeal ends badly, or that an insurer can’t respond appropriately when a patient pushes back. Grant got the result he was asking for. But it took an eleven-page appeal, detailed medical and legal arguments, and an email that put executives, public officials and reporters on notice to get there. His case shows that patients can successfully challenge these decisions. It also raises a harder question: How many patients would have known how to mount the same fight?
The strategy patients weren’t supposed to have
I’ve been telling patients for years to do exactly what Nicholas and Grant did: If a denial threatens your life or your ability to function, don’t just work the internal appeals queue quietly. Go to the top. Email the CEO. Loop in the plan sponsor if you’re on an employer plan. Contact your state insurance commissioner or attorney general. Call your legislators. Talk to a reporter. Be the squeaky wheel. Insurers built the appeals system to be slow, opaque, and easy to lose interest in. They know that discourages patients to give up. Do not give up or even go through the normal bureaucratic nonsense if time is of the essence.
The nation’s largest health insurer says it is eliminating prior authorization requirements for 1,700 medical codes. Look under the hood and the announcement is considerably less impressive.
Nicholas didn’t have Grant’s legal scaffolding. She had her own voice and the reach of a national magazine. Grant has a documented clinical emergency, a sympathetic and well-known plan sponsor CEO, a growing list of public officials on notice, and — importantly — professional help translating his situation into the language ERISA regulators and general counsel offices actually respond to.
There’s a less comfortable layer here too. Grant had to do all of this — hire or enlist expert help, cite the C.F.R., demand a litigation hold on internal records — just to get the process ERISA already promises every plan member by law: a full and fair review, decided by someone qualified, free of algorithmic shortcuts. Most people denied a surgery their doctor says they need don’t know these regulations exist, let alone have the resources or stamina to invoke them. That gap is the real story underneath both of these cases. The system shouldn’t require this level of sophistication to work as designed. It just doesn’t work reliably without it.
II’ll be watching to see whether Grant actually gets his laminoplasty on October 14 with Dr. Bae in the room.
Congress wants employers and unions to finally see where their health care dollars go. A last-minute change could let insurers and PBMs keep some of the most important receipts hidden.
For years, employers and other plan sponsors, such as unions, have been fighting to get the one thing they need to better control their own health care spending: the claims data their insurers/third-party administrators and pharmacy benefit managers generate on their behalf but routinely refuse to hand over. A bill working its way through Congress –the Patients Deserve Price Tags Act (PDPTA) – would finally force that data into the open. The bill is also a real test case for a simple idea: that transparency itself can help drive down unnecessary spending, lower overall health care costs, benefit patients, and strip middlemen of the leverage they use to pocket money they were never entitled to.
The fiscal case backs this up. A recent independent analysis by economists Daniel Arnold and Christopher Whaley estimates the bill would generate roughly $122 billion in additional federal revenue over 2026–2035, with a plausible range of $25 billion to $270 billion, by driving down employer plan spending in ways that eventually show up as higher taxable wages. That’s the standard logic the Congressional Budget Office uses for scoring changes in employer-sponsored insurance. Even at the low end of that wide range, it’s a meaningful number.
First, because this is an area where there is a lot of confusion, here’s some information and context. A plan sponsor, as noted above, is typically an employer or union that offers subsidized health benefits to workers and their families. In that role, the employers and unions are the actual “insurers.” They hire companies we typically call insurers (like Cigna, Aetna, UnitedHealthcare or a Blue Cross plan) to administer those health benefits. In that role, those companies are third-party administrators (TPAs) who use the employers’ and unions’ – and workers’ – money to pay claims, create provider networks, serve as gatekeepers to care and handle other administrative responsibilities, like approving and denying coverage for care (called utilization management or prior authorization). Employers and unions pay those TPAs huge fees to do that work.
So huge, in fact, that at Cigna, where I used to work, approximately 80% or more of revenues from the company’s U.S. commercial health insurance operations came from administrative-services-only arrangements. Even though workers have insurance cards in their wallets with the logo of a company like Cigna or Aetna, which we think of as an insurer, the workers’ employer or union is, in fact, the insurer.
Section 7 of the bill gives employer and union health plans the right to access their own complete claims data — from the insurers, third-party administrators (TPAs), and pharmacy benefit managers (PBMs) that plan sponsors hire to handle those administrative duties, and the plan sponsors give the TPAs access to the money in the bank accounts the plan sponsors set up to cover the cost of their workers’ health care benefits. Those TPAs and PBMs (which are typically owned by the TPAs) are the middlemen that are involved in every dollar a plan sponsor spends. They set network prices, retain rebates from pharmaceutical companies (kickbacks, in plainer, more precise language) and generally control the only detailed record of where a plan sponsor’s money actually went. When employers and unions can’t see that record – and in today’s world they usually do not, even though we’re talking about their own money – they can’t audit it, and audits are the only way plan sponsors ever catch things like phantom billing, upcoding, duplicate charges or the disparities in denials and prior-authorization patterns that Congress has spent years scrutinizing.
Section 7’s whole purpose is to let the people paying the bills finally be able to trace where their money goes.
The new language in the Senate bill just before it was voted out of the HELP Committee says that, “A covered service provider would not have to disclose data that could ‘reasonably identify’ a participant or beneficiary, as defined under HIPAA’s individually identifiable health information standard.”
On its face, that sounds like ordinary patient-privacy boilerplate, but it is much more than that. HIPAA already has a detailed, well-established process for exactly this situation — dealing with a health plan’s right to receive identifiable claims data for plan administration. That process encompasses two well-defined de-identification methods – the 18-identifier “Safe Harbor” standard, and “expert determination” – for when identifiability genuinely needs to be limited.
The newly inserted language doesn’t invoke either of those. To the delight of my former employers in the health insurance business, it creates a new, undefined standard — “could reasonably identify” — with no cross-reference to how HIPAA actually determines that, and no appeals process if a plan sponsor disagrees. And it hands the decision to the very parties Section 7 exists to hold accountable. If that language stays in the bill, the insurer, TPA, or PBM would get to decide, on its own, what counts as identifiable enough to withhold from plan sponsors. Keep in mind that the TPAs and PBMs, which are constantly trying to maximize their revenues, by their very nature have access to identifiable data on every insured American.
De-identification of that data before it is shared with plan sponsors doesn’t just strip names and Social Security numbers. Done under a vague, self-certified standard, it can also strip exact service dates, zip codes, and the member-level identifiers that let an employer or union sponsored health plan connect one claim to another. Those are precisely the fields that let a plan sponsor piece together a pattern.
Here’s a hypothetical example of how PDPTA would enable employers to get a better handle on how their TPAs/PBMs are using their money to pay claims – and how the inserted language would stymie their ability to do so:
Suppose an employer plan noticed it had been billed for six services in a single week for one patient from one provider. Because it could see the clustered service dates, the plan could investigate, discover the services had never been performed, report the provider for false billing, and recover the money. But strip out exact dates — which the new language would allow — and that same claim would just look like six services spread out over time. The fraud would likely go uncaught, and the health plan (which means, ultimately, workers’ wages and other compensation) would eat the loss.
The same missing fields also hide denial-rate disparities and turnaround-time patterns — the exact behavior lawmakers keep asking about in prior-authorization hearings. And they would block plan sponsors from recovering overcharges they can no longer prove occurred.
Here’s something else to keep in mind: PBMs and insurers already sell claims-level data to drug manufacturers, data brokers, and analytics firms for their own commercial gain. The inserted language would let them keep doing that while blocking the employer or union that actually paid for the data from ever seeing it themselves.
Some of the lawmakers who care most about getting this right have raised a concern that deserves to be taken seriously, hence the newly added language. They don’t want employers gaining routine access to their own employees’ identifiable medical records. That’s not a paranoid fear. An employer that can see an employee receiving mental health treatment, fertility care or substance-use treatment has information that, mishandled, could influence a promotion, a layoff list or a manager’s private judgment about someone, even where no law technically permits that use.
That concern is exactly why HIPAA built a specific structure for it, back when Congress first grappled with this same problem in the 1990s. Think of it as a locked door inside an employer’s own building. When a company sponsors a health plan for its workers, HIPAA doesn’t let that identifiable medical data just flow into the regular HR filing system where a manager could stumble across it. Instead, the law requires the employer to designate a small, specific group of people – usually benefits staff, auditors or a third party working on the plan’s behalf – who are allowed through that locked door to see identifiable claims data, but only to do plan-administration work like trying to ensure that claims are paid correctly by TPAs and PBMs and checking for fraud. Everyone else at the company – HR generalists, supervisors, anyone who could use the information in a hiring, firing or promotion decision – stays on the other side of the door. The employer has to sign a formal certification promising to keep that separation in place, and using the data for an employment decision is exactly the kind of violation HIPAA’s firewall exists to catch. And violating HIPAA can be very costly: fines of $50-$250,000 per offense and up to 10 years in jail. That is a very real disincentive to mishandle the data.
That’s the tool already built for the harm some lawmakers say they have concerns about. It doesn’t block identifiable data from ever reaching the plan; it controls who inside the plan gets to see it and what they’re allowed to do with it.
The Section 7 carve-out language inserted in the bill doesn’t touch that door at all. It does something completely different: It lets the TPA, PBM or insurer decide, on its own, that a given piece of data simply won’t go through the door in the first place – not to the walled-off auditors – not to anyone – no matter how carefully separated they are from HR. That’s not tightening the firewall that some lawmakers are worried about breaching. It’s blocking the room entirely, including the auditors it was built to let in.
Here’s what should trouble anyone who takes the privacy concern seriously: The same companies that would get to make that call are, separately, in the business of selling similar claims data to outside parties, including data brokers, drug manufacturers and marketing analytics firms, under HIPAA’s “de-identified” label. Privacy researchers have spent years documenting how easily that kind of de-identified data can be re-identified, especially once it’s cross-matched against other data sets a broker already holds. In other words, the industry treats “identifiable enough to protect from a plan’s own fiduciary auditors” as an easy bar to clear, while treating “de-identified enough to sell for profit” as an even easier one. That’s not privacy protection with a consistent standard. That’s a standard that moves depending on who’s asking and who profits.
If the goal is protecting employees from having their sensitive health information misused – and it should be – the fix is to reinforce the locked-door system Congress already built: stronger certification requirements, even more severe penalties if an employer ever uses plan data in an employment decision, and access limited strictly to the walled-off audit function. That protects workers without stripping Section 7 of its ability to catch fraud. A vague, vendor-administered “reasonably identify” standard doesn’t strengthen that door. It just lets the vendor decide who never gets a key.
The good news is that PDPTA is moving through Congress. On the Senate side, the HELP Committee approved it on a bipartisan basis in late July. The lead sponsors – Roger Marshall (R-Kansas) and John Hickenlooper (D-Colorado) – were joined by Senators Chuck Grassley and Joni Ernst of Iowa and Cynthia Lummis of Wyoming, all Republicans, and Democrats Tammy Baldwin of Wisconsin, Cory Booker of New Jersey, Elizabeth Warren of Massachusetts and John Fetterman of Pennsylvania. That’s the kind of bipartisan coalition that rarely comes together on health care and even more rarely survives a full committee markup intact.
House versions of the Senate bill also have strong bipartisan support and are working their way through three committees (Energy and Commerce, Education and Workforce, and Ways and Means) — reflecting how many parts of federal law it touches.
With a bill this far along, this close to bipartisan agreement, and this close to the end of the current Congress, the pressure to move fast is real. That’s exactly why the Section 7 carve-out needs fixing now, while it’s still open for amendment, rather than after passage when it would take an entirely new bill to undo it. That clearly is not the intention of the bill’s many sponsors.
The transparency goal of the bill is sound, the projected fiscal upside is real even under conservative assumptions, and Section 7’s data-access right is exactly the kind of tool plan sponsors need.
Companies like the ones I used to work for undoubtedly were happy to see the new language inserted in the bill, and I’m hearing evidence that they’re working behind the scenes to keep it in the bill by creating the false narrative that employers and unions want this data primarily to learn more about their workers’ health. That simply doesn’t hold up. For one thing, as I’ve explained, HIPAA is clear on how employers can use the data and what happens if they violate existing law. But it is important to keep in mind that federal law also now makes it abundantly clear that plan sponsors are fiduciaries of workers’ money. They can be sued – and some are being sued – for not fulfilling their fiduciary responsibility under the law. And plan sponsors need data they all too often cannot get from their TPAs and PBMs to meet the law’s requirements.
I’ve written before about how often plan sponsors that sue their own TPAs and PBMs to get the data they need in order to have any assurance that they are not being double billed or defrauded in other ways get bogged down for the simple reason that they can’t get at their own claims data in a form they can actually audit. Section 7, done right, is a legislative fix for that problem. But “done right” requires closing this loophole before the bill moves further. At minimum, that means:
Cross-referencing HIPAA’s existing Safe Harbor or expert-determination standards instead of inventing a new, undefined one;
Requiring the covered entity to justify any withheld field against that established standard, rather than self-certifying; and
Giving plans a way to challenge a withholding decision, instead of leaving the provider as sole judge.
One sentence, fixed, would let PDPTA keep its promise. Left as recently changed, it lets the middlemen write themselves an exemption from the very oversight the bill is meant to create.
As voters sour on private insurers and health care reform gains political momentum, decades-old warnings about “choice,” “wait times” and “slippery slopes” are resurfacing.
If you want a sense of where the health care debate is headed as we enter the final stretch before the midterm elections, take a look at what has been published over just the past week.
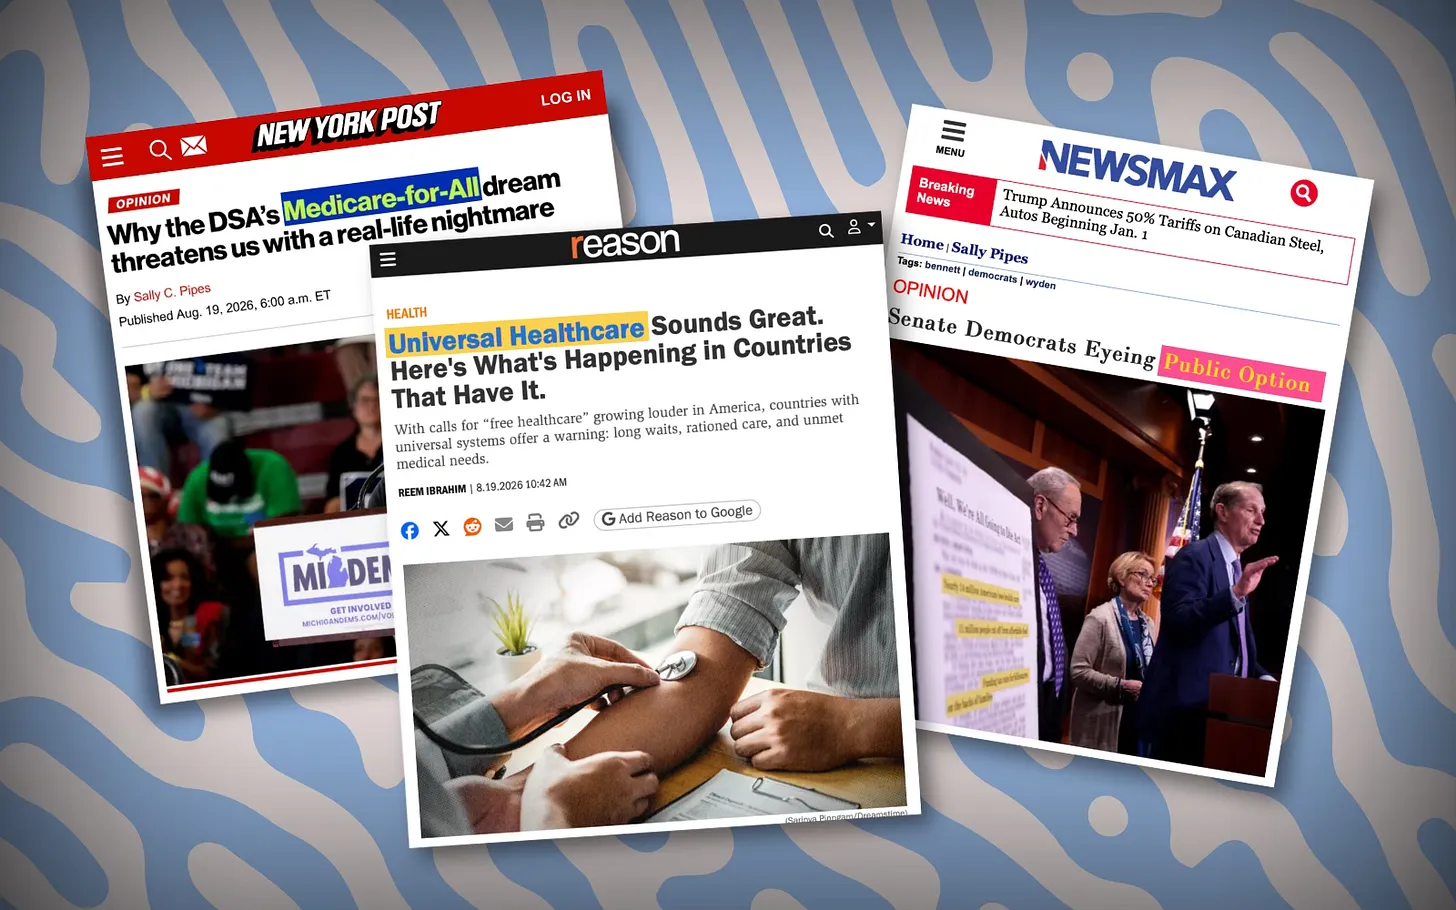
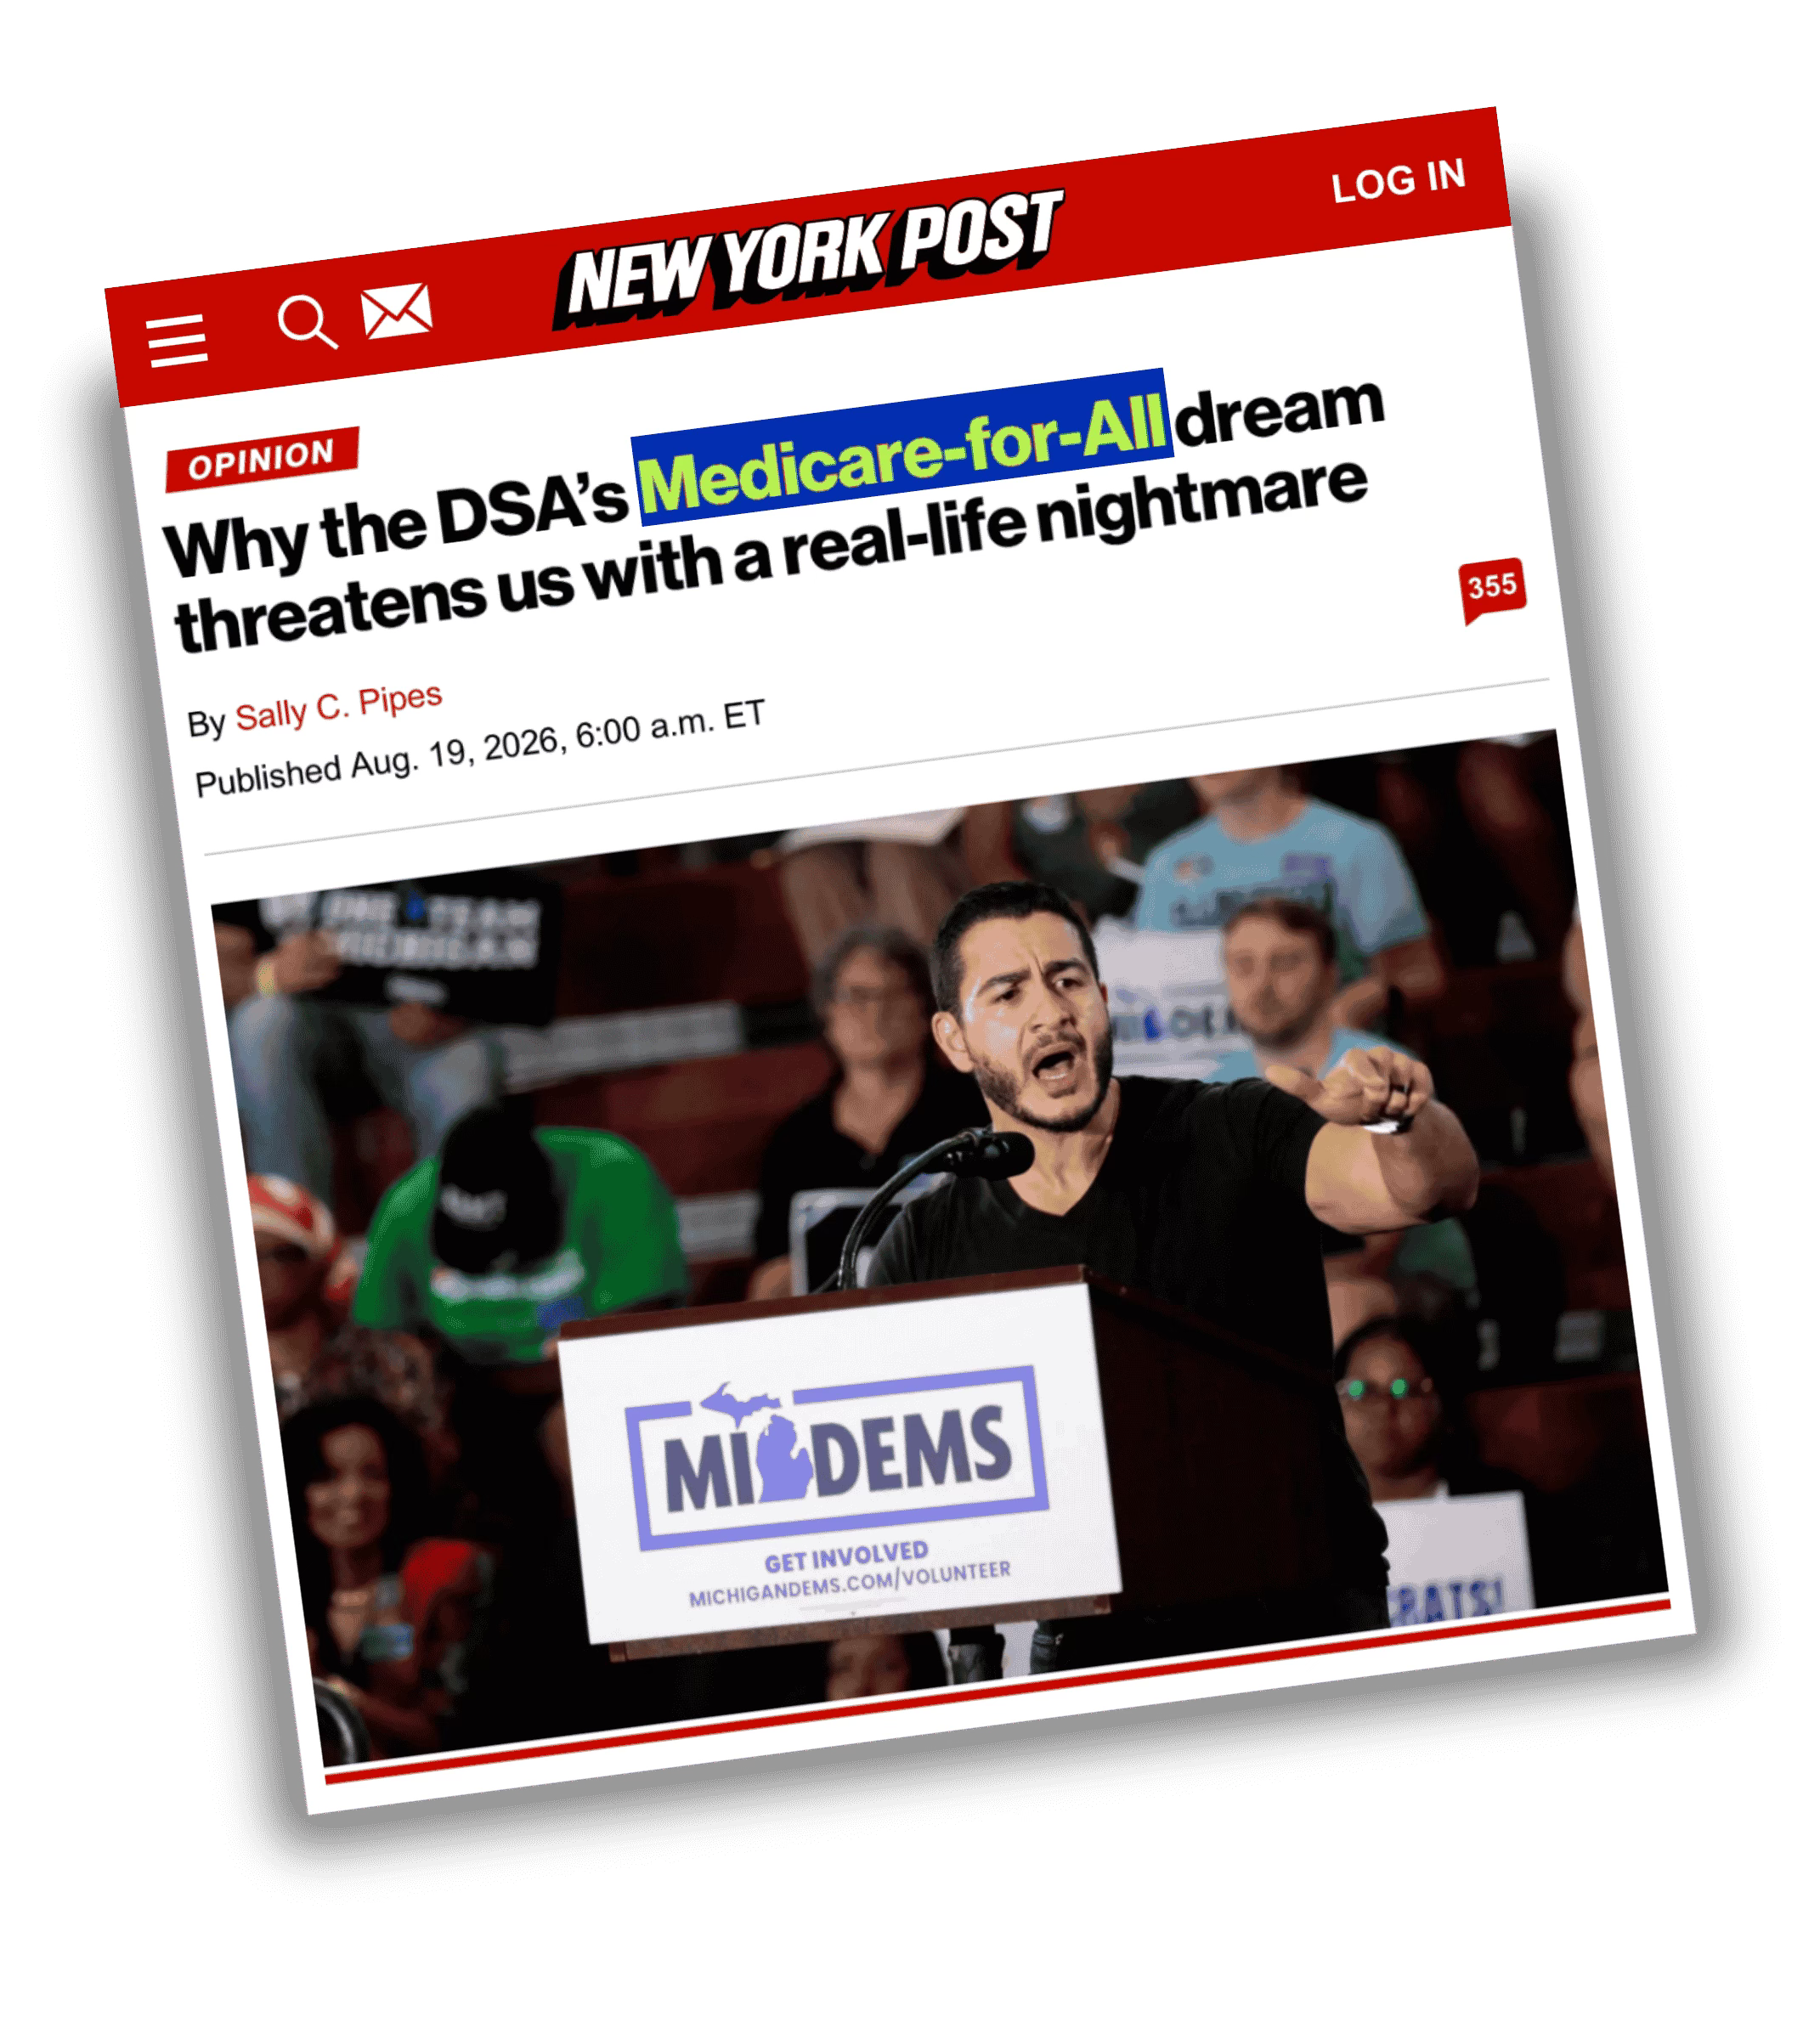
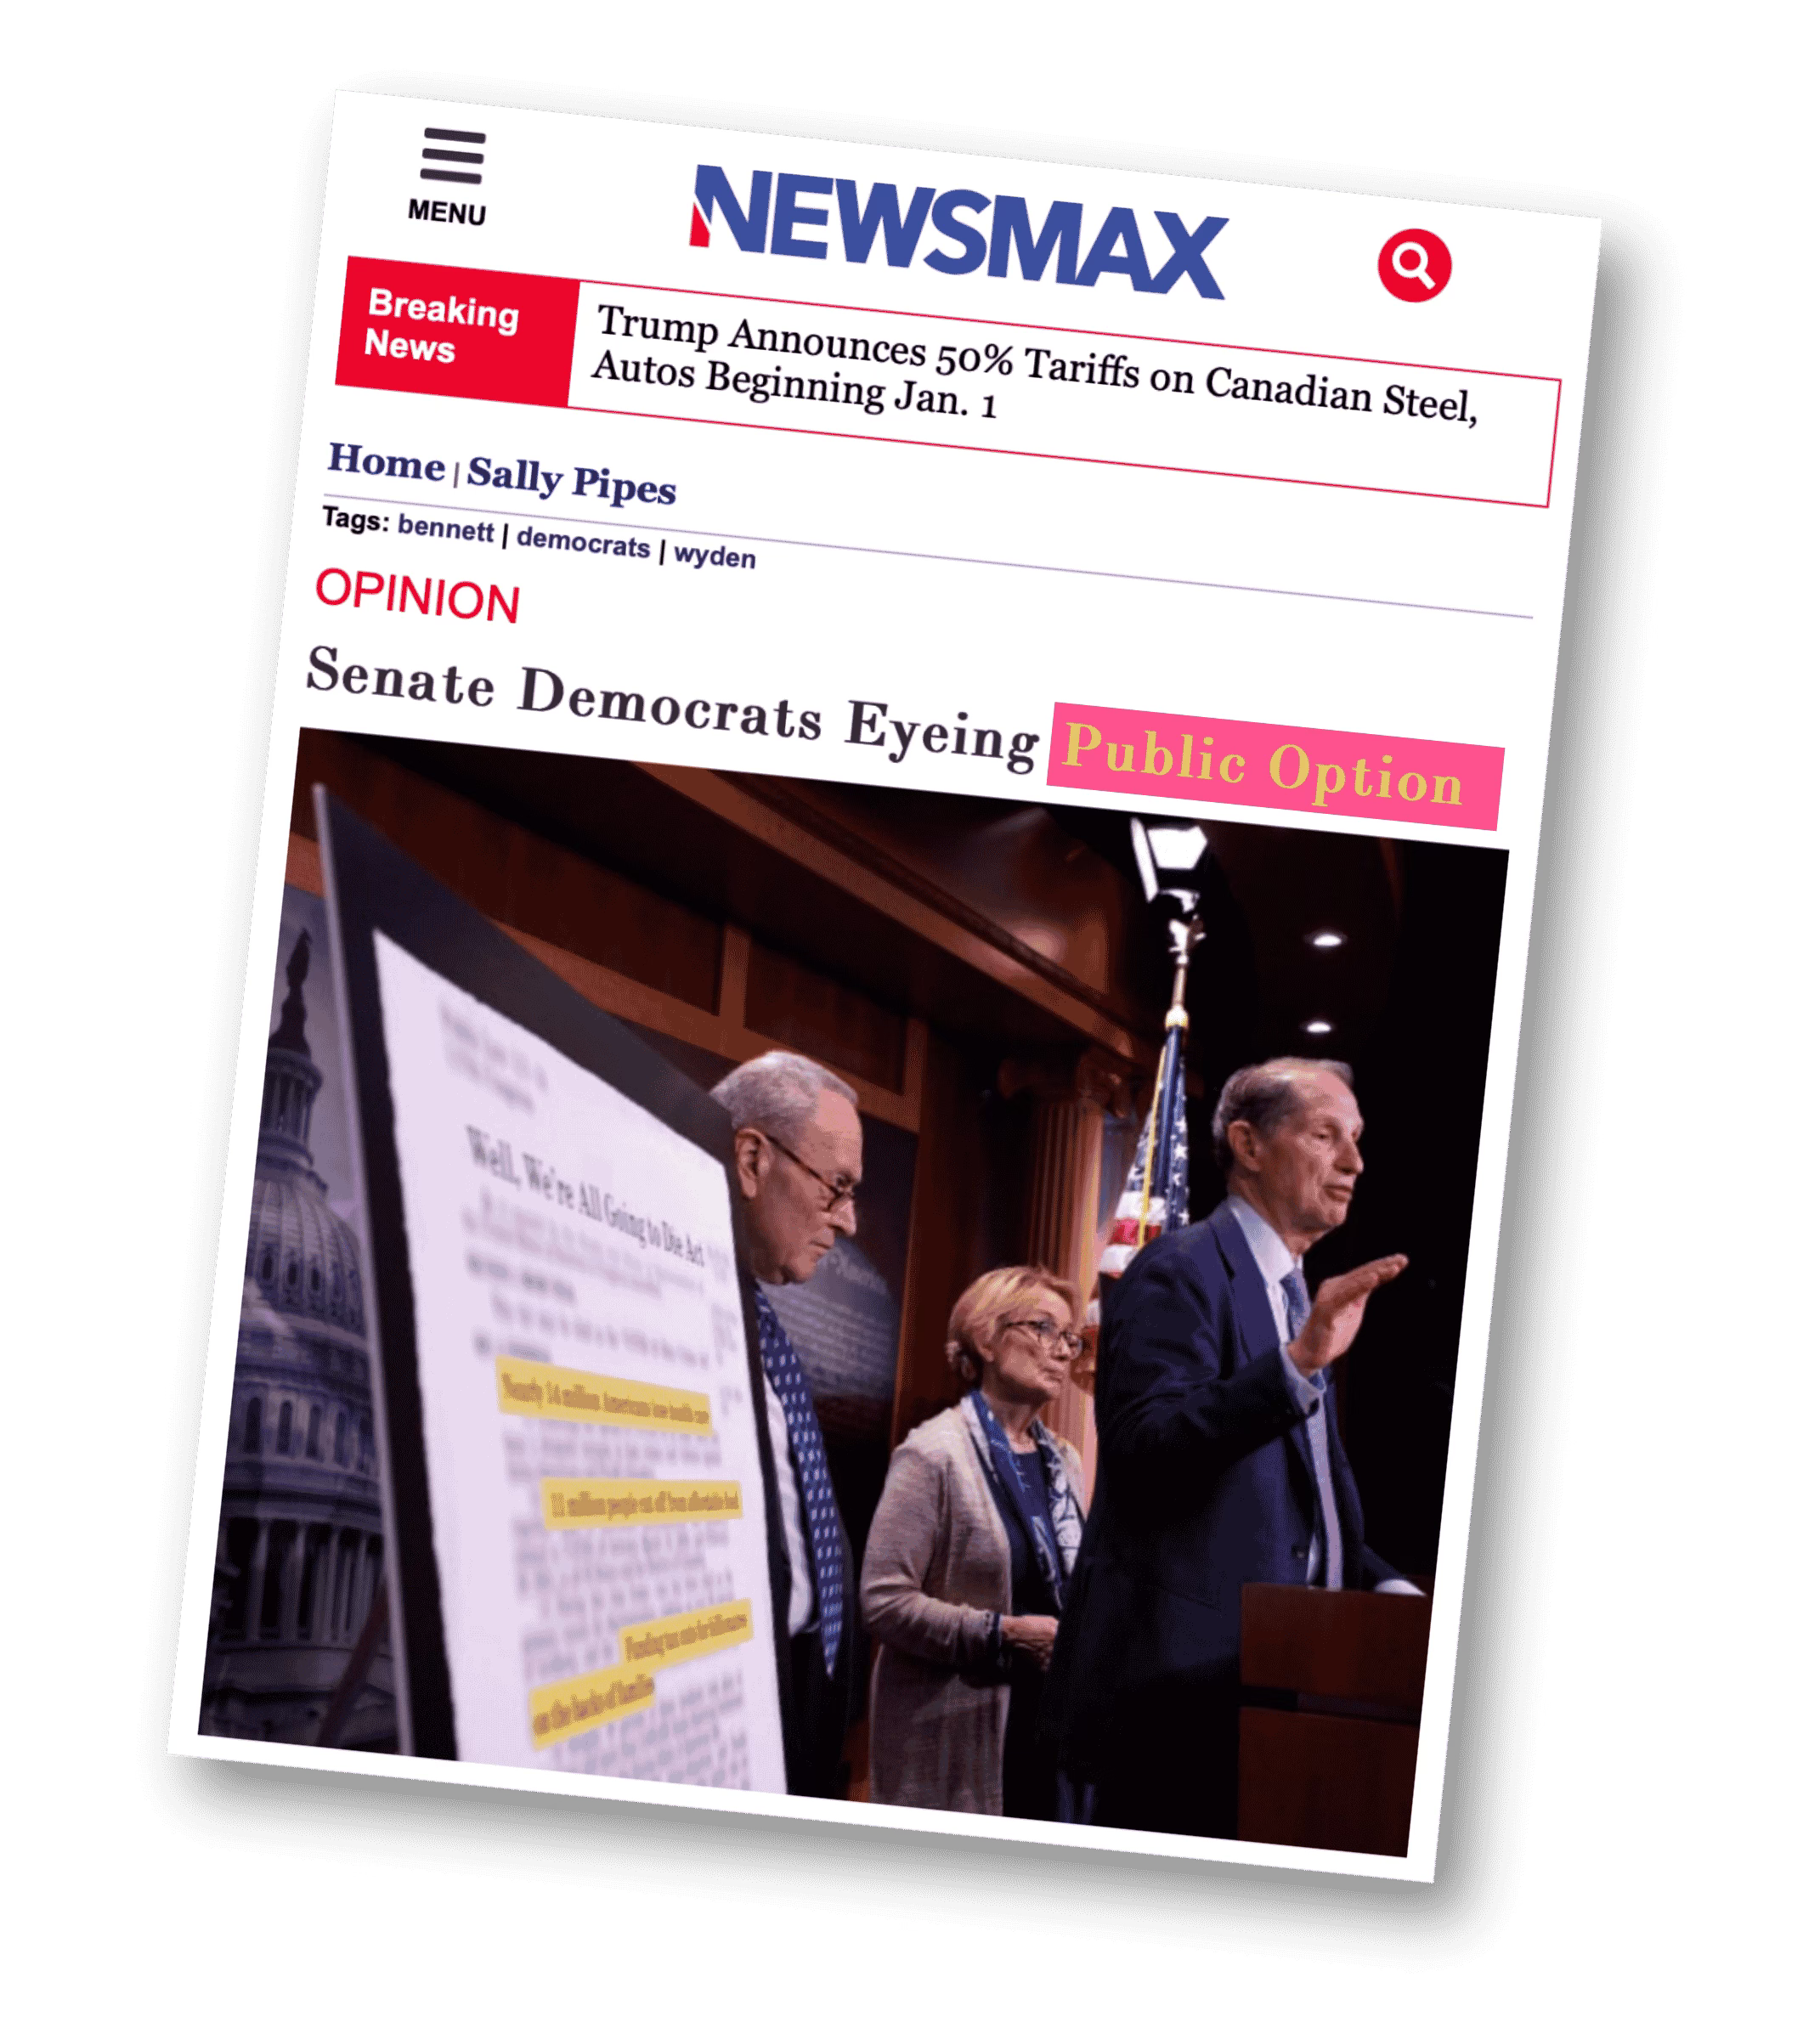
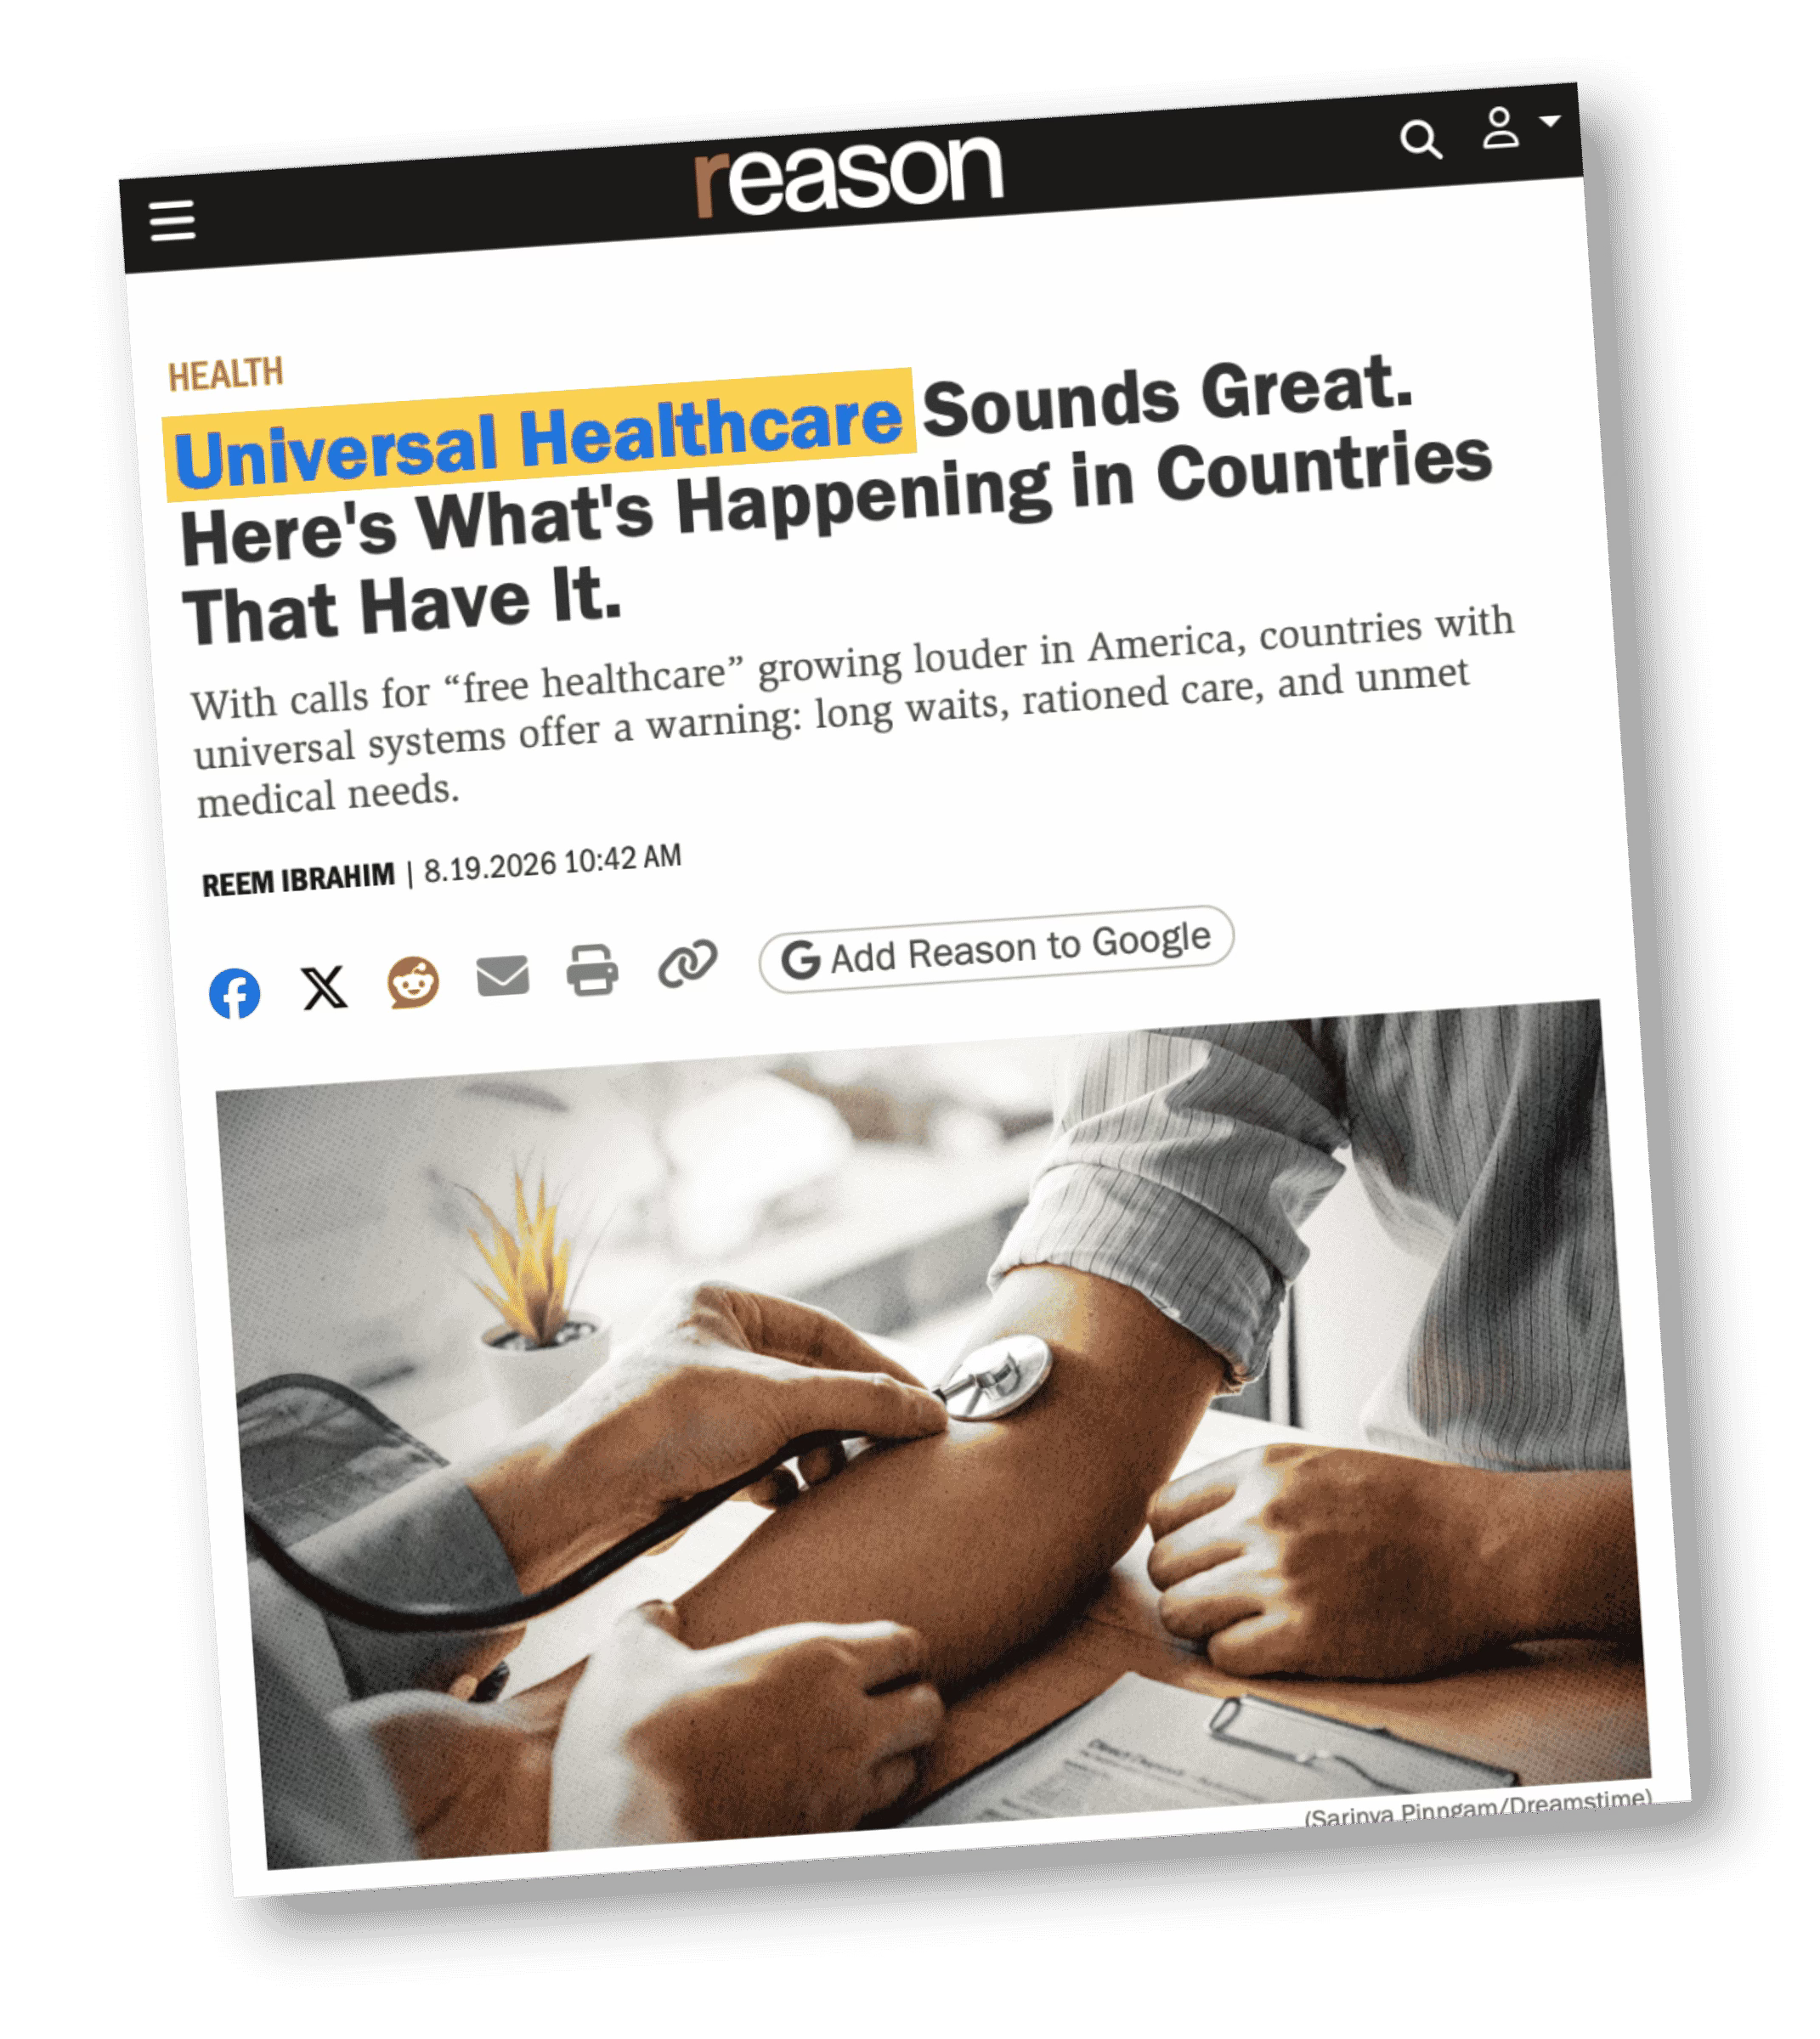
Last Wednesday, the New York Post published an op-ed by Pacific Research Institute President Sally Pipeswarning that Medicare for All would be a “real-life nightmare.” That same day, another Pipes column, this one in Newsmax, warned that a public option would be the first step toward a “complete government takeover of health insurance.” And also last Wednesday, Reason published a piece warning that universal health care means “long waits, rationed care, and unmet medical needs.”
These old tropes are familiar to me, as I am sure they are to many readers. And there is a reason they are back getting airtime.
Health care costs have become a major vulnerability for politicians heading into November. A KFF poll this summer found that 51% of voters considered health care costs an “extremely important” issue for candidates to address. Earlier KFF polling found that 61% said health care costs would have a major impact on which party’s candidates they support. And it is Americans’ sentiments about health care costs that have pushed many Medicare for All candidates over the finish line and lit a fire under current members of Congress who are now seeking a way to increase competition in the health insurance space by creating a nonprofit health plan that would be operated by the federal government.
Americans are increasingly fed up with private health insurers. Complaints about denied care, prior authorization, rising premiums and exorbitant out-of-pocket requirements have put insurers under a level of scrutiny I haven’t seen in years. It’s not just Abdul El Sayed. It’s Marjorie Taylor Green, too.
And it’s because of this political storm brewing that the health insurance industry’s longtime defenders are coming out swinging.
I know Sally Pipes’ work especially well. Pipes, who grew up in Canada but has lived in the U.S. for years, has spent decades warning Americans about reforms that might move the United States closer to a system like our neighbors to the north have. When I was an insurance executive, she was always useful to us.
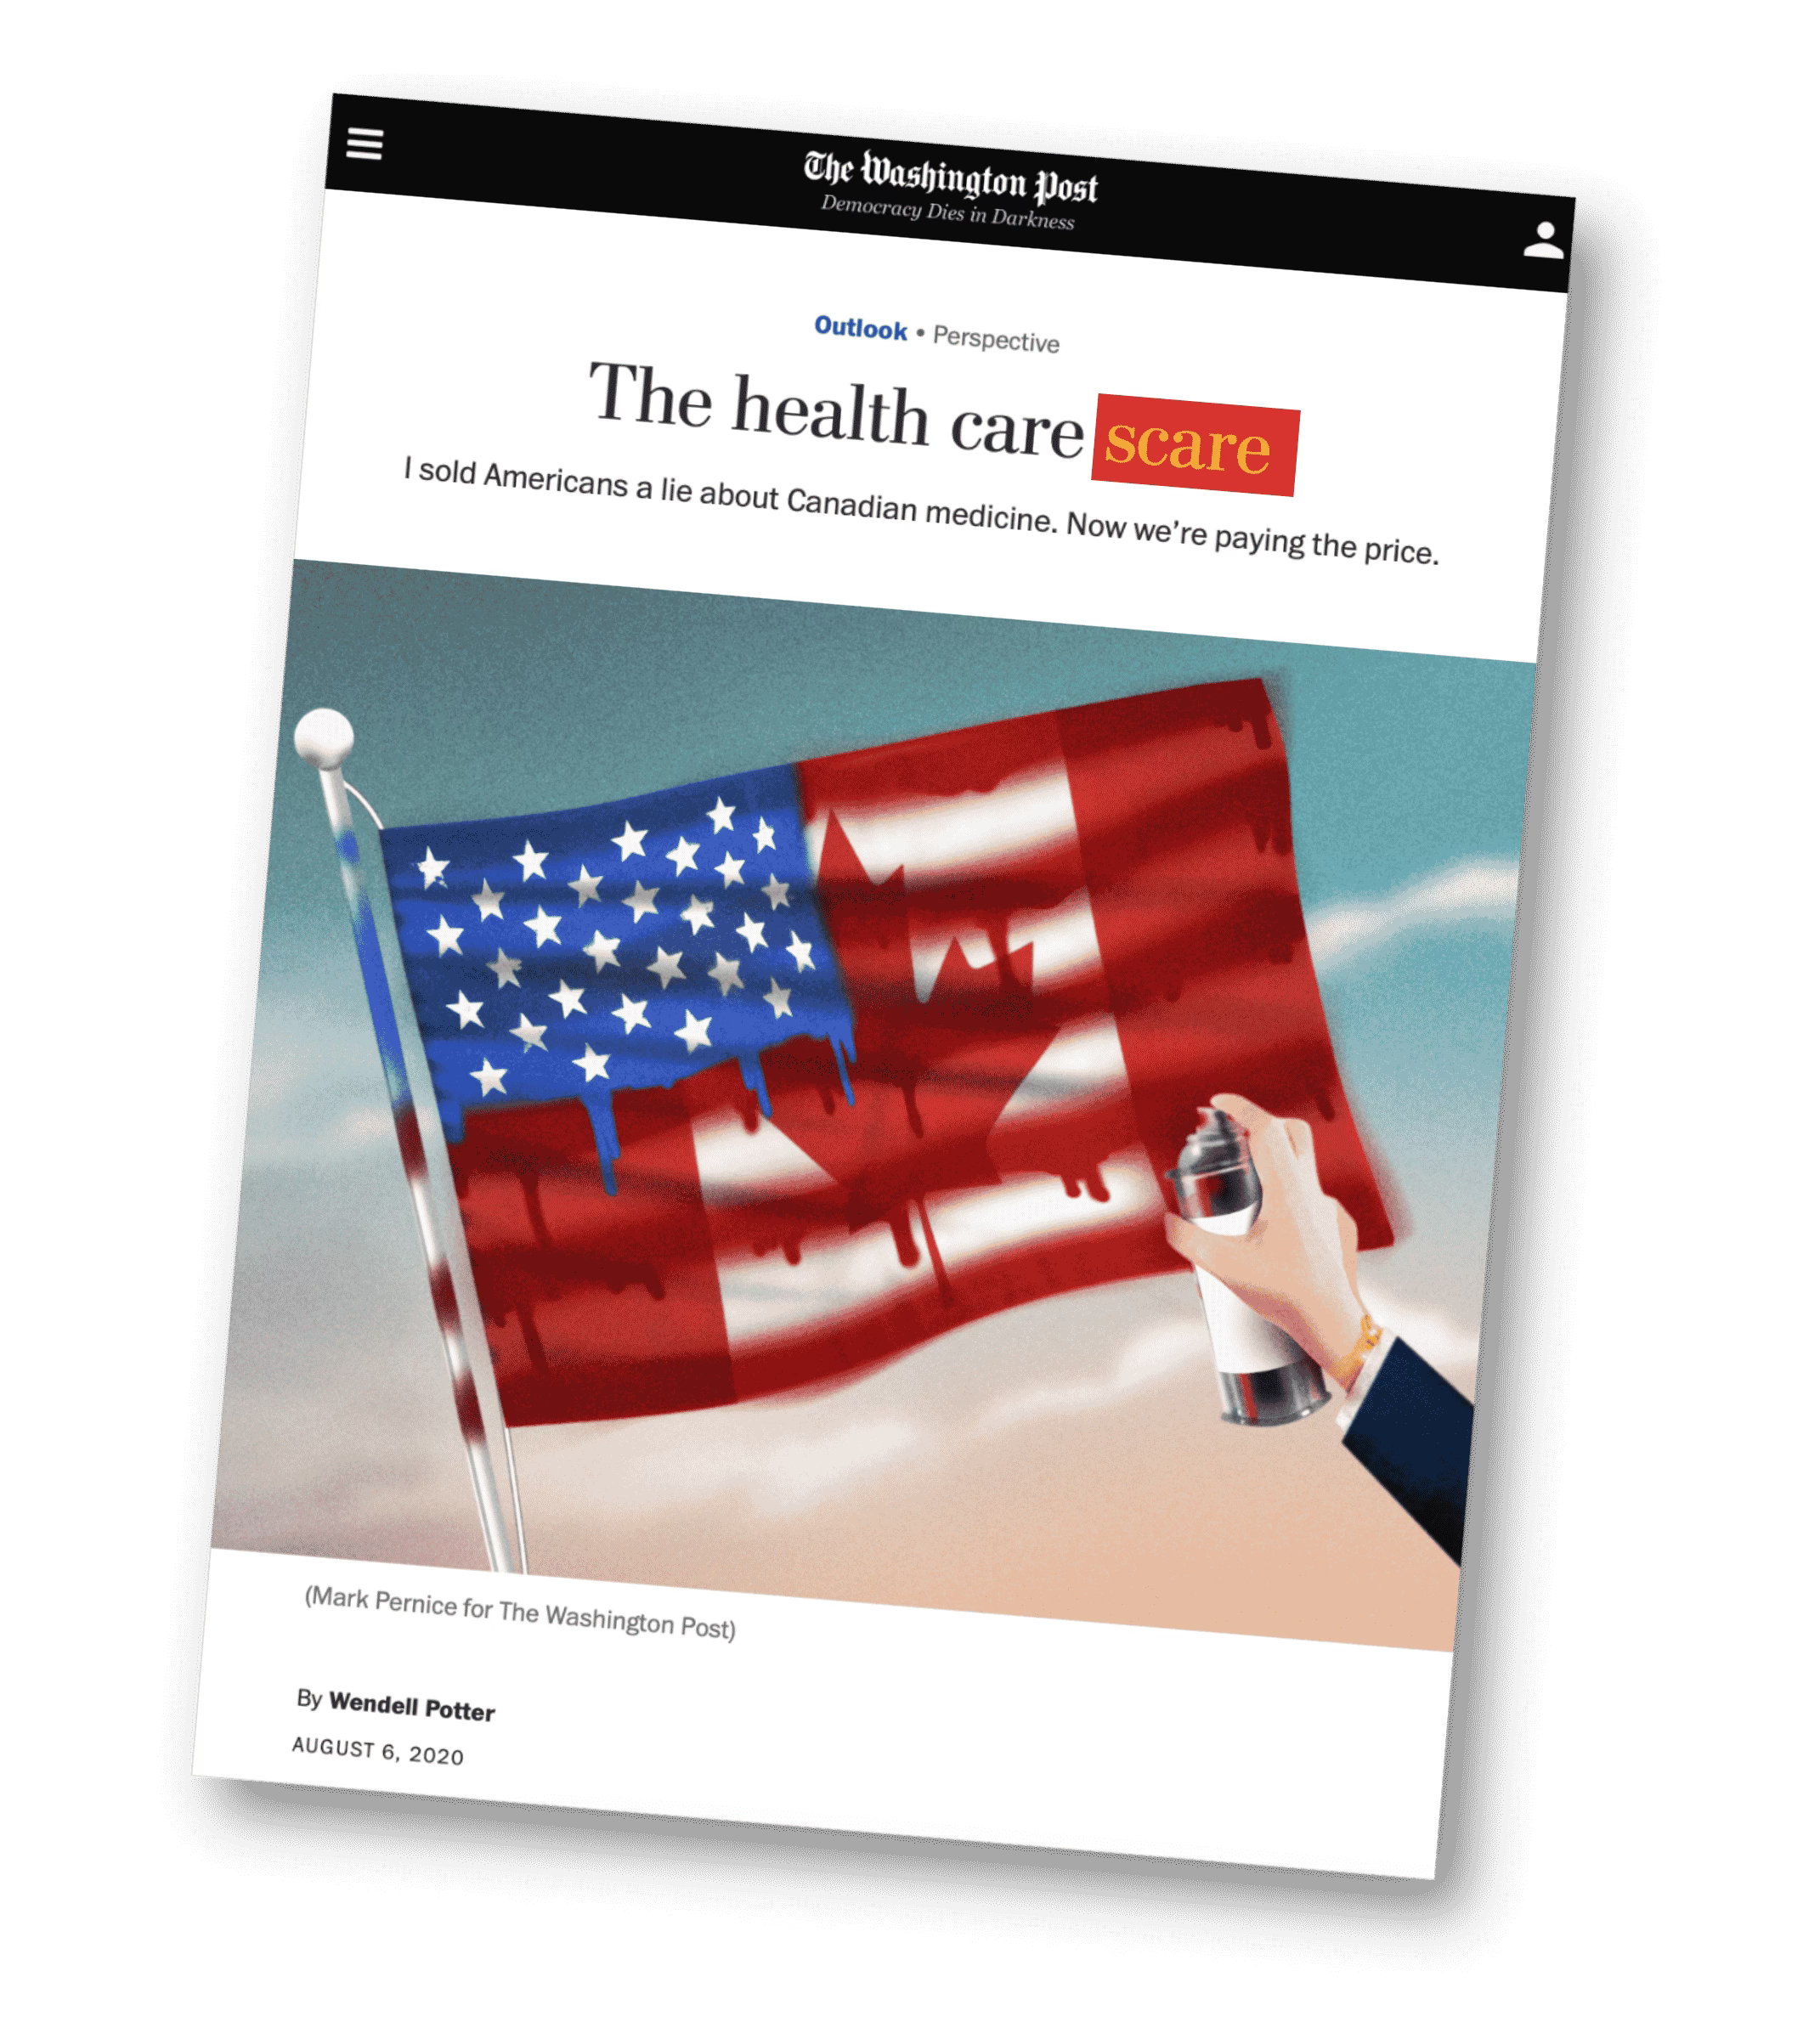
During the industry’s campaign against Michael Moore’s Sicko, for example, we drew on Pipes’ work to portray Canada’s health care system as a cautionary tale. I wrote about that in the Washington Post. And during the debate over what became the Affordable Care Act, she was a forceful critic of the public insurance option insurers desperately wanted to keep out of the final bill.
She was a reliable ally of the health insurance industry then, and she clearly is returning to that role once again.
In her New York Post column last week, Pipes reaches for one of the oldest and most effective arguments against health care reform: “choice.” Pipes says that (currently) employers can switch insurance companies, people buying their own coverage can shop among plans and Medicare beneficiaries can choose between traditional Medicare and privately run Medicare Advantage plans. Medicare for All, she warns, would take that “choice” away.
It’s an argument that has worked before because “choice” sounds pretty good. Who wants fewer “choices” when it comes to their health care? (That’s a rhetorical question. But one answer is the insurance industry, which has been eliminating “choice” and competition for decades now.)
The trick is that much of the “choice” Pipes is talking about is an illusion. Americans with employer-sponsored coverage most certainly do not get to choose their insurance company. Their employer does. And even if you can choose among a handful of health plans at work, all of them at most U.S. businesses that can still afford to offer coverage are operated by the insurance company your employer chose. That’s not the same as being able to choose your doctors or hospitals, which is the “choice” Americans really want. Your health insurer decides which doctors and hospitals are in your network and can require prior authorization before it will pay for care your doctor recommends.
In other words, Americans may have (some) “choice” of plans – with varying levels of deductibles and copayments – but that doesn’t necessarily mean they have a meaningful “choice” when it comes to their health care.
Pipes’ second column last week reveals something else about the “choice” argument. She warns in Newsmax that a public option would have advantages private insurers couldn’t match, eventually drive them from the market and put the country on a “slippery slope” toward single-payer health care. (I can’t tell you how many times I warned about that so-called “slippery slope” when I ran communications at Cigna.) So Pipes essentially is arguing that private insurers must continue to be protected from additional competition in the name of giving Americans “choices.” But give Americans the “choice” of a public plan—and the possibility that millions might prefer it to what private insurers are selling—and suddenly “choice” itself becomes the problem. She ignores the fact that seniors have long been able to choose a public option – traditional Medicare – or one operated by a private insurer – Medicare Advantage. I can assure you that Medicare Advantage is extraordinarily profitable for private insurers. No one should worry that insurance companies won’t continue to make money if people younger than 65 can also at long last be able to choose a public option.
Reason, the libertarian magazine that has been a persistent critic of the Affordable Care Act, Medicare for All and any concept that would allow the government to pass legislation that would interfere with insurance companies’ business practices, published its own warning last week under the headline: “Universal Healthcare Sounds Great. Here’s What’s Happening in Countries That Have It.”
The piece focuses heavily on Canada and Britain, arguing that people in those countries face long waits for care in overcrowded hospitals, and it cites examples of patients who received inadequate care. Those problems are real and shouldn’t be dismissed. Neither Canada nor Britain has a perfect health care system. But the United States sure as hell doesn’t either. Millions of Americans never get the care they need because they can’t afford to buy health insurance. Millions more with insurance can’t use it because of unaffordable out-of-pockets costs and have no “choice” but to go without the care they need.
Reason leans heavily on one of the most familiar scare tactics used against universal health care: the wait times. In Canada, you might wait a few months for an elective procedure like a knee replacement, and in the U.K. see a specialist or get a procedure. In Britain, you might find yourself in an NHS queue. But in either country, unlike in the U.S., you will not have to wait long at all to see your primary care doctor or be admitted to a hospital for medically urgent care.
To be sure, waiting for an elective procedure or imaging annoys many Canadians and Brits. They are real problems. But in this country, we ration care in a way that creates far more harm than waiting in a queue for a few weeks or months for non-urgent care. In the United States, if you can’t afford care, you don’t wait a few months or get thrown on a waiting list – you all too often never get the care. Because in the U.S. of A, if you’re one of the nearly 30 million Americans who are uninsured, or who can’t cover their deductibles, you don’t get it until you get so sick you have to go to the ER. And then you get saddled with hundreds or thousands of dollars in medical debt.
So comparatively, Americans put off the procedures, scans and medications they need. Americans live with pain and hope whatever is wrong doesn’t get worse. In the worst cases, folks in this country die prematurely with conditions that could have been treated because they couldn’t afford to get the care that could have saved their lives.
Not only did I find propaganda like this effective in my old job, I’ve also seen it effective in real life.
Obviously, the only way we are going to fix our health care system is by debating the difficult things. We can debate Medicare for All. We can debate a public option. Both proposals deserve serious scrutiny if we want to get the next version of our health care system right.
But the attacks against these reforms deserve scrutiny, too — especially when they come from the same people and organizations that have been making them for decades, and when those arguments have historically served the interests of a health insurance system with an enormous financial stake in preventing reform.
Medicare Advantage enrollees who developed a new complex condition, such as congestive heart failure or Alzheimer’s disease, were more likely to leave their plan for traditional Medicare the next year, according to a study published Aug. 21 in JAMA Health Forum.
Medicare Advantage (MA), the private alternative to traditional Medicare, covered 54% of Medicare beneficiaries in 2025, the study noted. MA plans offer perks traditional Medicare doesn’t guarantee, such as spending caps and built-in drug coverage, but they also use prior authorization and limited networks that can slow down care. Folks with bigger health needs have left MA at higher rates than healthier enrollees.
However, leaving isn’t simple. In most states, insurers don’t have to sell Medigap, the supplemental coverage that fills traditional Medicare’s gaps, to someone who skipped it when they first signed up. That can leave beneficiaries who get sick later stuck without that backup option.
The study was led by Mark K. Meiselbach, Ph.D., of the Department of Health Policy and Management at Johns Hopkins Bloomberg School of Public Health, and his team, who said past studies treated a new diagnosis as simply yes-or-no and mostly tracked switches to traditional Medicare. The researchers wanted to see whether leaving MA increases with the number of new conditions a person develops and to separate switches to traditional Medicare from switches to a different MA plan, something earlier research hadn’t done.
JAMA Health Forum finds Medicare Advantage members with new complex diagnoses increasingly switch to traditional Medicare, highlighting MediGap barriers, state protections, and plan limits.
The retrospective cohort study used Medicare enrollment and claims data from 2016 through 2021, analyzed in late 2025 and early 2026. Researchers tracked beneficiaries who stayed in an MA plan all of 2016 and had no complex condition through 2018. Using a standard federal algorithm, they flagged eight conditions: heart attack, Alzheimer disease, atrial fibrillation, chronic kidney disease, chronic obstructive pulmonary disease (COPD), depression, congestive heart failure and stroke.
A treatment group of 219,942 beneficiaries developed one of those conditions in 2019; a comparison group of 834,984 did not develop one through 2021. Using a difference-in-differences design, researchers compared how disenrollment changed for each group before and after 2019, then checked whether that change depended on how many new conditions someone developed, their state’s Medigap rules, and whether their MA plan was a health maintenance organization (HMO).
Developing any new complex condition raised MA disenrollment by 3.3 percentage points. Almost all of that increase came from people leaving for traditional Medicare rather than switching to a different MA plan. The more conditions someone developed, the more likely they were to leave: 1.4 percentage points with one new condition, up to 12.8 points among the 1,010 people with four or more. A new Alzheimer’s disease diagnosis had the single biggest effect, an 8.6 percentage point increase, while the rest ranged from 2.9 to 5.0 points.
Beneficiaries in the four states with Medigap guaranteed-issue and community-rating rules, Connecticut, Maine, Massachusetts and New York, were 1.5 percentage points more likely to leave for traditional Medicare than beneficiaries elsewhere. Those enrolled in HMO plans were less likely to leave for traditional Medicare but more likely to switch to a different MA plan.
Dual-eligible beneficiaries, who qualify for both Medicare and Medicaid, left for traditional Medicare at higher rates and switched MA plans less often, which the authors said tracks with Medicaid reducing their need for Medigap. Plan star ratings didn’t matter much: those in 4- or 5-star plans left at about the same rate as those in 3-star plans after a new diagnosis, suggesting star ratings don’t capture how well a plan serves sicker members.
“These findings underscore the difficulty of making an initial enrollment decision in Medicare,” the study’s authors wrote in the discussion. “Beneficiaries cannot foresee all of their future health needs when they first enroll in MA, but the consequences of that decision may depend on health events that occur years later.”
Strengths in this study include the tracked disenrollment trends before 2019, not just a single before-and-after comparison, and the study found no sign the groups were already diverging. The results also held up after adjusting for other chronic conditions people developed.
However, there are limits. Since new conditions were identified from claims, which usually show up after a diagnosis, the authors said their numbers likely undercount the true effect rather than overstate it. Counting conditions is also an imperfect stand-in for true complexity, and the group with four or more new conditions was small, just 1,010 people, so those figures carry more uncertainty. The data ends in 2021 and doesn’t reflect newer MA plan designs.
The authors confirmed that state Medigap protections make it easier for more ill beneficiaries to switch to traditional Medicare, but expanding those protections more broadly could push Medigap premiums up for everyone. And MA star ratings, as they currently work, may not reflect how well a plan actually serves members whose health needs have grown more complex.
Funding from the Rural Health Transformation Program is beginning to flow to the states. The purpose is larger, but some say its success should be measured by whether it preserves access to care at rural hospitals.
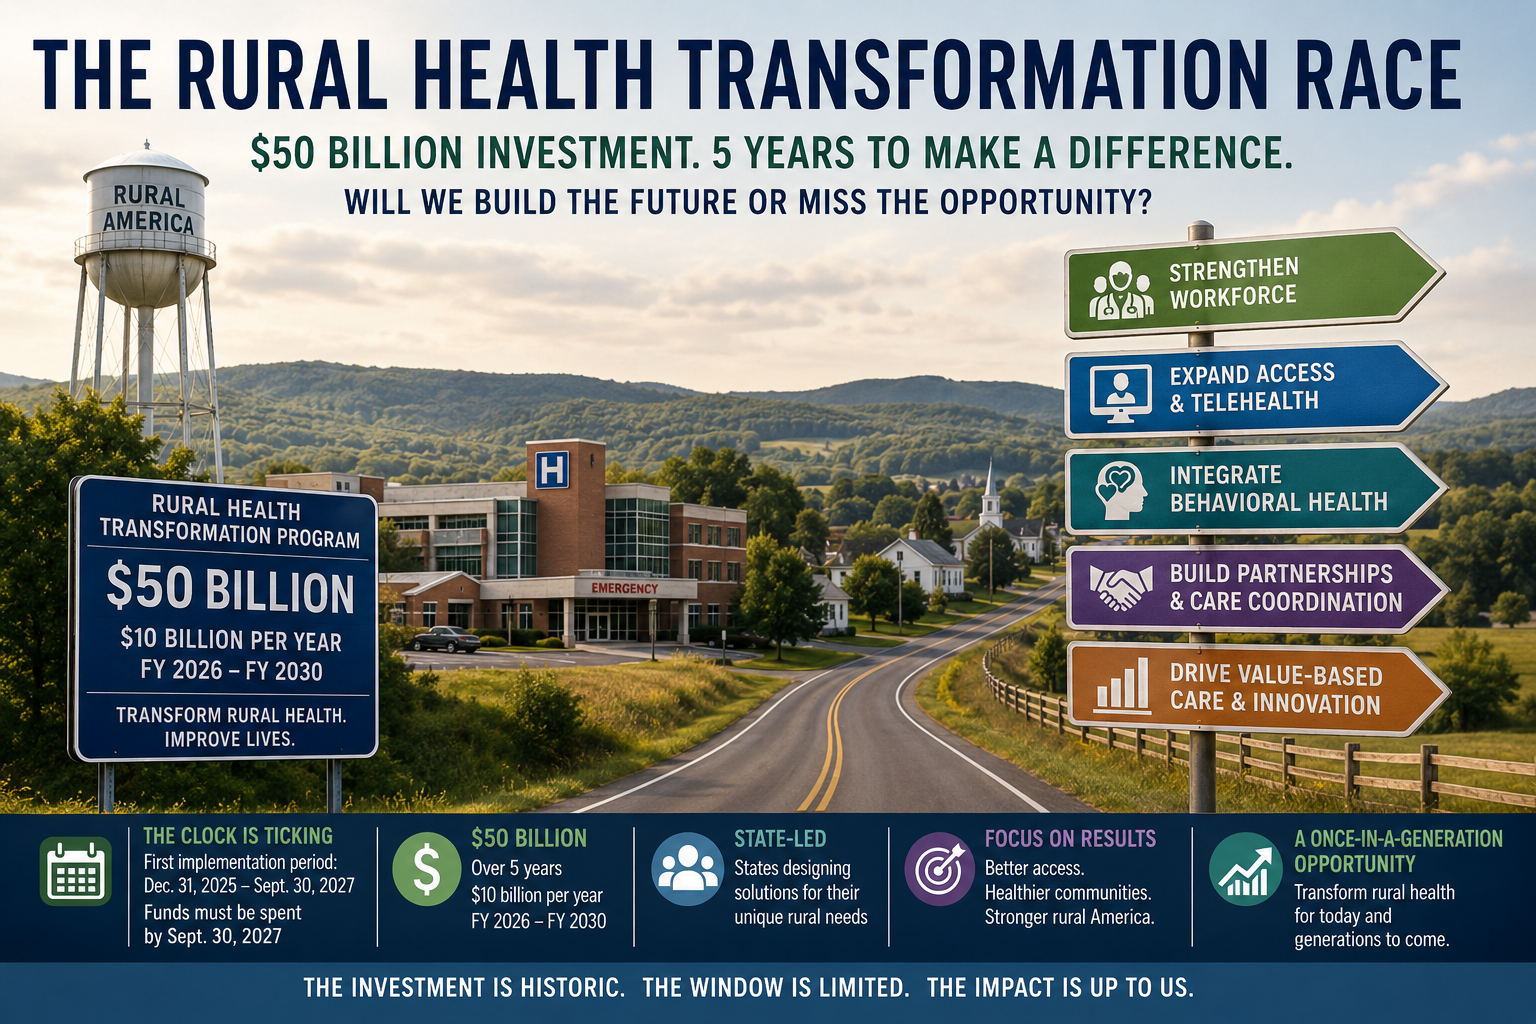
The Rural Health Transformation Program represents one of the largest federal investments ever made in rural healthcare, with $50 billion authorized over five years to help states improve access, strengthen the workforce, and modernize care delivery in rural areas. Still, as states move from planning to implementation, the program faces an immediate test: Can it deliver meaningful transformation while rural hospitals continue to face mounting financial and operational pressures?
The answer is not so cut-and-dried.
Some rural health advocates view the program as an unprecedented opportunity to rethink how care is delivered in underserved communities. Others caution that although the funding can accelerate innovation, it was never designed to replace revenue that providers could lose because of Medicaid policy changes, such as work requirements.
Alan Morgan is CEO of the National Rural Health Association.
“It’s apples and oranges,” says Alan Morgan, M.P.A., CEO of the National Rural Health Association. “The Rural Health Transformation Program was created to invest in long-term innovation, not to replace Medicaid funding. Comparing the two misses the intent of the legislation.”
At the same time, Morgan acknowledged that rural providers remain deeply concerned about what lies ahead.
“The math just doesn’t work,” he said. “Nearly one-half of rural hospitals already operate at a loss, and hundreds remain at risk of closure if financial pressures continue to mount.”
Innovation versus stabilization
Congress created the Rural Health Transformation Program as part of the One Big Beautiful Bill Act that President Donald Trump signed into law on July 4, 2025. It was added in part to offset the federal Medicaid cuts in the bill, which the Congressional Budget Office estimated will total $911 billion over a 10-year period. The program provides $10 billion annually through 2030 to help states invest in new care models, workforce development, technology and other initiatives intended to improve healthcare delivery in rural areas.
Ryan Cohn is chief strategy officer at Sachs Media.
Ryan Cohn, chief strategy officer at Sachs Media, who has advised multiple states, health systems and healthcare organizations on Rural Health Transformation Program applications, says that the funding is not sufficient to offset the broader financial challenges facing rural healthcare, noting that the fund was created after lawmakers expressed concern that the Medicaid cuts could disproportionately affect rural providers, especially rural hospitals. And once CMS implemented the program, its focus shifted toward transforming healthcare delivery rather than serving as a financial backstop for struggling hospitals.
“The real question isn’t whether $50 billion is enough money,” Cohn comments. “It’s whether we can stand up a new care model fast enough to replace a hospital that may close in the next few years.”
Harold D. Miller, M.S., president and CEO of the Center for Healthcare Quality and Payment Reform, says he believes the program has the potential to preserve services in rural communities, but only if states have enough flexibility to direct funding where it is needed most.
“The $10 billion per year in new funds under RHTP [Rural Health Transformation Program] could go a long way to preventing the loss of services in rural areas if the money could be directed to the hospitals that are currently being underpaid,” Miller observes.
Instead, he adds, CMS has limited the amount states can use for direct provider payments while encouraging investment in new initiatives and technology.
“Although those investments may ultimately prove valuable, technology alone cannot replace essential healthcare services,” he says. “A phone app can’t deliver a baby, draw blood, stitch a wound or do a CT scan.”
Implementation
After months spent developing applications, states are now beginning the nuts-and-bolts work of turning proposals into operational programs.
According to Cohn, five priorities appear consistently across state plans: workforce development; telehealth and data infrastructure; prevention; new payment and delivery models; and bringing care closer to patients through mobile clinics and regional care networks.
Joe Ganley, J.D., vice president of government and regulatory affairs for athenahealth, says rural practices already operate with no room to spare. “The margin for error has essentially disappeared,” Ganley said.
Among those priorities, workforce development stands out as the dominant theme, he says. Many states are investing in residency programs, loan repayment initiatives and “grow your own” workforce strategies that encourage students from rural communities to pursue healthcare careers locally in hopes they will eventually remain there.
Technology investments also extend well beyond telehealth. Cohn says states are focusing on improving interoperability so rural hospitals, clinics and emergency medical services can share patient information more effectively. Others are proposing artificial intelligence for population health, drone delivery of medications and laboratory tests, and technology-enabled transportation programs designed to improve access to care.
Even so, implementation presents significant challenges. “This money was built to move fast,” Cohn says. Some states first had to establish entirely new administrative structures before funding could reach providers. Others continue to develop procurement processes while preparing to demonstrate measurable outcomes that will influence future funding allocations.
Sustainability also remains an open question. “A new residency slot or telehealth program only counts if it outlives the initial RHTP funding,” Cohn says. “Not every plan has a fully formed answer for what happens in year six.”
Financial pressures
Although much of the discussion surrounding the Rural Health Transformation Program focuses on future transformation, many providers continue grappling with immediate financial realities.
Joe Ganley, J.D., vice president of government and regulatory affairs for athenahealth, says rural practices already operate with no room to spare. “The margin for error has essentially disappeared,” Ganley said.
When patients delay appointments, ration medications or postpone treatment because of cost, practices experience more than declining revenue. Patients often arrive later with more complex medical needs, increasing clinical and operational burdens. “Providers feel it immediately — in no-shows, in collections and in the clinical complexity of patients who arrive later and sicker,” Ganley says.
Beyond those financial pressures, Ganley notes that rural physician practices also continue to struggle with workforce shortages and limited interoperability.
“Many rural practices operate with one to two months of reserves,” Ganley said. “That’s not a buffer — it’s a cliff. Any disruption to payment flows, whether from coverage losses, billing delays or reimbursement changes, can threaten the viability of organizations that communities depend on as their only access point for primary care.”
He adds that recruiting and retaining clinicians remains difficult, while limited interoperability makes it harder for rural providers to coordinate care and participate in value-based payment models.
Measuring success
Even as the rural health program dollars begin reaching states, many believe it is far too early to determine whether the $50 billion fund will live up to its name and change rural healthcare for the better. “I think it’s too early to determine, and that’s the honest truth,” says Morgan. Many states are only beginning to release requests for proposals and identify where funding will be directed. Although states must obligate the funds within required timelines, many providers are still waiting to learn whether they will receive support and how they will be permitted to use it. “Our members are concerned,” Morgan adds. “Are we going to receive any of the money? How are we going to be able to use the funds? There’s just a lot yet unknown.”
Miller notes the program’s success should not be measured by the number of grants awarded or technology projects launched. He says he believes there is a relatively simple way to take stock of the program.
“If hospitals continue to close and eliminate services in 2026 and 2027, even with $10 billion in new funds available each year, the Rural Health Transformation Program should be viewed as a failure,” Miller says.
In his opinion, preserving essential healthcare services — including obstetrics, emergency care and primary care — must remain the priority. Even if federal Medicaid policy changes were reversed tomorrow, many small rural hospitals would continue struggling because reimbursement from Medicare Advantage, commercial insurers and other payers often fails to cover the cost of providing care in sparsely populated communities.
The No. 1
Morgan said workforce issues remain the No. 1 concern among rural hospitals, followed closely by financial stability. He’s particularly optimistic about states using the rural health funds to create “grow your own” workforce initiatives that recruit students from rural communities, train them locally and encourage them to practice close to home after graduation.
“I think that’s going to be interesting,” Morgan says, noting that locally trained clinicians are far more likely to remain in rural communities over the long term. Cohn heard similar priorities while working with states on their applications. “Workforce development is in most states’ plans because providers everywhere are facing significant staffing shortages,” he says.
Some states are investing in rural residency programs, loan repayment initiatives and accelerated licensing efforts. Others are combining workforce initiatives with telehealth and regional partnerships designed to extend scarce clinical expertise across larger geographic areas.
Ganley notes that technology can help relieve administrative burdens, but only if it simplifies clinicians’ work rather than adding complexity.
“The practices that will sustain access are the ones that can operate efficiently under financial constraints, reduce administrative burden without growing their administrative head count and connect their patients to the right level of care regardless of where that care is delivered,” he says.
Behavioral health providers are experiencing many of the same pressures. Shannon Werb, CEO of Array Behavioral Care, says that disruptions in Medicaid coverage often interrupt outpatient behavioral healthcare, causing patients to delay treatment until they require crisis care.
“When patients lose coverage or face affordability challenges, they often delay care until their condition reaches a crisis point,” says Werb. “At that stage, the emergency room becomes the default access point for treatment.” The result, he said, is longer behavioral health boarding times, increased uncompensated care and additional strain on hospitals.
The long haul
The biggest question about the infusion of federal funds into rural healthcare is whether the investment will continue paying dividends after federal funding expires. For a problem that has been decades in the making, five years is not that much time, and $50 billion is not that much money.
Because the program is scheduled to end after five years, healthcare leaders repeatedly emphasized the importance of building sustainable systems rather than launching short-lived projects.
“The real measure isn’t dollars spent or programs announced,” Cohn says. “It’s whether a rural patient can access care in 2028 that they couldn’t get in 2025.”
Morgan agrees that outcomes, not spending, will determine whether the initiative succeeds. The first warning sign, he says, would be an increase in rural hospital and rural health clinic closures. He says life expectancy is the ultimate yardstick. “We continue to see a decline in the overall life expectancies of rural communities versus urban. At the end of the day, that’s the measure that really matters.”