Last Friday, Chicago Fed President Austan Goolsbee noted that rising unemployment on top of an oil price shock creates “exactly the kind of stagflationary environment that’s as uncomfortable as any that faces a central bank,” per the Wall Street Journal.
Flashback:
Analysts and media started tossing out the “s” word when inflation revved up back in 2021.
The term “stagflation” really took off the next year, when Russia invaded Ukraine, spiking energy prices. Everyone then predicted a recession that never materialized.
State of play:
Today is different for two reasons. First, the job market is more sluggish than it was a few years ago.
Second, the oil shock from the Iran war is potentially magnitudes larger than from the Russian war, taking 20% of global supply oil off the board.
“Disruption to the Strait of Hormuz creates a far larger potential supply shock that extends beyond oil,” Skylar Montgomery Koning, a macro strategist with Bloomberg, wrote in a note.
“Shipping flows more broadly are being disrupted. That is pushing up energy and food costs, lifting inflation and squeezing growth.”
“This stagflationary mix is particularly toxic for markets, as it increases the risk that bonds and equities sell off together.”
Reality check:
It’s not the 1970s. Economists believe the Iran war will slow economic growth and cause an increase in inflation, but not to the extremes seen back then.
“If you want the word ‘stagflation’ with a very little ‘s,’ you could,” says David Kelly, chief global strategist at JPMorgan Asset Management.
He recently revised his economic growth projections slightly downward this year due to the war. And he is projecting slightly higher inflation.
The difference between now and the 1970s is, back then, higher prices led to wage increases, which led to more inflation in a wage-price spiral that got out of hand, he says. Workers just don’t have the power for that today.
“This is probably just going to slow the economy down, rather than trigger some long wave of inflation,” says Michael Madowitz, principal economist at the progressive Roosevelt Institute.
The bottom line:
This is not your father’s economic shock. Yesteryear’s bell bottoms would look a bit weird if you trotted them out today.
The Congressional Budget Office regularly updates the Congress on our projections of the Hospital Insurance (HI) Trust Fund’s financial position as well as changes in our outlook on that position. This blog post serves as that update.
The HI trust fund is used to pay for benefits under Medicare Part A, which covers inpatient hospital services, care provided in skilled nursing facilities, home health care, and hospice care. The fund derives its income from several sources. Over the next 30 years, about three-quarters of its annual income comes from the Medicare payroll tax and roughly one-eighth comes from income taxes on Social Security benefits. The rest comes from other sources.
Budget Projections
We estimate that the HI trust fund’s balance is exhausted in 2040. The balance generally increases through 2031, but spending begins to outstrip income in the following year.
That projection is based on our demographic projections published in January 2026, our economic and 10-year budget projections published on February 11, 2026, and our long-term budget projections that extend those earlier projections. It does not account for any effects, including effects on the economy or the budget, of the Supreme Court’s ruling on tariffs on February 20, 2026 (Learning Res., Inc. v. Trump, Nos. 24-1287, 25-250, slip op. (S. Ct. Feb. 20, 2026)).
As required by the Deficit Control Act, our projections reflect the assumption that benefits would be paid as scheduled even after the HI trust fund was exhausted. If the balance of the fund was exhausted and the fund’s spending continued to outstrip its income, total payments to health plans and providers for services covered under Part A would be limited by law to the amount of income credited to the fund. Total benefits would need to be reduced (in relation to the amounts in our baseline projections) by an amount that rises from 8 percent in 2040 to 10 percent in 2056, we estimate. It is unclear what changes the Centers for Medicare & Medicaid Services would make to operate the Part A program under those circumstances.
We estimate that the HI trust fund’s actuarial balance measured over a 25-year period is negative: an actuarial deficit of 0.30 percent of taxable payroll (or 0.13 percent of gross domestic product, or GDP).
The actuarial balance is a single number that summarizes the fund’s current balance and annual future streams of revenues and outlays over a certain period. It is the sum of the present value of projected income and the current trust fund balance minus the sum of the present value of projected outlays and a year’s worth of benefits at the end of the period. A present value is a single number that expresses a flow of current and future income or payments in terms of an equivalent lump sum received or paid today. And taxable payroll is the total amount of earnings—wages and self-employment income—subject to the payroll tax.
To eliminate the actuarial deficit, lawmakers would need to take action. They could increase taxes, reduce payments, transfer money to the trust fund, or take some combination of those approaches. The estimated size of the change needed—0.30 percent of taxable payroll—excludes the effects of changes in taxes or spending on people’s behavior and the economy. Those effects, which would depend on the specifics of the policy change, would alter the size of the tax increase, benefit reduction, or transfer needed to eliminate the actuarial deficit.
Changes in Our Projections Since March 2025
The year in which the HI trust fund’s balance is exhausted in our current projections, 2040, is 12 years earlier than in our most recent estimate of that date, which was published in March 2025. Measured in relation to taxable payroll, the trust fund’s 25-year actuarial deficit is 0.17 percentage points greater in the current projections than in last year’s. (Measured in relation to GDP, the actuarial deficit is 0.07 percentage points greater than we projected last year.) Those changes are driven largely by projections of less income to the fund. Projections of greater spending also contribute to the changes.
Our projections of income to the HI trust fund are less this year than last year for three main reasons:
First, revenues from taxing Social Security benefits are smaller in the current projections because of changes put in place by the 2025 reconciliation act (Public Law 119-21), which lowered tax rates and created a temporary deduction for taxpayers age 65 or older.
Second, we decreased our projections of revenues from payroll taxes to account for projections of lower earnings.
Finally, we now project interest income credited to the trust fund to be smaller than estimated last year because of the smaller trust fund balances in this year’s projections.
Spending is projected to be greater mainly because of an increase in expected spending per enrollee. Per-enrollee spending in Medicare Part A’s fee-for-service program in 2025 and bids in 2026 by providers of Medicare Advantage plans were both higher than we expected, leading to projections of greater per-enrollee spending in both programs.
Projections of the HI trust fund’s balances are sensitive to small changes in projections of its spending and income. As a result, those estimates are highly uncertain.
As media attention focused on Minneapolis, Greenland and Venezuela last week, the Center for Medicaid and Medicare Services (CMS) released its 2024 Health Expenditures report Thursday: the headline was “Health care spending in the US reached $5.3 trillion and increased 7.2% in 2024, similar to growth of 7.4% in 2023, as increased demand for health care influenced this two-year trend. “
Less media attention was given two Labor Department reports released the Tuesday before:
Prices: The consumer-price index (CPI) for December came in somewhat higher than expected with an increase of 0.3% and 2.7% over the past 12 months. Overall inflation isn’t rising, but it also isn’t coming down.
Wages: The Labor Department reported average hourly earnings after inflation in the last year rose 0.7% during the first five months of this year, but real hourly earnings have declined 0.2% since May. They’re stuck.
Prices are increasing but wages for most hourly workers aren’t keeping pace. That’s why affordability is the top concern for voters.
Meanwhile, the health economy continues to grow—no surprise. It’s a concern to voters only to the extent it’s impacting their ability to pay their household bills. They don’t care or comprehend a health economy that’s complex and global; they care about their out-of-pocket obligations and surprise bills that could wipe them out.
As Michael Chernow, MedPAC chair and respected Harvard Health Policy professor wrote:
“The headline number, 7.2% growth in 2024, is concerning but hardly a surprise. It follows 7.4% growth in 2023. This rate of NHE growth is not sustainable. It exceeds general inflation and growth in the gross domestic product (GDP), pushing the share if GDP devoted to health care spending to 18% in 2024; the share of GDP devoted to health care is projected to rise to 20.3% by 2033. In fact, these figures may be an underestimate of the fiscal burden of the health care system because spending on some things, such as employer administrative costs, are not captured… Given all the attention to prices and insurer profits, it is important to note that those factors are not the main drivers of spending growth—this time, it’s not the prices, stupid. There was virtually no excess medical inflation (medical inflation above general inflation) for 2023 or 2024. In fact, prices for retail drugs (net of rebates) rose at a rate below inflation. There will certainly be cases of rising prices driving spending, but on average, price growth is not the problem. This does not mean high-priced products and services are not an important component of spending growth, but instead it implies that their contribution to spending growth on average stems from their greater use, not rising prices. The main driver of spending growth is greater volume and intensity of care…”
My take:
Since 2000 to 2024, total healthcare spending in the U.S. has been volatile:
2000–2007: High growth, typically 6–8% per year (driven by rising utilization and prices).
2008–2013: Growth slowed to 3–4% during and after the Great Recession.
2014–2016: Growth ticked up to 4.5–5.8% with ACA coverage expansion.
2017–2019: Moderation around 4.5%.
2020: COVID‑19 shock—growth slowed to ~2% due to deferred care.
2021: Rebound to ~4%.
2022: 4.8%, close to pre‑pandemic norms.
2023: 7.4%, fastest since 1991–92.
2024: 7.2%, reaching $5.3 trillion (18% of GDP)
Between 2000 and 2024, total health spending in the U.S. increased $3.9 trillion (279%) while the U.S. population grew by 58 million (20.4%). 2025 spending is expected to follow suit. The underlying reason for the disconnect between health spending and population growth is more complicated than placing blame on any one sector or trend: it’s true in the U.S. and every other developed system in the world. Healthcare is expensive and it’s costing more.
This is good news if you’ve made smart bets as an investor in the health industry but it’s problematic for just about everyone else including many in the industry who’ve benefited from its aversion to spending controls and cost cutting.
The current environment for the healthcare economy is increasingly hostile to the status quo. Voters think the system is wasteful, needlessly complicated and profitable. Lawmakers think it’s no man’s land for substantive change, defaulting to price transparency, increased competition and state regulation in response. Private employers, who’ve bear the brunt of the system’s ineffectiveness, are timid and reformers are impractical about the role of private capital in the health economy’s financing.
The healthcare economy will be an issue in Campaign 2026 not because aggregate spending increased 7-8% in 2025 per CMS, but because it’s no longer justifiable to a majority of Americans for whom it’s simply not affordable. Regrettably, as noted in Corporate Board Member’s director surveys, only one in five healthcare Boards is doing scenario planning with this possibility in mind.
P.S. The President released his Great Healthcare Plan last Thursday featuring his familiar themes—price transparency for hospitals and insurers, most favored pricing and elimination of PBMs to reduce prescription drug costs—along with health savings accounts for consumers in lieu of insurance subsidies. The 2-page White House release provided no additional details.
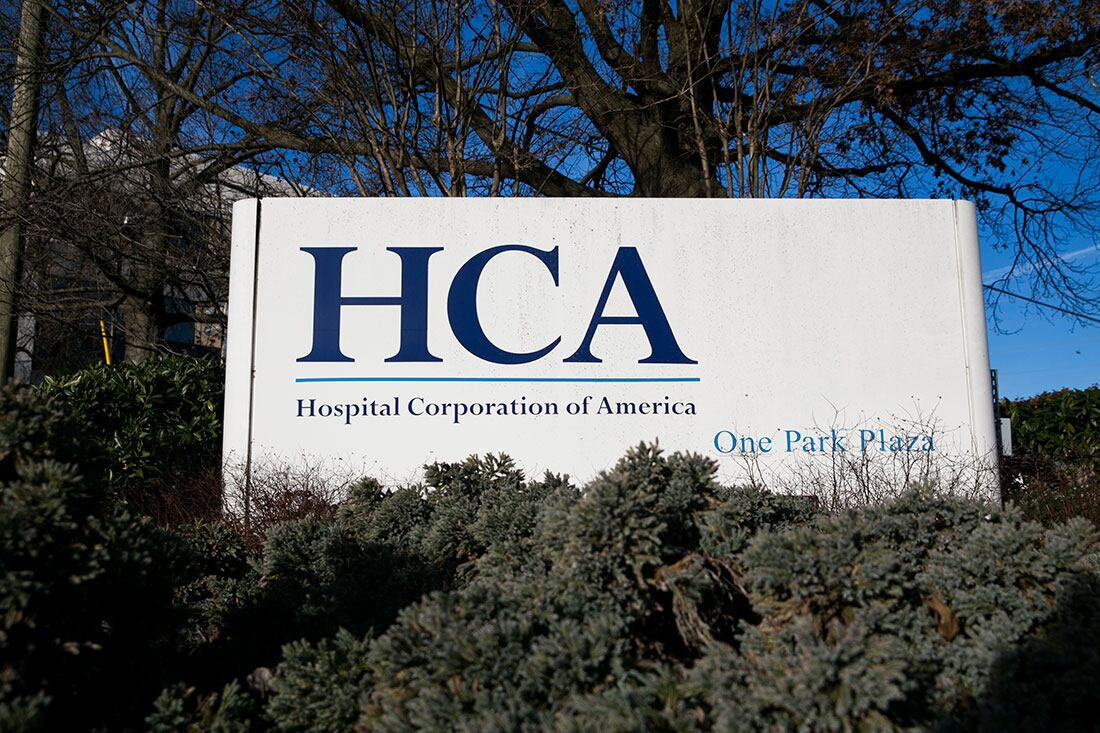
Last Tuesday, HCA, the largest investor-owned hospital system, released their Q4 2025 and year-end earnings and they’re impressive. The 190-hospital system reported:
Net income of $6.8 billion in 2025, a 17.8% increase year over year.
Revenue of $75.6 billion, a 7.1% increase year over year.
On a same facility basis, growth in revenue of 6.6%, equivalent admissions of 2.4% and net revenue per equivalent admission of 4.1% versus prior year.
For 2026, projected a net income between $6.5 billion and $7 billion and adjusted EBITDA between $15.6 and $16.5 billion on revenue between $76.5 billion and $80 billion.
CFO Mike Marks told the 16 analysts on the investor call “Consolidated adjusted EBITDA increased 12.1% over prior year, and we delivered a 90-basis point improvement in adjusted EBITDA margin. Cash flow from operations was $2.4 billion in the (4th) quarter and $12.6 billion for the year. This represents a 20% increase in operating cash flow in 2025 over full year 2024.”
And CEO Sam Hazen added “Let me add to just the whole resiliency agenda. This is not an episodic event for us. It just happens to be a maturation of what in my estimation is cultural within HCA, and that is being cost effective in finding ways to leverage scale, utilize best practices. Now we have tools… that are in front of us as opportunities to create even more consistency, efficiencies and transparency in the company’s overall cost. And that’s why the program is lining up in a well-timed manner with some of the enhanced premium tax credit challenges.
But we see this program continuing to mature. And as we get more capable at using these tools, it’s going to help us find even more opportunities. But this is not a onetime event. It’s a cultural dynamic in our company around being cost effective, being high quality and finding ways to improve from a process standpoint and a leverage standpoint with our overall scale.”
Shares of HCA closed at $488.27 last week, down from its peak at $527.55 (January27). Per MarketWatch, “shares of HCA Healthcare Inc rose $1.19% to $488.27 Friday on what proved to be an around grim trading session for the stock market, with the S&P Index falling 0.43% to 6939.03 and Dow (DJIA) falling 0.36% to 48,892.47. The stock demonstrated a mixed performance when compared to some of its competitors Friday, as Community Health Systems (CYH) rose 1.26% to $3.21 and Tenet (THC) fell 0.11% to $189.28.”
Hospital stock market analysts are keen to gauge how companies like these are navigating choppy waters for healthcare. It’s understandable: Healthcare is one of the 11 sectors that comprises the overall S&P 500 and is 9.6% of its weighting. Historically, the healthcare index had beaten the S&P (30-year average 9% vs. 8% overall) but in recent years, it has lagged largely because regulatory policy changes and healthcare budget volatility dampened investor confidence.
Investors are increasingly hedging their bets in healthcare services reasoning even market bell-weathers like HCA face headwinds. And that sentiment has profound impact on operators in not-for-profit health sectors like community and rural hospitals, nursing and home care and ancillary services like EMS, hospice care and others that see their credit-worthiness slipping and costs for debt capital increasing.
My take
HCA is not an exception. It is culturally geared to the business of running hospitals and amassing scale in its markets vis a vis outpatient services and physician relationships. It follows a playbook geared to earnings per share and strategic deployment of capital to optimize its ROC, and it rewards its leaders accordingly. These are not unique to HCA.
And, like other systems, HCA is a lightning rod for critics. Studies have shown for-profit hospitals lean on staffing, aggressive on procurement, concerning to physicians and increasingly problematic to private insurers. Those same studies have shown quality of care to be comparable and charity care to be at or above same-market competitors. But this discipline also enables a higher price to cost ratio, a better payer mix and pruning of clinical services where margins are thin. Again, leverage in payer contracts and high pricing are not unique to the HCA playbook. Some not-for-profit systems have done the same or better.
What’s unique for each system like HCA are 1-the markets in which they enjoy leverage by virtue of scale and 2-the aggressiveness whereby they use their leverage. Ownership status—not for profit vs. investor-owned—matters in some markets and organizations more than others. But market dominance by any system, and how it’s leveraged, is a differentiator.
Case in point: In Asheville NC, HCA’s Mission Health dominates. HCA paid $1.5 billion for the legacy Mission-St. Joseph’s system in 2019. Despite, difficult media coverage and 3 warnings from CMS about quality shortcomings, it’s profitable.
On December 10, 2025, I had quadruple by-pass surgery there. Over the course 2 ED visits in November, the 5-day inpatient stay and post-surgical interactions since, I had the opportunity to see its operations firsthand. The bottom line for me is this: HCA Healthcare is a successful business. It operates Mission aggressively and profitably. Every employee knows it. Staffing is lean. There are no frills. Coordination of care is a crap shoot: connectivity between offices, services, and physicians is limited; price transparency is a joke and care navigation for patients like me is haphazard. But all say patient care is not compromised as my surgical experience confirmed. Every hospital aspires for the same. All are trying to do more with less.
HCA’s financial success is not the exception in acute care, but it’s certain to draw attention to business practices that enable results like it enjoyed last year across the spectrum of hospital care. And it’s certain to intensify competition between hospitals to get the upper hand.
References in addition to citations in the sections that follow:
Businesses that held the line on tariff-related price increases last year might be passing more of those costs on to consumers at the start of 2026.
Why it matters:
The Trump administration is celebrating how little its huge levies have impacted inflation. But new signs indicate the policies are appearing with a lag, complicating their push to address affordability concerns.
Zoom out:
Many companies reassess pricing at the start of the year — one factor that historically makes January a month of above-average price increases.
Tariffs could be supercharging that historic trend: Companies might finally be raising prices to address the costs they ate throughout much of last year.
Adobe’s Digital Price Index rose by the most, month on month, in its 12-year history in January — even faster than at the height of the inflation shock in 2022.
“The strong increase could be a sign of greater tariff pass-through to start off the new year,” with large price changes for electronics, furniture, bedding and appliances, economists at UBS wrote in a note.
Yes, but:
The bank’s economists caution that the series can be volatile, and it was down sharply in November, so it could be a head fake.
State of play:
Official government inflation data for January is not scheduled to be released until next week, pending a government shutdown. Still, there’s other evidence that January could be a spicy month for price hikes.
The Institute for Supply Management’s manufacturing survey sub-index for prices ticked up to 59 in January, from 58.5, the highest since September.
Zoom in:
While there is still caution that higher prices could crimp demand, several references in the Federal Reserve’s compilation of anecdotal information from across the U.S. point to price increases in the new year.
In Atlanta, for instance, “many contacts expect to implement price increases in the first half of 2026 to preserve margins, especially those who held prices steady in 2025,” according to the most recent Beige Book.
The Philadelphia Fed notes that many businesses anticipated “tariffs to seep into general price levels.”
In a speech this morning, Richmond Fed president Tom Barkin said that he has spoken with about 75 companies since the start of the year, and described a dynamic within companies regarding price-setting.
“In boardrooms around the country, sales and finance teams are debating how aggressively to increase prices, for example, in the context of increased tariff-driven input costs,” Barkin said.
“If I can stereotype: Sales doesn’t want to pass through those costs at the risk of lost volume; finance doesn’t want to eat the cost at the risk of reduced margins,” Barkin said.
“I imagine some finance teams have done well recently (at least based on the increases I’ve seen in my streaming services and homeowners insurance),” he added.
What they’re saying:
“The Fed is telling us, ‘Don’t worry, the inflationary effects of [tariffs] will subside,’ but I am a little bit skeptical of that,” James Knightley, chief international economist at ING, told reporters in Washington, D.C., this morning.
“I do get the sense that there is some delay related to the Supreme Court decision — a lot of companies are hoping it will just disappear,” Knightley said, referring to a pending decision about the legality of the bulk of President Trump’s tariffs.
“There is a risk that costs end up getting passed along to you and I in time … it just will come through more slowly,” Knightley said.
As media attention focused on Minneapolis, Greenland and Venezuela last week, the Center for Medicaid and Medicare Services (CMS) released its 2024 Health Expenditures report Thursday: the headline was “Health care spending in the US reached $5.3 trillion and increased 7.2% in 2024, similar to growth of 7.4% in 2023, as increased demand for health care influenced this two-year trend. “
Less media attention was given two Labor Department reports released the Tuesday before:
Prices: The consumer-price index (CPI) for December came in somewhat higher than expected with an increase of 0.3% and 2.7% over the past 12 months. Overall inflation isn’t rising, but it also isn’t coming down.
Wages: The Labor Department reported average hourly earnings after inflation in the last year rose 0.7% during the first five months of this year, but real hourly earnings have declined 0.2% since May. They’re stuck.
Prices are increasing but wages for most hourly workers aren’t keeping pace. That’s why affordability is the top concern for voters.
Meanwhile, the health economy continues to grow—no surprise. It’s a concern to voters only to the extent it’s impacting their ability to pay their household bills. They don’t care or comprehend a health economy that’s complex and global; they care about their out-of-pocket obligations and surprise bills that could wipe them out.
As Michael Chernow, MedPAC chair and respected Harvard Health Policy professor wrote:
“The headline number, 7.2% growth in 2024, is concerning but hardly a surprise. It follows 7.4% growth in 2023. This rate of NHE growth is not sustainable. It exceeds general inflation and growth in the gross domestic product (GDP), pushing the share if GDP devoted to health care spending to 18% in 2024; the share of GDP devoted to health care is projected to rise to 20.3% by 2033. In fact, these figures may be an underestimate of the fiscal burden of the health care system because spending on some things, such as employer administrative costs, are not captured… Given all the attention to prices and insurer profits, it is important to note that those factors are not the main drivers of spending growth—this time, it’s not the prices, stupid. There was virtually no excess medical inflation (medical inflation above general inflation) for 2023 or 2024. In fact, prices for retail drugs (net of rebates) rose at a rate below inflation. There will certainly be cases of rising prices driving spending, but on average, price growth is not the problem. This does not mean high-priced products and services are not an important component of spending growth, but instead it implies that their contribution to spending growth on average stems from their greater use, not rising prices. The main driver of spending growth is greater volume and intensity of care…”
My take:
Since 2000 to 2024, total healthcare spending in the U.S. has been volatile:
2000–2007: High growth, typically 6–8% per year (driven by rising utilization and prices).
2008–2013: Growth slowed to 3–4% during and after the Great Recession.
2014–2016: Growth ticked up to 4.5–5.8% with ACA coverage expansion.
2017–2019: Moderation around 4.5%.
2020: COVID‑19 shock—growth slowed to ~2% due to deferred care.
2021: Rebound to ~4%.
2022: 4.8%, close to pre‑pandemic norms.
2023: 7.4%, fastest since 1991–92.
2024: 7.2%, reaching $5.3 trillion (18% of GDP)
Between 2000 and 2024, total health spending in the U.S. increased $3.9 trillion (279%) while the U.S. population grew by 58 million (20.4%). 2025 spending is expected to follow suit. The underlying reason for the disconnect between health spending and population growth is more complicated than placing blame on any one sector or trend: it’s true in the U.S. and every other developed system in the world. Healthcare is expensive and it’s costing more.
This is good news if you’ve made smart bets as an investor in the health industry but it’s problematic for just about everyone else including many in the industry who’ve benefited from its aversion to spending controls and cost cutting.
The current environment for the healthcare economy is increasingly hostile to the status quo. Voters think the system is wasteful, needlessly complicated and profitable. Lawmakers think it’s no man’s land for substantive change, defaulting to price transparency, increased competition and state regulation in response. Private employers, who’ve bear the brunt of the system’s ineffectiveness, are timid and reformers are impractical about the role of private capital in the health economy’s financing.
The healthcare economy will be an issue in Campaign 2026 not because aggregate spending increased 7-8% in 2025 per CMS, but because it’s no longer justifiable to a majority of Americans for whom it’s simply not affordable. Regrettably, as noted in Corporate Board Member’s director surveys, only one in five healthcare Boards is doing scenario planning with this possibility in mind.
Paul
P.S. The President released his Great Healthcare Plan last Thursday featuring his familiar themes—price transparency for hospitals and insurers, most favored pricing and elimination of PBMs to reduce prescription drug costs—along with health savings accounts for consumers in lieu of insurance subsidies. The 2-page White House release provided no additional details.
The bond market isn’t as responsive to Federal Reserve interest-rate policy as President Trump’s rhetoric might suggest. That makes the market a powerful check on the president.
We explore the tension — and what it means for this volatile week in geopolitics — below. 🏔
Plus, a dark horse to be the next Fed chair looks to be gaining ground. 🐎
Situational awareness:
The Commerce Department released shutdown-delayed data that showed solid growth in incomes and spending for October and November.
Consumption expenditures were up 0.5% both months (0.3% inflation-adjusted), pointing to steady underlying demand.
The Fed’s preferred inflation measure rose 0.2% both months, and in November was up 2.8% over the previous year.
Q3 GDP was revised slightly higher, to a 4.4% annual growth rate (from 4.3% previously), reflecting an upward adjustment to exports.
Trump really, really wantslower interest rates, and the Federal Reserve and other tools of state power have tried to deliver them. The bond market isn’t cooperating.
Why it matters:
Longer-term borrowing rates are set on global markets, as savvy players who together deploy trillions of dollars make bets on the future of growth and inflation.
In an era of vast power concentrated in the Oval Office, that makes it one of the few forces even Trump can’t control. It is a constraint on his actions that will not respond to insults or threats.
That, in turn, shows why the TACO trade — the bet that Trump Always Chickens Out when his rhetoric or actions start to ripple across global markets — has been in full force this week.
Driving the news:
Trump sees the Fed as the main mechanism to bring rates down. That was evident in his latest plea for lower rates, which he brought to the global stage yesterday in Davos, Switzerland.
“I’ll be announcing a new Fed chairman in the not-too-distant future. I think he’ll do a very good job,” Trump told a room of global CEOs and government leaders at the World Economic Forum.
“Problem is, they change once they get the job. You know they’re saying everything I want to hear and then they get the job … and all of a sudden, it’s ‘let’s raise rates a little.'”
Trump said he hopes his pick “does the right thing” with lowering rates. He later added that the U.S. should be paying “the lowest interest rate of any country in the world” on its debt “because without the United States, you don’t have a country.”
Reality check:
The Fed cut interest rates by a full percentage point in 2024 and another three-quarters of a percentage point in 2025. Yet longer-term borrowing costs are up in that time.
The day that rate-cutting began, Sept. 18, 2024, the 10-year U.S. Treasury yielded 3.7%. When the second wave of cutting began this past September, it was 4.06%.
This morning, the 10-year yield was 4.27%.
The rise in longer-term borrowing costs has happened for a mix of good reasons (higher growth prospects) and bad (higher inflation being priced in). But regardless, the swing shows the limit of the Fed’s ability to cater to the president’s wishes.
What they’re saying:
“The Fed doesn’t really set interest rates,” JPMorgan Chase CEO Jamie Dimon said in Davos.
“What happens if inflation goes up? They raise interest rates. What happens if inflation goes down? They reduce interest rates. They are a follower.”
Yes, but:
That doesn’t mean the president has no power over long-term interest rates. Tax and spending policy determines government deficits and, in turn, bond issuance and supply.
And this administration in particular has been creative in using the tools of government to try to encourage demand for longer-term securities, including directing Fannie Mae and Freddie Mac to buy hundreds of billions of dollars in mortgage bonds and tweaking regulations to encourage banks to hold more Treasuries.
Fed appointments also matter — though not necessarily in the way Trump emphasizes. A key to longer-term rates remaining low is investor confidence that the Fed will do what it takes to prevent inflation from taking off — even if that means rate increases in the near term.
Between the lines:
Last April, a bond market sell-off was a big factor in Trump backing away from “Liberation Day” tariffs.
This week’s threats of military force against Greenland and new tariffs on Europe — followed by backtracking — seemingly had echoes of that episode.
Treasury Secretary Scott Bessent, however, said on a podcast that “the bond market didn’t change the calculus” and that “President Trump always knew where he was going.”
As media attention focused on Minneapolis, Greenland and Venezuela last week, the Center for Medicaid and Medicare Services (CMS) released its 2024 Health Expenditures report Thursday: the headline was “Health care spending in the US reached $5.3 trillion and increased 7.2% in 2024, similar to growth of 7.4% in 2023, as increased demand for health care influenced this two-year trend. “
Less media attention was given two Labor Department reports released the Tuesday before:
Prices: The consumer-price index (CPI) for December came in somewhat higher than expected with an increase of 0.3% and 2.7% over the past 12 months. Overall inflation isn’t rising, but it also isn’t coming down.
Wages: The Labor Department reported average hourly earnings after inflation in the last year rose 0.7% during the first five months of this year, but real hourly earnings have declined 0.2% since May. They’re stuck.
Prices are increasing but wages for most hourly workers aren’t keeping pace. That’s why affordability is the top concern for voters.
Meanwhile, the health economy continues to grow—no surprise. It’s a concern to voters only to the extent it’s impacting their ability to pay their household bills. They don’t care or comprehend a health economy that’s complex and global; they care about their out-of-pocket obligations and surprise bills that could wipe them out.
As Michael Chernow, MedPAC chair and respected Harvard Health Policy professor wrote:
“The headline number, 7.2% growth in 2024, is concerning but hardly a surprise. It follows 7.4% growth in 2023. This rate of NHE growth is not sustainable. It exceeds general inflation and growth in the gross domestic product (GDP), pushing the share if GDP devoted to health care spending to 18% in 2024; the share of GDP devoted to health care is projected to rise to 20.3% by 2033. In fact, these figures may be an underestimate of the fiscal burden of the health care system because spending on some things, such as employer administrative costs, are not captured… Given all the attention to prices and insurer profits, it is important to note that those factors are not the main drivers of spending growth—this time, it’s not the prices, stupid. There was virtually no excess medical inflation (medical inflation above general inflation) for 2023 or 2024. In fact, prices for retail drugs (net of rebates) rose at a rate below inflation. There will certainly be cases of rising prices driving spending, but on average, price growth is not the problem. This does not mean high-priced products and services are not an important component of spending growth, but instead it implies that their contribution to spending growth on average stems from their greater use, not rising prices. The main driver of spending growth is greater volume and intensity of care…”
My take:
Since 2000 to 2024, total healthcare spending in the U.S. has been volatile:
2000–2007: High growth, typically 6–8% per year (driven by rising utilization and prices).
2008–2013: Growth slowed to 3–4% during and after the Great Recession.
2014–2016: Growth ticked up to 4.5–5.8% with ACA coverage expansion.
2017–2019: Moderation around 4.5%.
2020: COVID‑19 shock—growth slowed to ~2% due to deferred care.
2021: Rebound to ~4%.
2022: 4.8%, close to pre‑pandemic norms.
2023: 7.4%, fastest since 1991–92.
2024: 7.2%, reaching $5.3 trillion (18% of GDP)
Between 2000 and 2024, total health spending in the U.S. increased $3.9 trillion (279%) while the U.S. population grew by 58 million (20.4%). 2025 spending is expected to follow suit. The underlying reason for the disconnect between health spending and population growth is more complicated than placing blame on any one sector or trend: it’s true in the U.S. and every other developed system in the world. Healthcare is expensive and it’s costing more.
This is good news if you’ve made smart bets as an investor in the health industry but it’s problematic for just about everyone else including many in the industry who’ve benefited from its aversion to spending controls and cost cutting.
The current environment for the healthcare economy is increasingly hostile to the status quo. Voters think the system is wasteful, needlessly complicated and profitable. Lawmakers think it’s no man’s land for substantive change, defaulting to price transparency, increased competition and state regulation in response. Private employers, who’ve bear the brunt of the system’s ineffectiveness, are timid and reformers are impractical about the role of private capital in the health economy’s financing.
The healthcare economy will be an issue in Campaign 2026 not because aggregate spending increased 7-8% in 2025 per CMS, but because it’s no longer justifiable to a majority of Americans for whom it’s simply not affordable. Regrettably, as noted in Corporate Board Member’s director surveys, only one in five healthcare Boards is doing scenario planning with this possibility in mind.
Paul
P.S. The President released his Great Healthcare Plan last Thursday featuring his familiar themes—price transparency for hospitals and insurers, most favored pricing and elimination of PBMs to reduce prescription drug costs—along with health savings accounts for consumers in lieu of insurance subsidies. The 2-page White House release provided no additional details.
The 119th Congress headed into the holidays no doubt looking forward to quality time with their loved ones and a fat goose on the dinner table—or whatever the privileged stewards of the People eat at Christmas—with what seemed like little concern for the mess and panic they left behind. Messy panic like what the nearly 25 million Americans getting their health insurance through the ACA are facing as their monthly premiums increase at astronomical rates. (Assuming they stick with the devil they know.) Now they’re back, surely refreshed with all engines blazing on their New Year’s resolution to make health care more affordable. It is, after all, what the People want.
But while what to do with the ACA gets fought over like an unloved middle child in a divorce, another form of health care dupery will continue to operate like a mob-run casino.
Many of us navigate our health care thinking that if we can land a full-time job at a company offering benefits, we—and our families—will be covered for most physical and mental health issues without complete disruption to our financial health. And in many cases, sure, that tracks. What we’re not seeing is the financial fleecing that those companies are experiencing at the hands of third-party administrators (TPAs). What’s more is that the companies aren’t seeing it either. And that’s not a bug. It’s a feature.
An employer has options when deciding how to provide health benefits to its employees. One is to contract directly with an insurance company and pay fixed premiums. Another is to self-insure. Self-insured employers pay for all enrolled member benefits and claims directly from their own funds instead of paying those aforementioned fixed premiums. It’s an attractive option for employers because even though the company assumes the financial risk, it offers control over costs, plan design and claims-related data, all of which can help the company run more efficiently and with greater fiduciary understanding. They’re popular, too, with approximately 57% of private sector workers enrolled in these self-funded plans, according to KFF. To facilitate the company’s coverage, employers contract with a TPA to broker plan details, manage claims, pay providers, assist plan members and ensure the benefit program remains compliant with state and federal regulations.
This is theoretical.
TPAs say they’re looking after the company, but they don’t. They’re looking after themselves and their parent companies. And just who are these parents? Blue Cross Blue Shield, UnitedHealthcare, Cigna, and Aetna. Or, as they’re collectively called, the BUCAs. The usual suspects in the web of health care greed and deception.
It’s like taking a pregnancy test then being told the results can’t be shared with you because the results belong to the stick with the pee on it.
Skimming the till the TPA way
The Employee Retirement Income Security Act (ERISA) was passed in 1974 to protect patients by requiring transparency, fiduciary standards and fair claims processes for employer-sponsored health (and retirement) plans. TPAs have found clever ways to avoid ERISA accountability in the way they structure the administrative services agreements (ASAs) they sign with employers. One is by enlisting gag clauses in the ASAs to protect TPAs from showing their work to the employer, which obviously defeats the whole purpose of choosing to self-fund and have more oversight of how their money is being spent. The Consolidated Appropriation Act of 2021 prevented these gag clauses. But TPAs are nimble and clever, and when pressed to offer up information, such as any of the data related to claims managed and paid, TPAs argue they don’t have to because the data is proprietary. It’s an odd argument to make. It’s the employer’s money being spent and their employees being treated. It’s like taking a pregnancy test then being told the results can’t be shared with you because the results belong to the stick with the pee on it.
Not sharing crucial plan information with the employer is one thing, tacking on fees under the guise of good stewardship is another. Like the overpayment recoupment fee. Here’s how this could play out:
The TPA discovers a provider was overpaid due to an error made by duplicating payments, incorrect coding, or any other administrative whoopsie
The TPA recoups the overpaid amount, say, $5,000, then takes a percentage of the recouped money—typically 30% — as a fee for cleaning up the mess they made
They recover the extra $5,000 the employer paid, the employer gets back $3,500 while the TPA banks $1,500
This means that the employer paid a total of $6,500 on a $5,000 claim, making carelessness an incentive for TPAs
Shared savings fees are put in play when someone enrolled in a health plan uses an out-of-network (OON) provider. As we know, OON claims are often hefty bills. Seemingly, in good faith, the TPA will negotiate a discounted rate with the provider. It could look like this:
The OON provider bills the employer $50,000
The TPA negotiates the provider down to $20,000 then takes their shared savings fee out of the $30,000 savings
Again, this fee rate is often around 30%. That puts $9,000 in the TPA’s pocket
The TPA is incentivized here to push members to go OON, and why not? A $30,000 savings sounds real good. But employers aren’t getting the opportunity to weigh in on these negotiations because they are, you know, “proprietary.”
Putting it honestly, TPAs are the neighborhood mafioso.
TPAs also have skip lists, which are providers they do not apply oversight to when looking for billing errors, which they rarely do anyway, but these lists make it more, um, official. In May 2024, W.W. Grainger, Inc., a product distribution company with 20,000-plus employees (and their family members) filed a lawsuit against Aetna claiming Aetna took money paid by Grainger intended to pay for claims, paying providers only a portion of the money, keeping the rest for itself. The suit claims, “Aetna did not use the fraud prevention techniques it regularly employs when administrating claims for its own fully insured plans. Aetna never refunded or credited the difference to the Plans.” The suit further states, “Aetna also engaged in active deception to conceal its breaches of its duties to the Plans. Aetna prevented Grainger from discovering Aetna’s improper conduct, including by limiting audit rights, providing false or inaccurate claims reports, and preventing Grainger from obtaining or accessing data about the actual financial transactions between Aetna and the health care providers.”
Many other similar suits have been filed against TPAs but are either dismissed or held up in the court’s web of confusion and legal ballet.
The uphill battle for Capitol Hill
Putting it kindly, TPAs are middlemen sold as a way to lighten the administrative load for a company. Putting it honestly, TPAs are the neighborhood mafioso. Imagine with me, a neighborhood dry cleaner… One day, a wise guy walks in and tells the owner that he needs to pay 30% of the profits each week in exchange for protection. “Protection from what?” the dry cleaner asks. “From, you know, trouble. And you don’t want any trouble. Not at a nice establishment such as this.” There’s no way the dry cleaner can win. Either pay the guy or risk going to open the door one morning only to discover the door is the only thing left standing after the place mysteriously burned down overnight.
A bill introduced last year by Senators John Hickenlooper (D-Colo.) and Roger Marshall (R-Kan.) called the Patients Deserve Price Tags Act (PDPTA) is designed to make health costs more transparent and provide employers with better tools to hold TPAs accountable as well as to strengthen and expand existing transparency measures like requiring TPAs to disclose compensation practices truthfully, completely and upfront instead of leaving the burden to employers. The bill would make void any provisions in ASAs that support limiting access to employers. Furthermore, it would empower the Department of Labor (DOL) to fine TPAs $10,000 for each day a violation continues. TPAs would also be required to make quarterly reports detailing pricing and compensation practices and report the total they have been paid in rebates, fees, discounts and other forms of payment. Failure to provide this information would be a violation of ERISA, and the DOL could fine the TPA $100,000 per day until the report is provided.
But will it pass? And if so, how much of it will get hacked away thanks to BUCA lobbying efforts? And is another bill even the answer? Legislation has been passed to defend against these practices, and yet, they persist. Apparently, doing the same thing over and over again and expecting a different result is not insanity, but progress for Congress. Another bill may just add to the complexity of things. And the big question remains: Will it save self-insured employers money? Doubtful. TPAs can simply raise the price of doing business. That’s BUCA forecasting 101—everything can always be more expensive.
Perhaps Washington needs to begin thinking of TPAs and BUCAs like the organized criminals they are and bring a RICO case against them.
The U.S. economy was beaten and battered in 2025, and powered ahead despite it all.
The big picture:
The question for 2026 is whether the underlying sources of weakness that are already evident will broaden out into something that threatens to undermine its overall resilience.
Threat level:
Beneath buoyant growth in GDP and asset prices are serious worries.
The labor market is looking softer by the month.
Elevated inflation is pinching family budgets.
And fears are rising that the AI-fueled boom could leave ordinary workers worse off.
The big picture:
Those pain points have already caused public opinion on the economy to turn sharply negative.
At the same time, one lesson of 2025 is that the U.S. economy is awfully adaptable and can withstand more challenges than you might expect.
Zoom in:
In April, President Trump’s “Liberation Day” tariffs sent the stock market swooning and economists upgrading their recession odds.
It wasn’t the only sign of trouble. Job growth came to a near-halt over the summer. Deportations and restrictionist immigration are part of the story, along with the aging of the native-born workforce. But part of it is that companies are trying to get leaner.
Inflation, meanwhile, has become the fire that will not be fully doused. While the sky-high inflation of 2022 is a thing of the past, inflation has been above the Federal Reserve’s target 2% target every single month since March 2021.
Affordability is top of mind in public opinion.
Reality check:
It’s important to remember, though, that the $30 trillion U.S. economy, for all its flaws, can weather a lot, at least at the macro level. It is, as RSM chief economist Joe Brusuelas puts it, a “dynamic and resilient beast.”
By the numbers:
The headline data numbers have held up just fine, a trend punctuated by Tuesday’s report that GDP rose at a 4.3% annual rate in Q3, amid strong consumer spending and the AI-investment surge.
The S&P 500 is up more than 17% so far this year.
The unemployment rate edged up over the course of the year, to 4.6% in November. But that’s still lower than it has been in 69% of months dating back to 1948.
Yes, but:
You can’t eat GDP, or points of the S&P. And the biggest issues for the U.S. economy — and the things that look like pre-eminent risks for 2026, are in what you might call the peripheral data.
While layoffs are still few, employers have slowed their hiring rates, which means those who do lose their jobs face hard sledding.
Job creation has been overwhelmingly driven by health care, with usual cyclical sectors like manufacturing and transportation and warehousing shedding jobs.
Consumer demand is displaying “K-shaped” trends, being highly concentrated among the affluent Americans enjoying surging stock wealth — while the household finances of lower earners are increasingly on a razor’s edge.
What they’re saying:
The fact that strong third-quarter GDP growth coincided with weak job creation, Brusuelas writes in a note, “implies a decoupling between robust topline growth and soft jobs creation which in our estimation is likely to be the major economic narrative looking forward into 2026.”
What we’re watching:
The 2026 economy is set to receive a boost from Washington, as the signature tax law passed in July — the One Big, Beautiful Bill Act — acts as a fiscal stimulus alongside the delayed impact of the Federal Reserve three interest-rate cuts since September.
It’s hard for companies to experience the kind of robust demand for goods and services they’ve seen in 2025 and not eventually have to hire more workers to help fulfill it.
The bottom line:
There are plenty of risks on the horizon for 2026, but the economy’s striking resilience in 2025 is a reminder that doom-and-gloom predictions for the U.S. economy often prove wrong.