It has been well documented that a small portion of Medicare patients — just 10 percent — account for more than half the program’s spending in any given year. But how many of these patients continue to incur high costs over time? Using three years of Medicare claims data (2012–2014), Commonwealth Fund–supported researchers sought to determine the share of patients with persistently high costs, as well as the key traits that differentiate them from those who incur high costs in only one or two years — or never.
What the Study Found
More than one-quarter (28%) of patients who had high costs in 2012 remained persistently high-cost over the subsequent two years, while 72 percent were transiently high-cost — for one or two years.
Persistently high-cost patients were younger (66.4 years) than either the transiently high-cost (73.3 years) or never high-cost (70.5 years) patients. They were also more likely to be members of racial and ethnic minorities, eligible for Medicaid in addition to Medicare, and qualify for Medicare because of end-stage renal disease.
On average, in the first year, persistently high-cost patients spent $64,434, compared with $45,560 for the transiently high-cost and $4,538 for the never high-cost.
Persistently high-cost patients spent more in all categories of spending. Notably, they spent more than four times as much as transiently high-cost patients did in outpatient settings ($16,148 v. $4,020) and on drugs ($15,467 v. $3,841).
The Big Picture
The 28 percent of Medicare beneficiaries with persistently high costs represent slightly less than 3 percent of the overall Medicare population but account for nearly 20 percent of Medicare spending for the three years studied. Only 5 percent of their total spending was related to potentially preventable hospitalizations, suggesting that it may be of little benefit to focus efforts on reducing such incidents.
The Bottom Line
Medicare patients who incur high costs over several years spend more on outpatient care and medications than those with lower costs. Targeting interventions on those two areas could help reduce overall spending.
As high health costs squeeze employers, managed care is making a comeback.
Nineties throwbacks have swept through music, television and fashion. Some startups want to bring a bit of that vintage feel to your workplace health insurance plan.
Health maintenance organizations drove down costs but were painted as villains in that decade for limiting patient choice, rationing care and leaving consumers to grapple with high bills for out-of-network services. But some features of the plans are regaining currency. Companies reviving the model say that new technology and better customer service will help avoid the mistakes of the past.
Rising health-care costs and dissatisfaction with high-deductible plans that ask workers to shoulder more of the burden are pushing employers to consider new ways of controlling spending—and to rethink the trade-offs they’re willing to make to save money.
Medical costs have increased roughly 6 percent a year for the past half-decade, according to PwC’s Health Research Institute, outpacing U.S. economic growth and eroding workers’ wage gains. Some employers, such as Amazon.com Inc., Berkshire Hathaway Inc. and JPMorgan Chase & Co.—wary of asking workers to pay even more—are trying to rebuild their health programs.
Barry Rose, superintendent of the Cumberland School District in northern Wisconsin, went shopping recently for a new health plan for the district’s 290 employees and family members after its annual coverage costs threatened to top $2 million.
“How do we provide quality, affordable and usable health care for employees,” said Rose. “I can’t keep taking money out of their paychecks to spend on health insurance.”
The company he picked, called Bind, is part of a new generation of health plans putting a tech-savvy spin on cost controls pioneered by HMOs.
Bind, started in 2016, ditches deductibles in favor of fixed copays that consumers can look up on a mobile app or online before heading to the doctor. Another upstart, Centivo, founded in 2017, uses rewards and penalties to nudge workers to get most of their care and referrals for specialists from primary-care doctors.
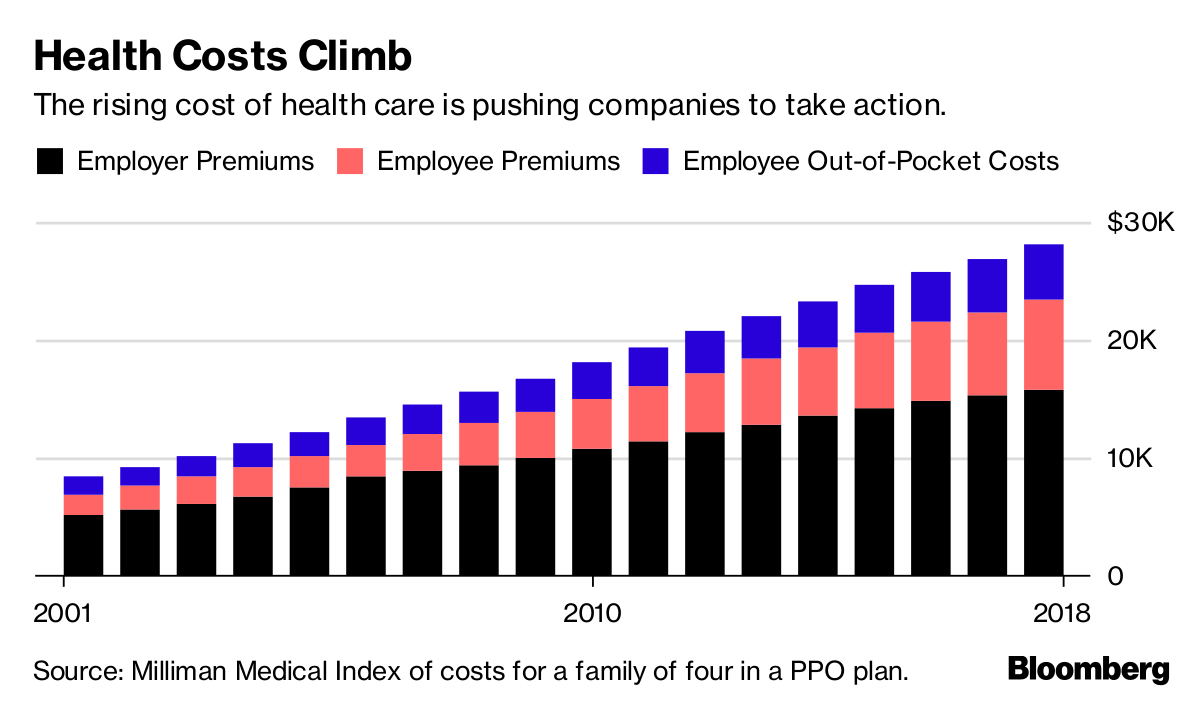
Health Costs Climb
The rising cost of health care is pushing companies to take action.
For many years, employers offered health plans that paid the bills when workers went to see just about any doctor, imposing few limits on care. The companies themselves usually paid much or all of the premiums.
Confronted with rising costs in the 1990s, many employers switched to HMOs or other forms of what became known as managed care. The switch worked, helping hold health costs down for much of the decade.
Soon, however, consumer and physician opposition grew amid horror stories of mothers pushed out of the hospital soon after childbirth, or patients denied cancer treatments. States and the federal government passed laws to protect consumers, and, in 1997, then-President Bill Clinton appointed a panel to create a health consumers’ Bill of Rights.
“The causes of the backlash are much deeper than the specific irritations or grievances we hear about,” Alain Enthoven, the Stanford health economist who helped pioneer the idea of managed care, said in a 1999 lecture. “They are first, that the large insured employed American middle class rejects the very idea of limits on health care because they don’t see themselves as paying for the cost.”
Workers would soon bear the cost, though. By the end of the decade, employers had moved away from these limited health plans. In their wake, costs skyrocketed, giving rise to a new cost-containment tool: high deductibles.
Centivo co-founder Ashok Subramanian spent the past decade trying to figure out how to offer better health insurance at work. His first startup, Liazon, helped workers pick from a big menu of coverage options. He sold it for some $215 million to Towers Watson in 2013, but he said it didn’t fix the bigger problem: Workers had lots of options, but none of them were very good.
“Yes, we were increasing choice, yes we were enabling personalization, but the choices themselves were not that good,” Subramanian said in an interview. “The choices themselves were predicated on a system in which the fundamental incentives in health care are broken.”
Tony Miller, Bind’s founder, helped give rise to health plans with high out-of-pocket costs. He sold a company called Definity Health that combined health plans with savings accounts to UnitedHealth Group Inc. for $300 million in 2004. He now says high-deductible plans failed to deliver on their promises.
“There’s a fever pitch of frustration at employers,” he said. “They’re tired of using the same levers that they’ve been using for the past 20 years.”
UnitedHealth, the biggest U.S. health insurer, helped create Bind with Miller’s venture capital firm and is an investor in the company, which has raised a total of $82 million. Bind is also using UnitedHealth’s network of doctors and hospitals as well as some of its technology.
Centivo has raised $34 million from investors including Bain Capital Ventures.
Centivo and Bind both promise to reduce costs for patients and employers while making it easier to find doctors and check coverage. They say they’ll reduce costs by making sure patients get the care they need, keeping them healthy and avoiding emergencies or unnecessary treatment.
Covered?
The proportion of Americans under 65 in health plans with high deductibles continues to increase.
In most cases, workers who follow the rules of Centivo’s plans won’t face a deductible. When signing up, employees pick a primary-care doctor, who’s responsible for managing their care and making decisions on whether they need to see a specialist. Care provided or directed by that primary physician is free, as is some treatment for chronic diseases such as diabetes, depending on how employers choose to set up the coverage.
The goal is to ensure workers get the care they need, while avoiding low-value treatments. Those who go to an emergency department in cases that aren’t true emergencies, for example, could face high costs.
“The big question is: Is the market ready for it?” said Mike Turpin, who advises employers on their health benefits as an executive vice president at USI Insurance Services. “The American consumer just has it built into their head that access equals quality.”
Bind bundles its coverage so consumers don’t get billed for lots of charges for services that are part of the same treatment. In Rose’s district, the copay for an emergency room visit is $250, while the cost of a hospital stay is capped at $1,000. Office visits are $35; preventive care is free.
Bind also offers what it calls on-demand insurance. Coverage for planned procedures such as knee surgery, tonsil removal or bariatric surgery must be purchased before the operation. That gives Bind a chance to push customers toward a menu of lower-cost alternatives or cheaper providers.
A patient who looks up knee arthroscopy, for instance, would also be offered physical therapy. The patient’s cost for the surgery ranges from $800 at an outpatient center to more than $6,000, in an example used by Miller. Surgeries in hospitals are typically more costly. Bind also charges more for providers who tend to be less efficient or have worse outcomes.
The ability to view costs upfront is part of what appealed to Rose, the Wisconsin superintendent. “Each of my employees knows exactly what they’re paying for, and they have choice in it,” he said.
Rose said the switch to Bind will save his district several hundred thousand dollars, depending on how much health care his workers need over the next year.
Lawton R. Burns, director of the Wharton Center for Health Management and Economics at the University of Pennsylvania, recently authored a paper with his colleague Mark Pauly arguing that it’s probably impossible to simultaneously improve quality, lower costs and achieve better health outcomes. The ideas now being pushed forward, he writes, are similar to ideas tested in the 1990s.
“It’s deja vu all over again,” he said. “It’s not clear to me, this is just me talking, that people have learned the lessons of the 1990s.”
Value-based payment (VBP) models are an effort to rein in the growth of health care costs and improve quality. However, it’s unclear what overall impact VBP models are having on health care costs. Even though health care is provided at the local level, most evaluations examine health care spending at the national level. To address this disconnect, we conducted quantitative and qualitative market-level assessments. Our goals were to examine the impact of population-based, value-based care within a market; identify what measurable factors were associated with differing costs; and understand how business leaders are thinking about value-based care and cost reduction.
Leavitt Partners, the Healthcare Financial Management Association (HFMA), and McManis Consulting, with participation from Mark McClellan at Duke University, conducted three mixed-methods studies:
“Market Factors Associated with Medicare Costs and Cost Growth” examined which market factors are correlated with PBPY health care costs and cost growth within a market using growth curve modeling. The study used and aggregated multiple data sets from public and private sources.
Based on data from 2015, there was no association between an increase in population-based VBP and slowing of health care costs in a given market. Our study did not include episode-based payments.
Health care leaders across markets believe further changes to payment and delivery models are coming. Less clear is what, or who, will be the catalyst to push further change.
Some stakeholders expressed stronger support for other types of VBP models, including episode-based models and models that address the needs of specific patient groups.
The question of “what type of competition” in a market may be more important than “how much” competition. Lower-cost markets featured competition among a few health systems with well-aligned physician practices and geographic coverage across their market.
Lower-cost markets appear to benefit from organized mechanisms, including state-sponsored or endorsed reporting agencies, for more transparent sharing of information on provider quality and costs.Based on quantitative and qualitative evidence, the studies contribute to our understanding of the dynamics of competition, integration, and transparency on health care costs in a market. Below, we summarize findings from the three mixed-method studies and provide some policy implications.
Population-Based VBP Models Are Not Lowering Market-Level Health Care Costs … Yet
Given the growth of VBP, we wanted to examine whether, in the first few years following the ACA, these models were influencing the total cost of care. We used Medicare data from 2012 to 2015 and commercial data from 2012 to 2014 to assess the early impact of these models. We restricted our study to population-based VBPs, which included models with upside risk only (shared savings), both upside and downside risk, and global budgets, but excluded episode-based (bundled) payments.
We did not find a statistical relationship between the level of penetration of population-based VBPs in a market and a decline in health care costs for Medicare or commercial payers. Nor did we find an improvement in quality. When we limited our analysis to just those markets with higher levels of population-based VBP penetration (at least 30 percent), our results suggested a very modest, not statistically significant, market-level decrease in cost growth. Despite this null finding, our results provide an important baseline for future research.
Possible Explanations
There are several potential explanations for the null findings. For one, our study period (2012–15) may simply have been too early to see signs of population-based VBP lowering health care costs. Although today 561 MSSP accountable care organizations (ACOs) (the largest of Medicare’s ACO programs) cover 10.5 million beneficiaries, at the beginning of our study period in 2012 and 2013, only 220 MSSP ACOs covered 3.2 million beneficiaries. Many interviewees told us not enough lives were covered under VBP. Indeed, in some markets, less than 1 percent of lives were part of a VBP arrangement.
Second, although participation in population-based VBP models is growing, few models involve the provider taking on downside risk. As of 2018, the majority (82 percent) of MSSP ACOs were in the non-risk-bearing Track 1, which means they share in savings if they spend less money than their assigned benchmark, but they will not incur financial losses if they spend more than the benchmark. Our site visits found that although different markets had varying levels of population-based VBP activity, no market had significant numbers of providers participating in downside risk. Several interviewees stressed the need to take incremental steps to more risk.
Fee-for-service payment remains quite profitable for many providers and health systems. Even for those that have begun to take on risk-based contracts, fee-for-service payment represents the majority of total revenue. As long as the status quo remains lucrative, it’s difficult to make the business case for why a provider should undertake the effort to switch to a value-based focus that may lead to a reduction in use and total revenue.
Still, several interviewees said they believed the move toward paying for value would continue, even if there’s some uncertainty over whether Medicare or private payers will lead the movement. It’s possible that when VBP models outweigh fee-for-service payments in a market, we’ll reach a “tipping point” and health care cost growth will decline. Many interviewees expressed enthusiasm for other VBP models, such as those based on episodes of care (bundled payments) and those designed for specific populations (for example, the frail elderly). These models may make more sense for specialty providers who perform a certain type of procedure or care for a certain type of patient.
Other Market Factors
If these initial population-based VBPs results don’t show a relationship to health care cost growth, then which market-level factors do correlate? For our second quantitative analysis, we used a variety of public and private data sources to examine the relationship among several market-level factors beyond value-based payment and Medicare costs and cost growth between 2007 and 2015. All the factors together explained 82 percent of variation in baseline Medicare costs (Exhibit 1).
The prevalence of chronic diseases was the most influential predictor of market costs, accounting for 41.5 percent of the variance. Hospital quality metrics, market socioeconomic status, and the concentration of hospitals and insurers also helped explain market-level costs.
Using these same factors to predict Medicare cost growth was less fruitful, explaining only 27 percent of the variation in Medicare cost growth—substantially less than the 82 percent of baseline costs. As Exhibit 2 shows, a much weaker association exists between chronic disease prevalence and Medicare cost growth. Significant additional research should be done to identify factors that predict cost growth.
These findings matter for several reasons. First, they reinforce efforts currently underway to contain costs, including strategies to prevent and better manage chronic conditions, reduce hospital readmissions, and reduce the number of individuals without insurance. Second, although we know less about what drives health care cost growth in a market, meaningfully reducing spending in a market relies on developing strategies that target cost growth, instead of baseline costs. More research that focuses on what’s driving cost growth is needed.
The Role Of Competition And Transparency On Costs
The interviews we conducted add insights into these market-level findings. We identified two distinguishing characteristics of higher- and lower-cost markets: type of competition in the market and degree of transparency in the market. We recognize that while there are some common lessons, health care markets differ significantly and their approaches to care, costs, and VBP models will vary.
Competition
We know competition can help drive down costs and increase quality in health care markets. However, how much competition, and what type, seems to make a difference. For example, we found that the lower-cost markets in our nine site visits had at least one integrated delivery system. Consolidation in these markets had resulted in two to four health systems with geographic coverage across the market. In these markets, physicians were generally employed by the health system or worked in close alignment with it. Health plan competition matters as well, particularly with respect to innovation in new payment and care delivery models. Portland, Oregon, and Minneapolis-St. Paul, Minnesota, two of the lowest-cost markets, both had competitive health plan landscapes.
Conversely, the markets we visited with less integration and seemingly more provider competition actually had higher costs. These included Los Angeles, California (which had higher Medicare costs only), Baton Rouge, Louisiana, and Oklahoma City, Oklahoma. One reason for this may be that there is less focus on addressing unnecessary use in these markets.
Transparency
Transparency is often cited as a strategy that will help contain costs. Similar to competition, the type of transparency effort matters. We found that some lower-cost markets seemed to benefit from organized transparency mechanisms, including state-sponsored or endorsed reporting agencies and employer coalitions that made information on provider quality and costs publicly available. For example, in 2005, the Minnesota Medical Association and health plans in the state together formed MN Community Measure, a nonprofit organization tasked with the collection and dissemination of data on the quality and cost of providers across the state. Today, providers are required to submit data to the organization. Our interviewees expressed optimism but acknowledged more work is needed to optimize consumer-oriented transparency tools, which research has so far shown to have had only minimal use.
Policy Recommendations
Our research led us to three primary policy recommendations to help improve health care quality and lower costs (for additional ones, see the fullstudies).
Continue movement toward payment models that increase financial incentives to manage total cost of care and closely monitor the impact of doing so because our findings show that the majority of payments in a market continue to flow through fee-for-service, instead of value-based arrangements. Experiments should continue with population-based VBP models but should not be confined exclusively to these models. Episode-based payment models, for example, may be better suited to certain types of providers who perform a certain procedure (for example, a knee replacement) instead of care for a general population of patients.
Balance the benefits of competition with the benefits of integration. The lower-cost markets we studied had competition among two and four systems with well-organized provider networks that had been developed through vertical integration or strong alignment of physician practices. Most of the lower-cost markets also had an integrated delivery system—with vertically integrated health plan, hospital, and physician capabilities—as a competitor in the market.
Support more transparent sharing of information on health care cost and quality within markets. Lower-cost markets in the qualitative study had organized mechanisms for the sharing of information on health care cost and quality, whether through employer coalitions, statewide reporting agencies, or both.
Although differences exist among each health care market, all markets can act to improve quality and reduce costs. Our studies suggest several actions different stakeholders in each market can take to improve care for their populations.
Ambulatory healthcare and hospitals saw biggest March gains in within the sector.
The latest employment numbers released by the federal government indicate that healthcare remains among the major industry sectors driving jobs growth.
More than 22,000 healthcare jobs were added in March, keeping roughly in line with the average number of healthcare jobs added for each of the past 12 months, according to data released Friday by the Bureau of Labor Statistics (BLS).
Within healthcare, the largest gains were among ambulatory healthcare services (16,000 jobs) and hospitals (10,000 jobs). Nursing and residential care facilities, meanwhile, lost nearly 4,000 jobs in March.
These overall numbers are not surprising. Healthcare occupations were projected to grow by 18%, or 2.4 million jobs, from 2016 to 2026, according to BLS analysis. The strength of the healthcare sector is attributed largely to the aging U.S. population, which drives demand for services.
But this rising demand coincides also with rising healthcare spending, which is projected to grow by 5.5% each yearthrough 2026, outpacing American spending in other sectors.
A study of why the United States spends so much more on health care than in other high-income countries concludes that higher prices — particularly for doctors and pharmaceuticals — and higher administration expenses are predominantly to blame. U.S. policy must focus on reducing these costs in order to close its spending gap with other countries.
The Issue
Prices of labor and goods, including pharmaceuticals, and administrative costs appeared to be the major drivers of the difference in overall cost between the United States and other high-income countries.
Health care spending in the United States greatly exceeds that in other wealthy countries, but the U.S. does not achieve better health outcomes. Policymakers commonly attribute this spending disparity to overuse of medical services and underinvestment in social services in the U.S. However, there has been relatively little data analysis performed to confirm that assumption. Writing in JAMA, researchers led by former Commonwealth Fund Harkness Fellow Irene Papanicolas and mentor Ashish Jha, M.D., report findings from their study comparing the U.S. with 10 other high-income countries to better understand why health care spending in the U.S. is so much greater.
Key Findings
The U.S. continues to spend more on health care. In 2016, the U.S. spent 17.8 percent of its gross domestic product (GDP) on health care, while the average spending level among all high-income countries was 11.5 percent of GDP.
The U.S. has lower rates of insurance coverage. While health coverage in the U.S. has risen to 90 percent since enactment of the Affordable Care Act, every other high-income country has achieved coverage for at least 99 percent of its population.
The U.S. has mixed levels of population health. While Americans smoke less than people in other wealthy countries do, they have higher rates of obesity and infant mortality. Life expectancy in the U.S. is 78.8 years, nearly three years less than the average life expectancy in high-income countries.
Except for diagnostic tests, the U.S. uses health care services at rates similar to those of other countries. Numbers of hospital visits and surgeries performed in the U.S. are similar to those in other countries. However, the U.S. performs 118 MRI scans per 1,000 people, compared to an average of 82 MRIs per 1,000 people among all high-income countries. The U.S. also performs a higher rate of CT scans: 245 per 1,000 people, compared to 151 per 1,000 people among all high-income countries.
The U.S. pays more for . . .
Doctors. The average salary for a general practitioner in the U.S. is $218,173, nearly double the average salary across all high-income countries. Specialists and nurses in the U.S. also earn significantly more than elsewhere.
Pharmaceuticals. The U.S. spends $1,443 per person on pharmaceuticals, compared to the average of $749.
Health care administration. The U.S. spends 8 percent of total national health expenditures on activities related to planning, regulating, and managing health systems and services, compared to an average 3 percent spent among all high-income countries.
The Big Picture
The study demonstrates that overall health system performance in the United States does not compare well with that in other wealthy nations, particularly given high U.S. spending — a finding consistent with the Commonwealth Fund’s most recent health system rankings. The health care spending gap with other countries appears to be driven by the high prices the U.S. pays for health care services — particularly doctors, pharmaceuticals, and administration. Compared to its peers, the U.S. has similar levels of spending for social services (including both public and private spending) and similar health care use, neither of which appear to be major causes of the spending gap. To reduce spending, the authors say that U.S. policymakers should focus on lowering prices and administrative costs, rather than just reducing use of health care services.
About the Study
The researchers analyzed data on health care spending, performance, and utilization made available by the Organisation for Economic Co-operation and Development and the Commonwealth Fund from 11 high-income countries: Australia, Canada, Denmark, France, Germany, Japan, the Netherlands, Sweden, Switzerland, the United Kingdom, and the U.S.
The Bottom Line
The United States spends more on health care than other countries do because it pays more for health care services and administration.
American healthcare spending is still WAY higher than pretty much all other industrialized countries. But not that long ago, things were different. The US didn’t spend nearly as much in this realm. What changed? Demographics? More sickness? Nah. Spoiler alert, prices have risen much, much faster than the rate of inflation. We’ve got a few suggestions for getting it under control.
Health Affairs today published the projections for health spending over the next decade from the Centers for Medicare and Medicaid Services (CMS) Office of the Actuary. The top line estimate is that health spending will grow at 5.5 percent per year through 2026. This rate is about halfway between the pre-recession rate of 7.3 percent and the exceptionally low rate (3.8 percent) experienced during the recession and immediate aftermath. This projected spending growth is 1 percentage point above expected gross domestic product (GDP) growth, a smaller gap than for almost any 10-year period since 1990. These non-partisan, thorough projections are a valuable benchmark for all stakeholders anticipating the fiscal footprint of the health care system on the economy, but there are several important issues to keep in mind.
Modeling What Spending Would Be Under Current Law, Not What It Will Most Likely Be
First, these projections are predicated on “current law”. The authors are not trying to predict what spending will most likely be. Such a prediction exercise would require assessments of how policy may change. For example, will the low-fee trajectories called for by the Medicare Access and CHIP Reauthorization Act (MACRA) and the Affordable Care Act (ACA) productivity adjustments be realized? What will be the future of the ACA? The authors here don’t attempt to incorporate the answers to these questions. They assume that the current law will persist. Last week’s budget legislation, which included the repeal of the Medicare Independent Payment Advisory Board and other health care changes, illustrates this point because it came too late to be included in these projections. This highlights how quickly and unpredictably law and policy can change.
An Uncertain Environment
Second, as the authors recognize, there is considerable uncertainty around these projections. During the recession, we experienced a dramatic slowdown in the rate of growth in “use and intensity” of care, a catch-all phrase capturing more physician visits, hospital stays, lab tests, etc. As the ACA was implemented, use and intensity rebounded, capturing both a return to a more common rate of growth and an increase attributable to coverage expansion. (If there is one thing we know well it is that greater coverage generates greater utilization.)
The assumption moving forward is that use and intensity will revert to historical patterns, affected a bit by benefit design changes. The impact of payment reforms, in both the public and private sector, is largely not reflected in these projections. That assumption is certainly reasonable given the modest impact of such changes to date, but payment systems continue to change and their impacts may grow, suggesting that perhaps use and intensity growth will be lower than projected.
Of course, uncertainty is not one sided. Other hypotheses, such as greater introduction of new technologies or weakening commitment to controlling utilization, would yield higher spending projections.
The Policies We Choose Matter
Third, and perhaps most importantly, the actual rate of health spending growth that we experience over the next decade, and beyond, depends on what we do. Health spending is not a natural phenomenon to be predicted like the tides. Our fate is not sealed. Our actions matter. We should not ask whether health spending growth will accelerate (or not). Instead we should ask if we will let it accelerate (or not). This requires complex choices.
It is tempting to read the projections such as those by Gigi Cuckler and her CMS colleagues with alarm. The notion that health care will consume almost 20 percent of the economy in 2026 is legitimately concerning because of the implications for future taxation or borrowing to maintain publicly financed health insurance programs. In fact, Kate Baicker and Jon Skinner predicted back in 2011 that if public health spending growth consistently exceeded national income growth by 1 percentage point and was financed by taxes (increased proportionately on all income groups), the tax rate for the upper income bracket in 2060 would need to rise to 70 percent. This is unlikely to happen, but we must act to make sure it does not.
The Dual Nature Of Health Spending: Consumption And Investment
The challenge, of course, is that health spending, on average, improves health. Therefore, actions to restrain resources devoted to health—including restricting access to health care or health insurance—run the risk of slowing or reversing improvements in health. Moreover, apart from the obvious benefit associated with access to health care services, many people rely on the health care sector for jobs. Heath care is in many ways both a tapeworm on the American economy and a Keynesian stimulus— cutting health spending will have economic consequences. Moreover, while creating jobs is not a justification for waste, lower spending growth can imply lower revenue growth for health care stakeholders, which presents a significant political problem.
These two perspectives are not as hard to balance as one may think. We do not need to cut heath care spending below current levels, just slow the rate of its growth. Moreover, resources not absorbed into the health care sector can be put to valued activities. (If there are not more valued activities for these incremental resources, then more spending on health care is justified).
Beyond How Much We Spend: Does It Bring Value And How Will We Finance It?
Finally, all of this highlights the heterogeneity in value associated with greater health spending. We currently pay higher prices in the United States than in other countries. While health care price inflation slowed between 2014 and 2016, the projections assume that price growth in health care will exceed general inflation. While we cannot conclude that prices in the United States should match those in other countries (there are many differences in our economies), much of the reason for high and growing prices in the United States is a lack of competition associated with consolidation in the health care sector (largely in the commercial sector) and other institutional features. Paying too much for care or other services not only distorts behavior, but also represents a transfer from the broad population to the health care sector. Policy actions to address this issue should be high on the agenda.
Use and intensity also varies in value. While innovation and delivery of appropriate care is the centerpiece of a high-value health care system, our system too often provides care that offers little or no health benefit. Great strides have been made to quantify low value care, through initiatives such as Choosing Wisely, but a lot remains unmeasured. Eliminating such care is hard because the value of care depends on patient traits and delivery system reform requires motivation of influential and invested stakeholders, which does not occur rapidly. Nevertheless, efforts to move in this direction are important.
Ultimately, the question we should ask when we ponder projections of higher health spending is this: Will we get enough value for the added spending? We should also ask how we should finance this spending: Any way we do so—through taxation, higher premiums or cost sharing at the point of service—has dramatic distributional and moral implications.
There are no simple answers to these questions, politically or operationally. One thing is clear: We cannot continue to publicly finance health spending if it grows 1 percentage point faster than GDP. We are not in crisis yet, but at this rate, eventually we will be. Yet, changing health care takes time. Many innovations in both payment and benefit design show promise, but success is uncertain. With luck (or more importantly dedication and hard work) we will be able to spend less than these projections suggest and maintain, or even improve, the care delivered to Americans. Unless we keep trying, however, we will fail.
The market economy fails when applied to healthcare.
That healthcare expenditures in the US are high and rising rapidly is nothing new, but this study appearing in the Journal of the American Medical Association identifies the exact components of healthcare that are driving those soaring costs. As F. Perry Wilson, MD points out in this 150 Second Analysis, the data suggest traditional economic forces break down in the US healthcare market.
The US spends the most of any country in the world on healthcare in terms of percent of GDP, sitting around 18% as of the most recent data.
But to address the issue, we need to understand what is driving this increase, and a new study appearing in the Journal of the American Medical Association does the best job yet in decomposing the factors behind the rising costs.
Health-care spending has increased because prices are rising, not because Americans are using more health care, according to a new study released Tuesday.
The report from the Health Care Cost Institute (HCCI) showed that total health-care spending grew by 4.6 percent per person from 2015 to 2016 even as utilization of services remained steady, or declined in some cases.
As a result, health-care spending per person reached a new high of $5,407 in 2016.
“It is time to have a national conversation on the role of price increases in the growth of health care spending,” said Niall Brennan, president of the HCCI.
“Despite the progress made in recent years on value-based care, the reality is that working Americans are using less care but paying more for it every year. Rising prices, especially for prescription drugs, surgery, and emergency department visits, have been primary drivers of faster growth in recent years.”
The study focused on people under the age of 65 with employer-sponsored health insurance.
Spending on brand named prescription drugs grew by 110 percent between 2012 and 2016, but utilization dropped 38 percent.
According to the report, the average price for an emergency room visit went up 31.5 percent between 2012 and 2016, but the number of visits only increased slightly.
The average price for surgical admissions increased by 30 percent between that five-year period, but there was a 16 percent drop in utilization.
The United States spends almost twice as much on health care, as a percentage of its economy, as other advanced industrialized countries — totaling $3.3 trillion, or 17.9 percent of gross domestic product in 2016.
But a few decades ago American health care spending was much closer to that of peer nations.
What happened?
A large part of the answer can be found in the title of a 2003 paper in Health Affairs by the Princeton University health economist Uwe Reinhardt: “It’s the prices, stupid.”
The study, also written by Gerard Anderson, Peter Hussey and Varduhi Petrosyan, found that people in the United States typically use about the same amount of health care as people in other wealthy countries do, but pay a lot more for it.
Ashish Jha, a physician with the Harvard T.H. Chan School of Public Health and the director of the Harvard Global Health Institute, studies how health systems from various countries compare in terms of prices and health care use. “What was true in 2003 remains so today,” he said. “The U.S. just isn’t that different from other developed countries in how much health care we use. It is very different in how much we pay for it.”
A recent study in JAMA by scholars from the Institute for Health Metrics and Evaluation in Seattle and the U.C.L.A. David Geffen School of Medicine also points to prices as a likely culprit. Their study spanned 1996 to 2013 and analyzed U.S. personal health spending by the size of the population; its age; and the amount of disease present in it.
They also examined how much health care we use in terms of such things as doctor visits, days in the hospital and prescriptions. They looked at what happens during those visits and hospital stays (called care intensity), combined with the price of that care.
The researchers looked at the breakdown for 155 different health conditions separately. Since their data included only personal health care spending, it did not account for spending in the health sector not directly attributed to care of patients, like hospital construction and administrative costs connected to running Medicaid and Medicaid.
Over all, the researchers found that American personal health spending grew by about $930 billion between 1996 and 2013, from $1.2 trillion to $2.1 trillion (amounts adjusted for inflation). This was a huge increase, far outpacing overall economic growth. The health sector grew at a 4 percent annual rate, while the overall economy grew at a 2.4 percent rate.
You’d expect some growth in health care spending over this span from the increase in population size and the aging of the population. But that explains less than half of the spending growth. After accounting for those kinds of demographic factors, which we can do very little about, health spending still grew by about $574 billion from 1996 to 2013.
Did the increasing sickness in the American population explain much of the rest of the growth in spending? Nope. Measured by how much we spend, we’ve actually gotten a bit healthier. Change in health status was associated with a decrease in health spending — 2.4 percent — not an increase. A great deal of this decrease can be attributed to factors related to cardiovascular diseases, which were associated with about a 20 percent reduction in spending.
This could be a result of greater use of statins for cholesterol or reduced smoking rates, though the study didn’t point to specific causes. On the other hand, increases in diabetes and low back and neck pain were associated with spending growth, but not enough to offset the decrease from cardiovascular and other diseases.
Did we spend more time in the hospital? No, though we did have more doctor visits and used more prescription drugs. These tend to be less costly than hospital stays, so, on balance, changes in health care use were associated with a minor reduction (2.5 percent) in health care spending.
That leaves what happens during health care visits and hospital stays (care intensity) and the price of those services and procedures.
Did we do more for patients in each health visit or inpatient stay? Did we charge more? The JAMA study found that, together, these accounted for 63 percent of the increase in spending from 1996 to 2013. In other words, most of the explanation for American health spending growth — and why it has pulled away from health spending in other countries — is that more is done for patients during hospital stays and doctor visits, they’re charged more per service, or both.
Though the JAMA study could not separate care intensity and price, other research blames prices more. For example, one study found that the spending growth for treating patients between 2003 and 2007 is almost entirely because of a growth in prices, with little contribution from growth in the quantity of treatment services provided. Another study found that U.S. hospital prices are 60 percent higher than those in Europe. Other studiesalso point to prices as a major factor in American health care spending growth.
There are ways to combat high health care prices. One is an all-payer system, like that seen in Maryland. This regulates prices so that all insurers and public programs pay the same amount. A single-payer system could also regulate prices. If attempted nationally, or even in a state, either of these would be met with resistance from all those who directly benefit from high prices, including physicians, hospitals, pharmaceutical companies — and pretty much every other provider of health care in the United States.
Higher prices aren’t all bad for consumers. They probably lead to some increased innovation, which confers benefits to patients globally. Though it’s reasonable to push back on high health care prices, there may be a limit to how far we should.