Covid Trends


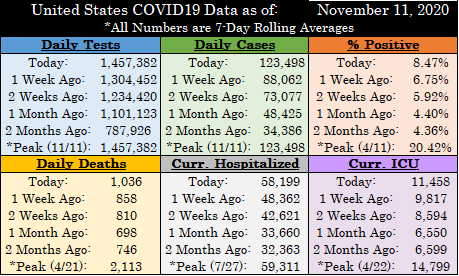
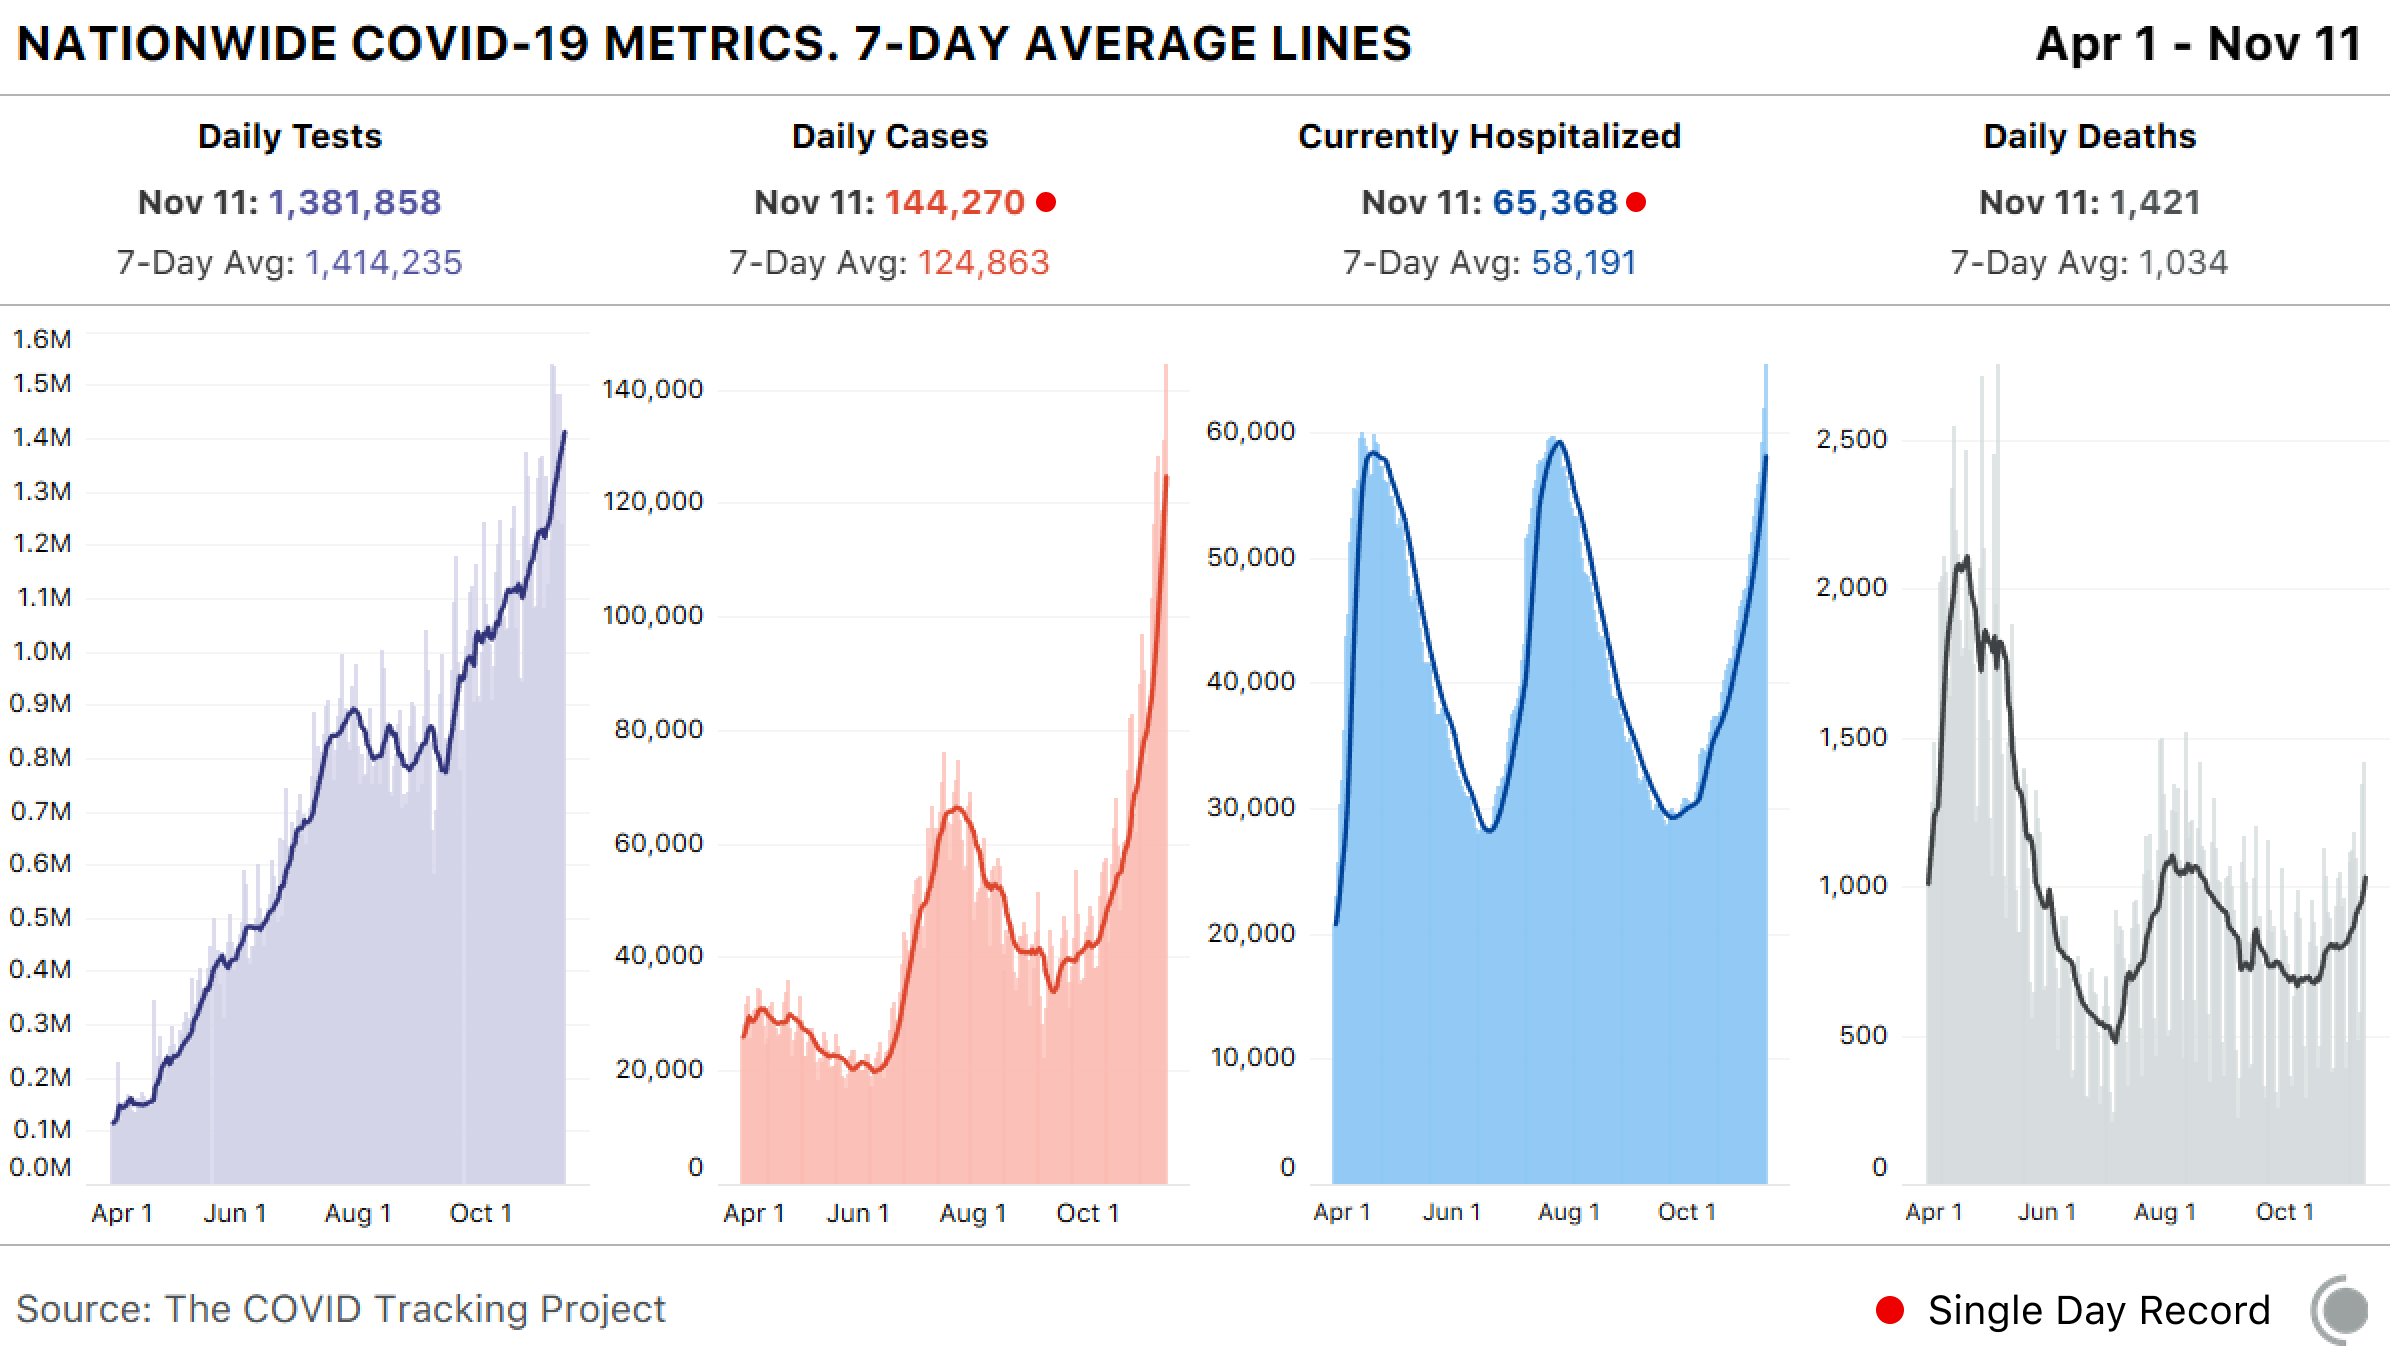
Our daily update is published. States reported 1.4M new tests and 144k cases, another all-time high. 65.4k people are hospitalized, 15k more than on election day. The death toll was 1,421, pushing the 7-day average over 1,000.

4 bar charts showing key COVID-19 metrics for the US over time. Today, states reported 1.4M tests, 144k cases, 65.4k currently hospitalized, and 1,421 deaths.

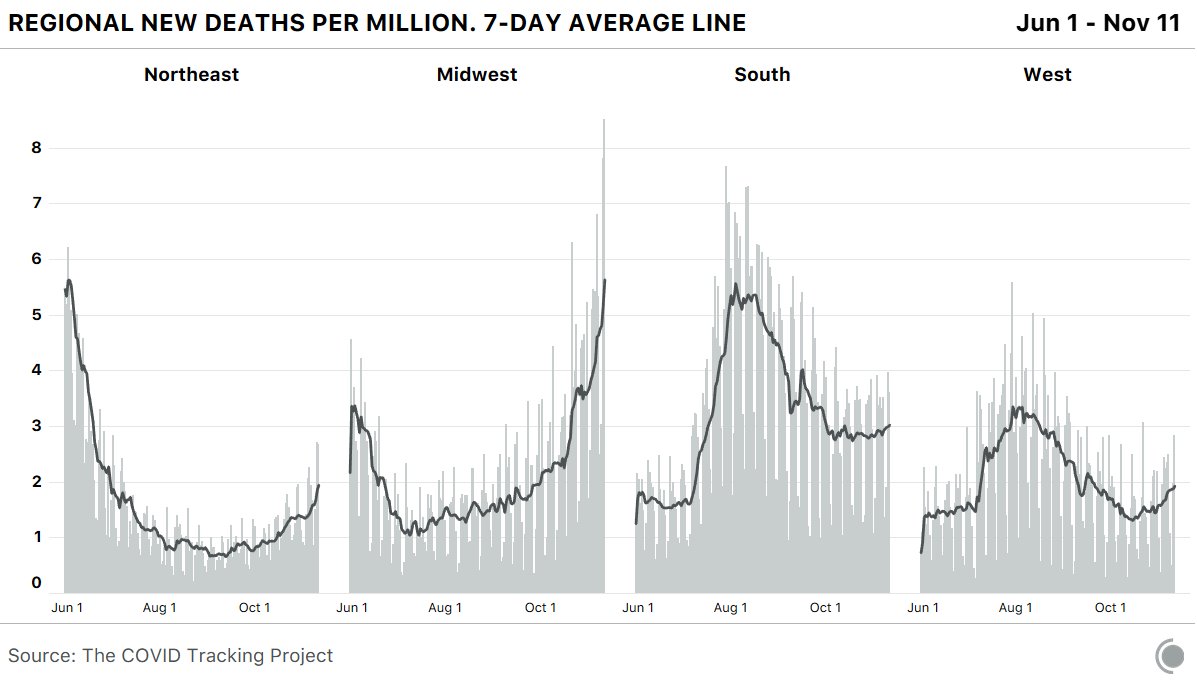
On a per capita basis, more people are now dying across the Midwest than even at the peak of the summer surge in the South.

4 bar charts showing regional new deaths per million with 7-day average lines. The Midwest has now crossed the South's peak over the summer.

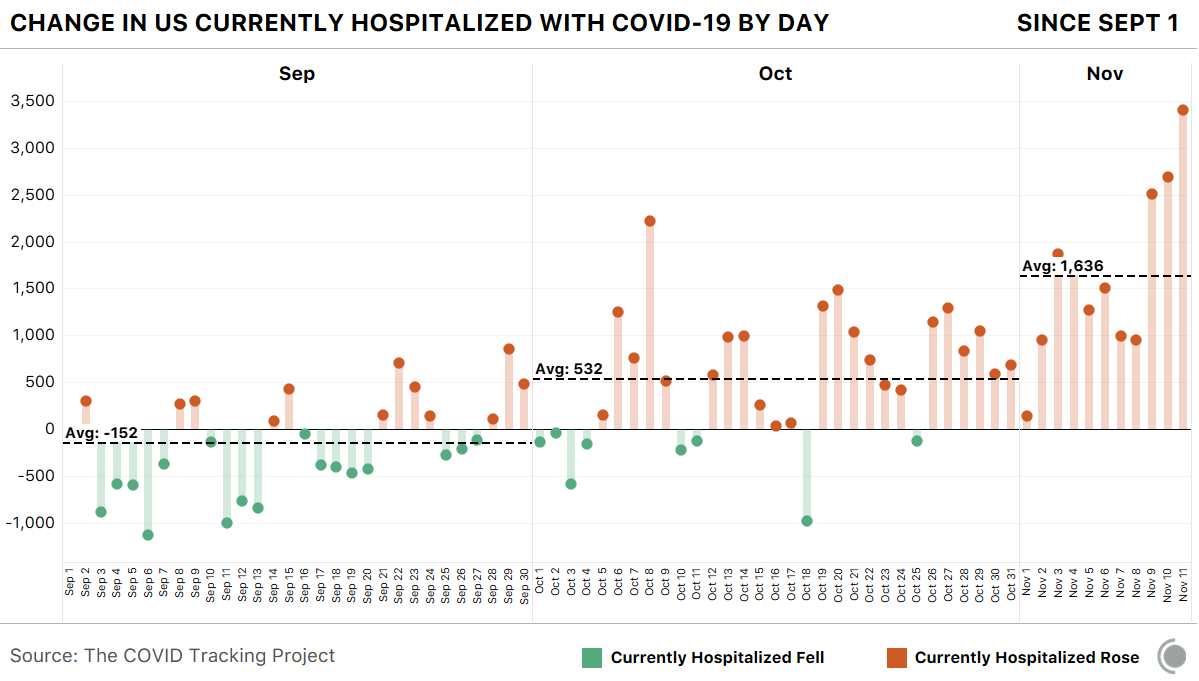
Hospitalizations are now rising very quickly. The last three days standout, but across all of November, we’re averaging 1,636 more current hospitalizations each day.

A chart showing daily hospitalization changes with three monthly average values: September -152, October +532, and November +1,636.

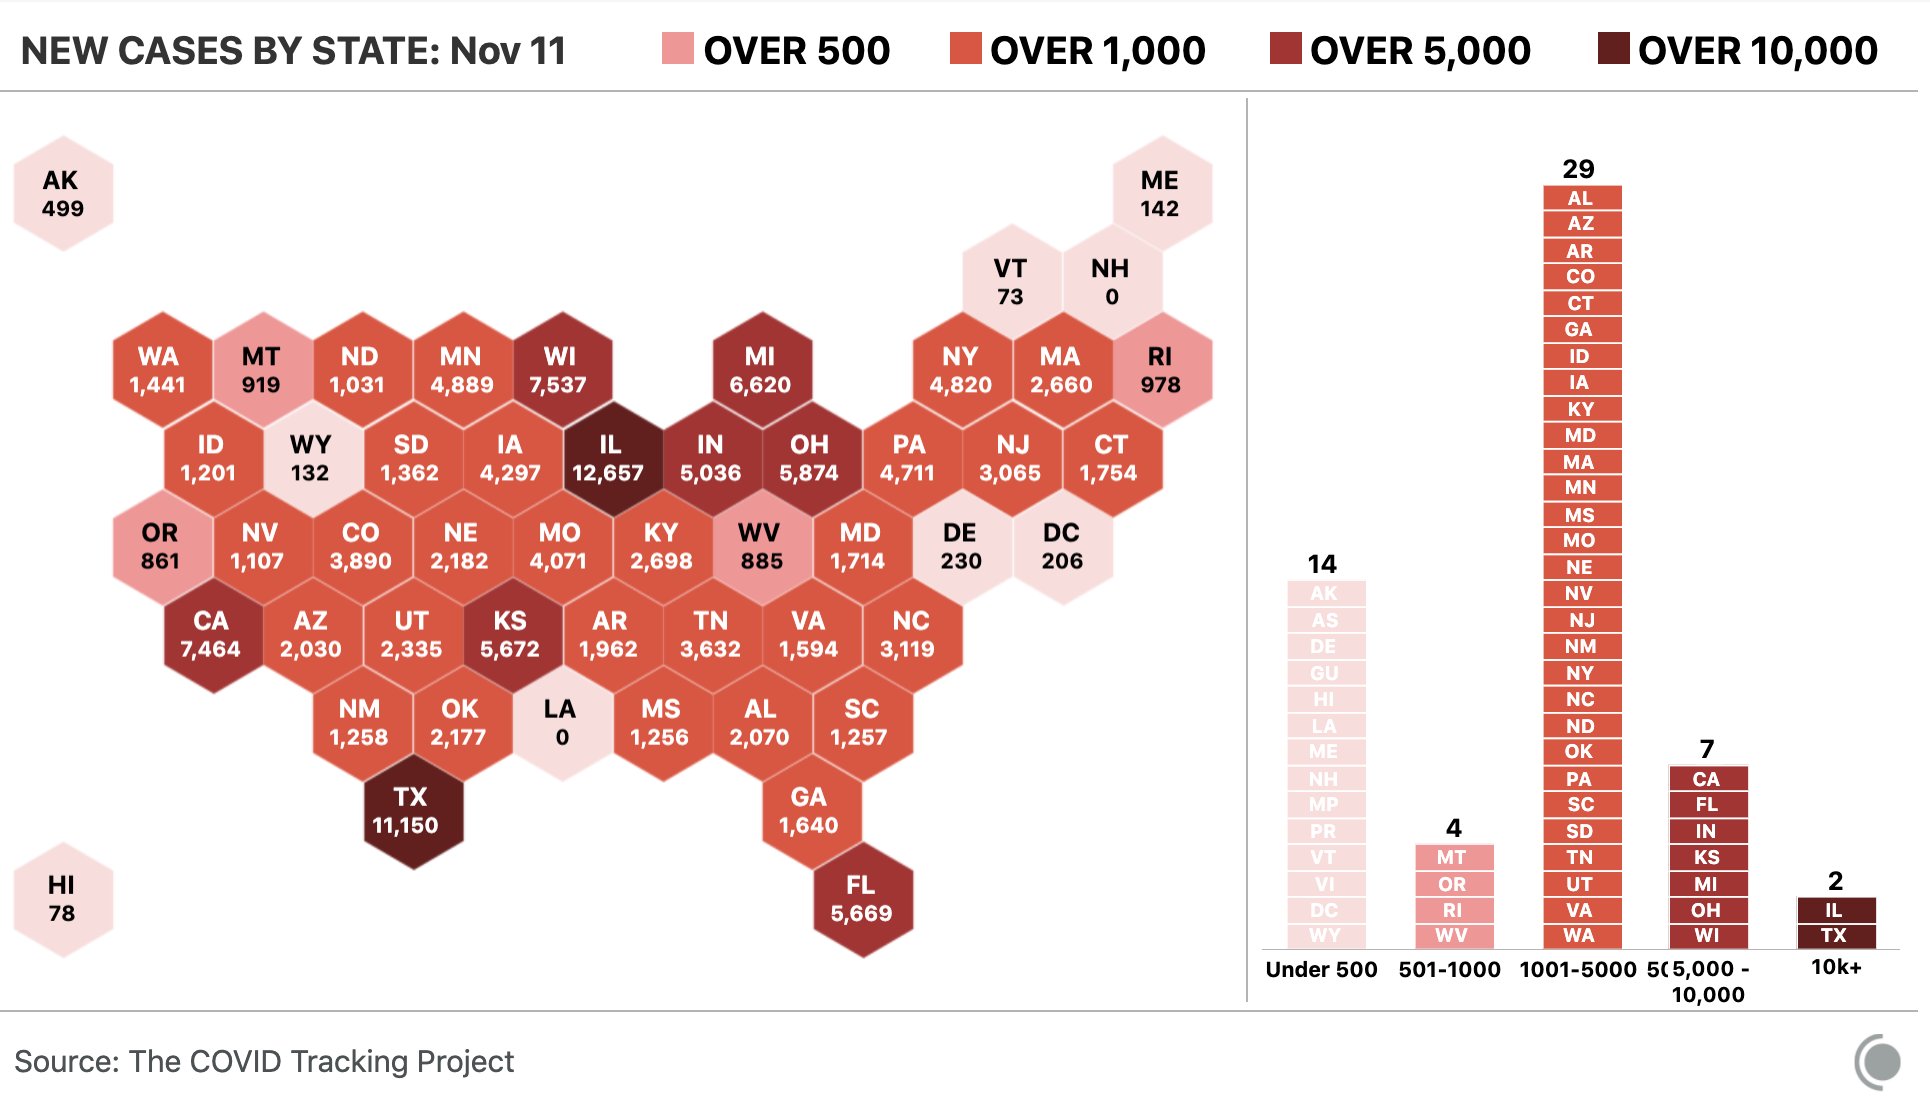
38 states reported over 1,000 cases today.

On the left, a cartogram showing new cases in every U.S. state and the District of Columbia. On the right, a chart with 4 columns showing states grouped into 4 buckets: Under 500 (14 states), 501-1000 (4 states), 1001-5000 (29 states), 5001-10,000 (7 states), 10,000+ (2 states).

*Today’s #Covid19 Update Thread* (tests, cases, deaths, hospitalizations, ICU, and % testing positive as of Today, 1 week, 2 weeks, 1 month, and 2 months ago—data from @COVID19Tracking)

Image

Leave a comment

This site uses Akismet to reduce spam. Learn how your comment data is processed.