Gaming the System: Medical Loss Ratios and How Insurers Manipulate Them

Last week, I made my once a decade trek to a dealership to buy a new car. I did my research in advance (and even negotiated the price) so I was hoping for a stress-free experience. 

It was – up until the point where I got locked in the finance manager’s office for “the talk”. You know, the one where you are made to feel like a neglectful parent unless you pony up for all the fixin’s – everything from nitrogen filled tires to paint protection (just in case I encounter a flock of migratory geese on the drive home).  I shook my head no about ten times before we got to the pre-paid maintenance plan options. I decided to be polite and listen (plus I was curious since I was purchasing a car from a manufacturer notorious for costly repairs). As compelling as it was to pay nearly $5,000 to what ultimately would amount to a few tire rotations for my electric vehicle, I held firm. The finance manager angrily handed me my signed documents and whisked me out of his office.

I guess I can’t blame car dealers for applying massive mark-ups for services that are inexpensive to provide. Except similar financial chicanery is currently playing out in our health insurance system. If you swap out the finance manager for a health insurer and replace me with the average everyday consumer, the dealer’s tactics are analogous to how insurers game medical loss ratio (MLR) requirements (except as a health care consumer, you can’t say “no”). 

A bit of background is in order to understand why I thought about health insurance and car dealers in the same breath.

Insurance companies are required to spend a certain percentage of money they get from premiums on medical costs and quality improvement (QI); this is known as the medical loss ratio (MLR). If companies do not meet this ratio (usually 80-85%, depending on the product), they must refund the difference in the form of a rebate, or reduction in future premiums, to consumers.

Like any for-profit corporation in America today, a health insurer wants to avoid giving money back to consumers. Therefore, insurers have become adept at manipulating their MLRs through various accounting and financial engineering techniques. This manipulation optimizes their ability to meet MLR thresholds and avoid paying rebates, which runs afoul of its intended purpose: to ensure that patients receive the appropriate level of care.  

So how do insurers game the system, and what evidence exists for this activity?

The current MLR formula is:

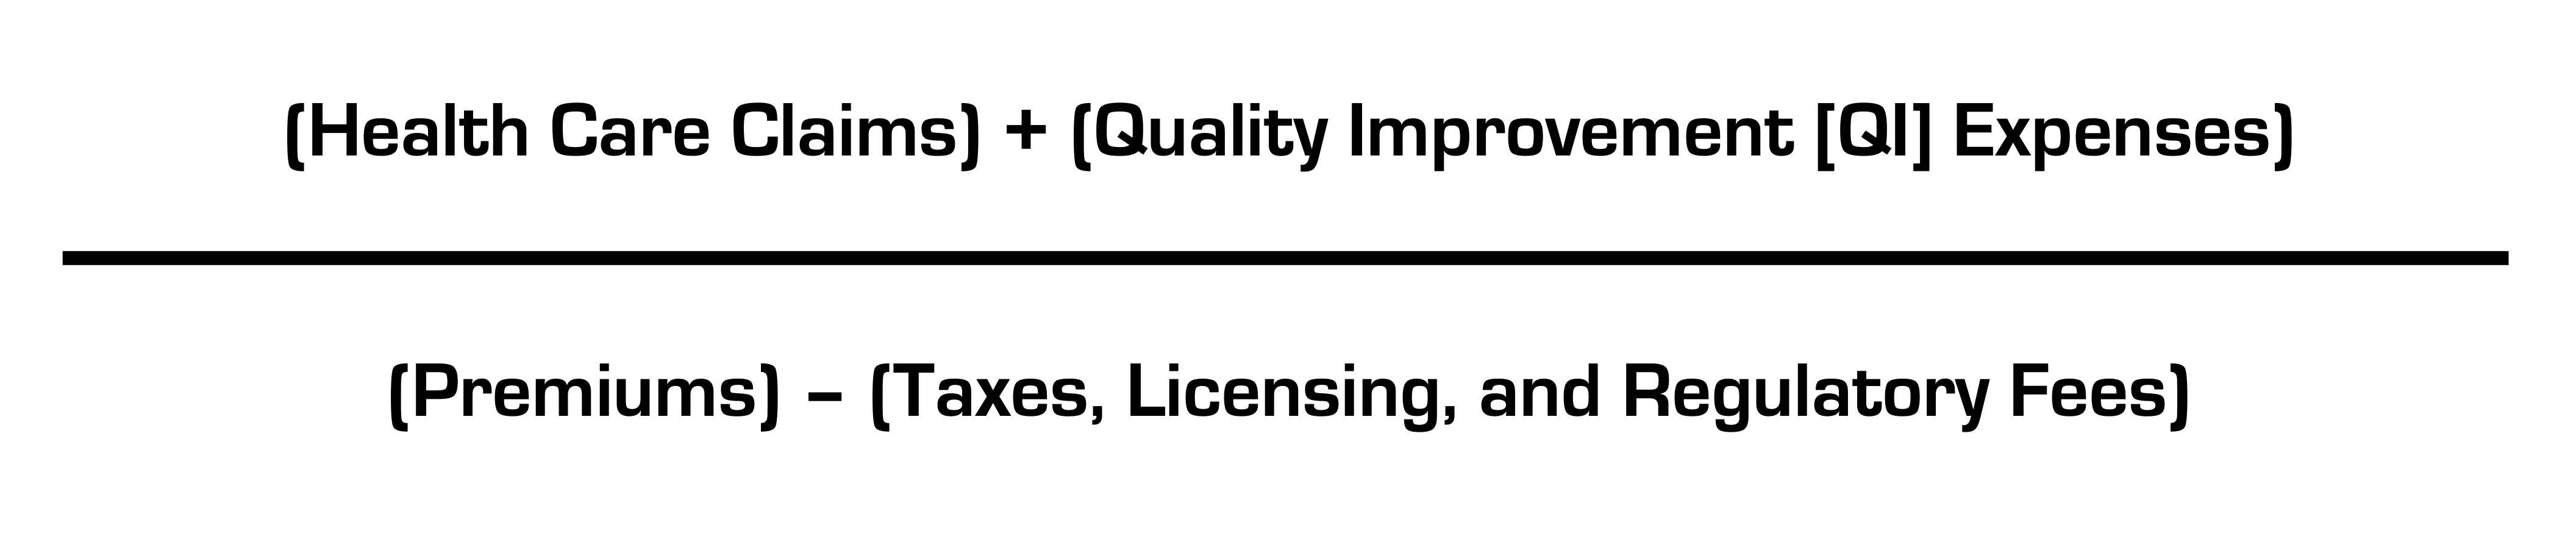
Health insurers do not control taxes and fees, but they can easily engineer the other variables. Below, I’ll explain how.

Step 1: Quality Improvement (QI) Expenses

The definition of allowable QI expenses is broad and includes activities to improve outcomes, patient safety, and reduce mortality (mom and apple pie stuff). Insurers played a big role in writing the MLR regulations after Congress enacted legislation and made sure they’d have wide latitude in what expenses are classified as QI (akin to the car dealer “option” list) and what product segments they assign them to. 

Looking at reported QI expenses sheds light on this practice. QI expenses vary between insurers.  But they also vary widely for the same insurer from year to year (even after controlling for geography and product segment). In large part, this is attributable to financial engineering. QI costs can be effectively “transferred” on the income statement from one product segment to another, by adjusting the pro rata weightings). This enables them to optimize MLR performance across their insurance portfolio (i.e. by taking from a bucket with excess medical costs and putting it in another with insufficient costs) in a way that maximizes benefit to the insurer and is camouflaged from regulators and consumers. This is language from a recent UnitedHealth Group filing with the Securities and Exchange Commission: “Assets and liabilities jointly used are assigned to each reportable segment using estimates of pro-rata usage.”

Annual QI expenses across four insurers in Florida in the small group market.

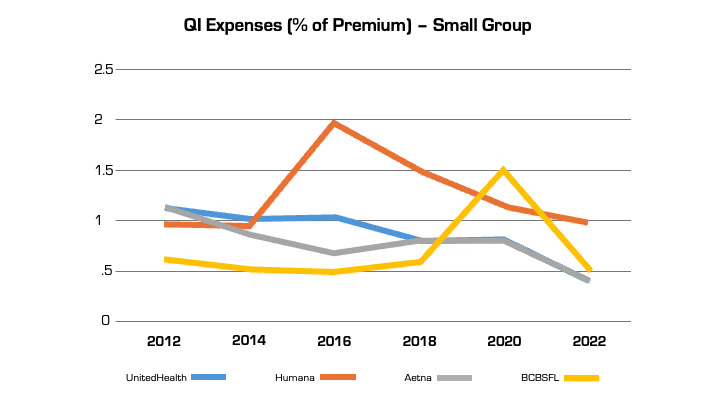
Although these QI percentages are small, the associated dollar amounts are large. In 2022, UnitedHealth, Humana, and Aetna reported $494 million, $550 million, and $395 million respectively in allowable QI expenses for their national plans. While there is some legitimate QI activity at insurers (e.g., pharmacists who identify high risk medications in the elderly), the reality is that much of the QI work is already heavily resourced within provider organizations, where it is more effective. Insurers also can (and do) count “wellness and health promotion activities” despite limited evidence these programs improve health outcomes and are more often used by insurers as marketing tools.

Step 2. Health Care Claims

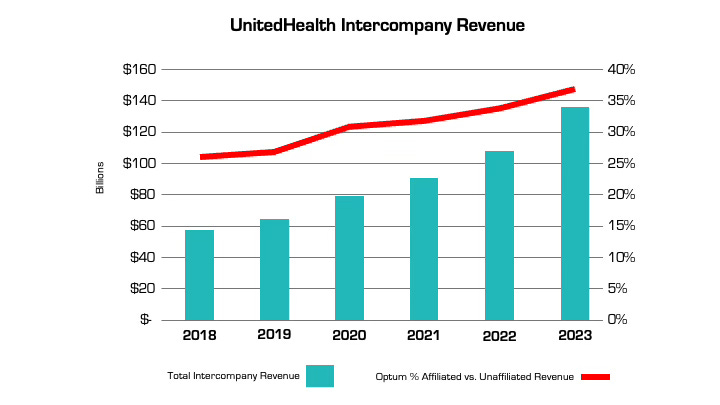
The other variable that insurers can manipulate is claims costs. The more an insurer is vertically integrated, the easier it is. The prime example is UnitedHealth, which has an insurance arm (UnitedHealthcare) and a big division that encompasses medical services, among many other things (Optum), as well as various other subsidiaries. Optum Health and Optum Rx receive a significant portion of their revenue from UnitedHealthcare for providing services like care and pharmacy benefit management to people enrolled in its health plans. In fact, the amount of UnitedHealth’s corporate “eliminations,” (meaning inter-company revenue that is reported on their consolidated financial statement) has more than doubled over the past five years (from $58.5 billion to $136.4 billion). The proportion of revenue Optum derives from UnitedHealthcare versus unaffiliated entities has increased by nearly 50% over the same period.  A similar trend is playing out at every major insurer.

Take the example of the insurance company Aetna, the PBM CVS Caremark, and CVS Pharmacy, which are all vertically integrated and owned by CVS Health. If a patient goes to a CVS store to fill a prescription for Imatinib, a generic chemotherapy drug, the total cost the patient and insurance company pay is $17,710.21 for a 30-day supply. The same drug is sold by Cost Plus Drugs for $72.20 (the cost is calculated by adding the wholesale price and a 15% fee). When the patient fills the prescription at a CVS retail pharmacy, CVS Health can record that the patient paid a medical claim cost of $17,710.21 (even though the cost to acquire the drug is $70) and the remaining $17,640 can be retained as profits disguised as medical costs. 

Insurers’ extensive acquisition of physician practices also facilitates gamification of the MLR via its ability to pay capitation (a set amount per person) to a risk-bearing provider organization (RBO) it owns, such as a medical group. This enables the insurer to lock in a set amount of premium as “medical expense” (usually around 85%) with the downstream provider group “managing” those costs.  There’s a loophole, however. While the insurer has technically met its MLR requirement, the downstream RBO is subject to far fewer regulations on how it spends the money, which makes it easier to generate profits by skimping on care.  

The regulations on RBOs vary by state. In many cases, while RBOs need to meet minimum capital requirements, they are not subject to the same MLR provisions as insurers. For a vertically integrated insurer that gets a huge amount of revenue from taxpayer-supported programs like Medicare Advantage and Medicaid, this essentially means that (1) the Center for Medicare and Medicaid Services puts the money into the insurer’s right pocket, (2) the insurer moves it to the left pocket, and (3) CMS checks the right pocket – and just the right pocket – at the end of the year to make sure it’s mostly empty (without regard to the fact that the left one may be busting at the seams).

The good news is there are ways to address these issues, both through updating the MLR provisions in the Affordable Care Act (which are long in the tooth) and more rigorous and comprehensive reporting requirements and regulation of vertically integrated insurers.  

Just like I don’t want car dealers pushing unnecessary add-ons to increase their profit margins, consumers deserve that the required portion of their hard spent premium dollar actually goes toward their health care instead of further enriching huge corporations, executives, and Wall Street shareholders.

Are Employers Ready to Move from the Back Bench in U.S. Healthcare?

This year, 316 million Americans (92.3% of the population) have health insurance: 61 million are covered by Medicare, 79 million by Medicaid/CHIP and 164 million through employment-based coverage. By 2032, the Congressional Budget Office predicts Medicare coverage will increase 18%, Medicaid and CHIP by 0% and employer-based coverage will increase 3.0% to 169 million. For some in the industry, that justifies seating Medicare on the front row for attention. And, for many, it justifies leaving employers on the back bench since the working age population use hospitals, physicians and prescription meds less than seniors.  

Last week, the Business Group on Health released its 2025 forecast for employer health costs based on responses from 125 primarily large employers surveyed in June: Highlights:

  • “Since 2022, the projected increase in health care trend, before plan design changes, rose from 6% in 2022, 7.2% in 2024 to almost 8% for 2025. Even after plan design changes, actual health care costs continued to grow at a rate exceeding pre-pandemic increases. These increases point toward a more than 50% increase in health care cost since 2017. Moreover, this health care inflation is expected to persist and, in light of the already high burden of medical costs on the plan and employees, employers are preparing to absorb much of the increase as they have done in recent years.”.
  • Per BGH, the estimated total cost of care per employee in 2024 is $18,639, up $1,438 from 2023. The estimated out-of-pocket cost for employees in 2024 is $1,825 (9.8%), compared to $1,831 (10.6%) in 2023.

The prior week, global benefits firm Aon released its 2025 assessment based on data from 950 employers:

  • “The average cost of employer-sponsored health care coverage in the U.S. is expected to increase 9.0% surpassing $16,000 per employee in 2025–higher than the 6.4% increase to health care budgets that employers experienced from 2023 to 2024 after cost savings strategies. “
  • On average, the total health-plan cost for employers increased 5.8% to $14,823 per employee from 2023 to 2024: employer costs increased 6.4% to 80.7% of total while employee premiums increased 3.4% increase–both higher than averages from the prior five years, when employer budgets grew an average of 4.4% per year and employees averaged 1.2% per year.
  • Employee contributions in 2024 were $4,858 for health care coverage, of which $2,867 is paid in the form of premiums from pay checks and $1,991 is paid through plan design features such as deductibles, co-pays and co-insurance.
  • The rate of health care cost increases varies by industry: technology and communications industry have the highest average employer cost increase at 7.4%, while the public sector has the highest average employee cost increase at 6.7%. The health care industry has the lowest average change in employee contributions, with no material change from 2023: +5.8%

And in July, PWC’s Health Research Institute released its forecast based on interviews with 20 health plan actuaries. Highlights:

  • “PwC’s Health Research Institute (HRI) is projecting an 8% year-on-year medical cost trend in 2025 for the Group market and 7.5% for the Individual market. This near-record trend is driven by inflationary pressure, prescription drug spending and behavioral health utilization. The same inflationary pressure the healthcare industry has felt since 2022 is expected to persist into 2025, as providers look for margin growth and work to recoup rising operating expenses through health plan contracts. The costs of GLP-1 drugs are on a rising trajectory that impacts overall medical costs. Innovation in prescription drugs for chronic conditions and increasing use of behavioral health services are reaching a tipping point that will likely drive further cost inflation.”

Despite different methodologies, all three analyses conclude that employer health costs next year will increase 8-9%– well-above the Congressional Budget Office’ 2025 projected inflation rate (2.2%), GDP growth (2.4% and wage growth (2.0%).  And it’s the largest one-year increase since 2017 coming at a delicate time for employers worried already about interest rates, workforce availability and the political landscape.

For employers, the playbook has been relatively straightforward: control health costs through benefits designs that drive smarter purchases and eliminate unnecessary services. Narrow networks, price transparency, on-site/near-site primary care, restrictive formularies, value-based design, risk-sharing contracts with insurers and more have become staples for employers. 

But this playbook is not working for employers: the intrinsic economics of supply-driven demand and its regulated protections mitigate otherwise effective ways to lower their costs while improving care for their employees and families.

My take:

Last week, I reviewed the healthcare advocacy platforms for the leading trade groups that represent employers in DC and statehouses to see what they’re saying about their take on the healthcare industry and how they’re leaning on employee health benefits. My review included the U.S. Chamber of Commerce, National Federal of Independent Businesses, Business Roundtable, National Alliance of Purchaser Coalitions, Purchaser Business Group on Health, American Benefits Council, Self-Insurance Institute of America and the National Association of Manufacturers.

What I found was amazing unanimity around 6 themes:

  • Providing health benefits to employees is important to employers. Protecting their tax exemptions, opposing government mandates, and advocating against disruptive regulations that constrain employer-employee relationships are key.
  • Healthcare affordability is an issue to employers and to their employees, All see increasing insurance premiums, benefits design changes, surprise bills, opaque pricing, and employee out-of-pocket cost obligations as problems.
  • All believe their members unwillingly subsidize the system paying 1.6-2.5 times more than what Medicare pays for the same services. They think the majority of profits made by drug companies, hospitals, physicians, device makers and insurers are the direct result of their overpayments and price gauging.
  • All think the system is wasteful, inefficient and self-serving. Profits in healthcare are protected by regulatory protections that disable competition and consumer choices.
  • All think fee-for-service incentives should be replaced by value-based purchasing.
  • And all are worried about the obesity epidemic (123 million Americans) and its costs-especially the high-priced drugs used in its treatment. It’s the near and present danger on every employer’s list of concerns.

This consensus among employers and their advocates is a force to be reckoned. It is not the same voice as health insurers: their complicity in the system’s issues of affordability and accountability is recognized by employers. Nor is it a voice of revolution: transformational changes employers seek are fixes to a private system involving incentives, price transparency, competition, consumerism and more.

Employers have been seated on healthcare’s back bench since the birth of the Medicare and Medicaid programs in 1965. Congress argues about Medicare and Medicaid funding and its use. Hospitals complain about Medicare underpayments while marking up what’s charged employers to make up the difference. Drug companies use a complicated scheme of patents, approvals and distribution schemes to price their products at will presuming employers will go along. Employers watched but from the back row.

As a new administration is seated in the White House next year regardless of the winner, what’s certain is healthcare will get more attention, and alongside the role played by employers. Inequities based on income, age and location in the current employer-sponsored system will be exposed. The epidemic of obesity and un-attended demand for mental health will be addressed early on. Concepts of competition, consumer choice, value and price transparency will be re-defined and refreshed. And employers will be on the front row to make sure they are.

For employers, it’s crunch time: managing through the pandemic presented unusual challenges but the biggest is ahead. Of the 18 benefits accounted as part of total compensation, employee health insurance coverage is one of the 3 most expensive (along with paid leave and Social Security) and is the fastest growing cost for employers.  Little wonder, employers are moving from the back bench to the front row.

Patients Are Delaying Healthcare – Findings From 2022 BDO Patient Experience Survey

https://www.linkedin.com/pulse/patients-delaying-healthcare-findings-from-our-new-survey-shill/

Since the early days of the pandemic, the healthcare industry has faced seemingly insurmountable challenges to ensure access to high-quality care. While healthcare providers have performed admirably in the face of these challenges, patients are still seeing access challenges that are impacting their behaviors — which can lead to challenges in the long run.

In the 2022 BDO Patient Experience Survey, they sought to learn how patients feel about their providers and healthcare experience — from making appointments and interacting with care providers, to how patients access health insurance and who patients turn to for routine care.

From the survey of over 3,000 U.S. adults, they came across a few key takeaways:

 1. Delaying routine care is the new norm

Americans face a troubling dilemma: While 92% have health insurance and 91% have a regular care provider, 58% admit to delaying routine medical care in the past 12 months.

For routine (non-emergency) care, 69% of respondents report seeing a primary care physician and 12% routinely visit primary care nurse/nurse practitioner or physician assistant. Just 9% do not have a provider for routine medical care. Our survey found that Americans use a wide variety of health insurance options with employer-sponsored insurance (32%) being the most popular, followed by Medicare (28%), Medicaid (14%) and individual private insurance (7%). While 8% report having no health insurance, even those with insurance faced significant barriers to care.

Of those who delayed seeking medical care in the past 12 months, 30% cite unaffordability due to high out-of-pocket costs and 19% say they could not afford to seek care due to a lack of insurance. In addition to the high costs of medical care, many Americans struggle with a lack of cost transparency.

 2. Cost transparency is a continuing problem

Nearly a third of Americans (31%) have never tried to obtain cost estimates for medical care. When patients do not know what healthcare will cost, many avoid seeking necessary care. A critical way we can improve patient access to healthcare is to understand how patients like to obtain cost estimates.

Of patients surveyed who have sought cost estimates, most prefer to reach out to a person, with 38% preferring to contact their insurance provider and 37% opting to ask the healthcare provider’s administrative staff. On the digital side, 31% say they obtained cost estimates by looking at online patient portals and 27% look to health provider or medical facility websites.

3. Most patients experience frustration when seeking and receiving care

We know that long appointments lead times and high costs cause patients to put off care — but how do patients feel about the actual care they receive? 69% of Americans experience frustration during routine medical appointments, with having to wait for a late provider (29%), not getting enough time with the provider (22%) and having too much paperwork to fill out (21%) being the most common frustrations.

 When providers make it easier for patients to receive care, their efforts are noticed. Patients say providers make care more accessible by offering telehealth appointments (32%), reaching out to proactively schedule appointments (29%), offering walk-in appointments (27%) and implementing online/self-service scheduling (23%).

Patients are facing a challenging care environment — and so are providers. Fortunately, there are ways that providers can improve access and the care experience for their patients without breaking their budgets.