As chatter about “Medicare-for-All” ideas heats up—at least among the field of Democratic presidential hopefuls—the Congressional Budget Office decided to offer its own take.
Well, sort of.
Wednesday, the CBO issued a report that dove into the key considerations policymakers might want to think about before they overhaul the U.S. healthcare into a single-payer system. Putting it mildly, they said, the endeavor would be a “major undertaking.”
They don’t actually offer up specific cost estimates on any of the Medicare-for-All bills floating around, though other researchers put Bernie Sanders’ Medicare-for-All plan at between $32.6 trillion and $38.8 trillion over the first decade.
But the CBO analysts did weigh in on a slew of different approaches to financing, coverage, enrollment and reimbursement that could be built into a single-payer plan.
“Establishing a single-payer system would be a major undertaking that would involve substantial changes in the sources and extent of coverage, provider payment rates and financing methods of healthcare in the United States,” the CBO said.
So what exactly did the CBO have to say about what it would take to create a single-payer system? Here are some key takeaways:
1. There could be a role for private insurance—or not
There has been plenty of heated debate around Medicare for All focused on the role that existing private coverage could—or could not—play in that system. Most insured Americans are enrolled in a private plan today, including about one-third of Medicare beneficiaries.
If they’re allowed, commercial plans could play one of three roles in a single-payer system, according to the report: as supplemental coverage, as an alternative plan or to offer “enhanced” services to members in the government plan.
Allowing private insurers to offer substitutive plans is unlikely, because they could potentially offer broader provider networks or more generous benefits, which would draw people into them. A solution to this issue could be mandating that providers treat a minimum number of patients who are enrolled in a single-payer plan.
Private payers could also offer coverage for care that is traditionally outside of the purview of government programs, such as dental care, vision care and hearing care.
Supplemental plans like these are offered in the existing Medicare program, and several countries with single-payer systems allow this additional coverage.
For example, in England, private plans offer “enhancements” to members of the government plan, including shorter wait times and access to alternative therapies, But members of these plans must pay for it in addition to tax contributions to the country’s National Health Service.
2. Other government programs could stick around
In addition to Medicare and Medicaid, the federal government operates several health programs targeting individual populations: the Veterans Affairs health system, TRICARE and Indian Health Services.
A single-payer system could be designed in a way that also maintains these individualized programs, the CBO said. Canada does this today, where its provinces operate the national system while it offers specific programs outside that for indigenous people, veterans, federal police officers and others.
There could also be a continuing role for Medicaid, according to the report.
“Those public programs were created to serve populations with special needs,” the CBO said. “Under a single-payer system, some components of those programs could continue to operate separately and provide benefits for services not covered by the single-payer health plan.”
On the flip side, though, a single-payer plan could choose to fold members of those programs into the broader, national program as well, the office said.
3. A simplified system could also mean simplified tech
Taiwan’s government-run health system has a robust technology system that can monitor patients’ use of services and healthcare costs in near real-time, according to the report.
Residents are issued a National Health Insurance card that can store key information about them, including personal identifiers, recent visits for care, what prescriptions they use and any chronic conditions they may have. Providers also submit daily data updates to a government databank on service use, which is used to closely monitor utilization and cost. Other technology platforms in Taiwan can track prescription drug use and patients’ medical histories.
However, getting to a streamlined system like this in the U.S. would be bumpy, the CBO said. It would face many of the same challenges the health system is already up against today, such as straddling many federal and state agencies and addressing the needs of both rural and urban providers.
But the payoffs could be significant, according to the report.
“A standardized IT system could help a single-payer system coordinate patient care by implementing portable electronic medical records and reducing duplicated services,” the agency wrote.
4. How to structure payments to providers? Likely global budgets
Most existing single-payer systems use a global budget to pay providers, and may also apply in tandem other payment approaches such as capitation or bundled payments according to the report.
How these global budgets operate varies between countries. Canada’s hospitals operate under such a model, while Taiwan sets a national healthcare budget and then issues fee-for-service payments to individual providers. England also uses a national global budget.
Global budgets are rare in the U.S., though Maryland hospitals operate under an all-payer system. These models put more of the financial risk on providers to keep costs within the budget constraints.
Many international single-payer systems pay based on volume, but the CBO said value-based contracting could be built into any of these payment arrangements.
5. Premiums and cost-sharing are still in play, especially depending on tax structures
A government-run health system would, by its nature, need to be funded by tax dollars, but some countries with a single-payer system do charge premiums or other cost-sharing to offset some of those expenditures.
Canada and England operate on general tax revenues, while Taiwan and Denmark include other types of financing. Danes pay a dedicated, income tax to back the health system, while the Taiwanese have a payroll-based premium.
The type of tax considered would have different implications on financing, according to the CBO. A progressive tax rate, for instance, would impose higher levies on people with higher incomes, while a consumption tax, such as one added to cigarettes, would affect people more evenly.
Policymakers will also have to weigh when to impose new taxes, shifting the economic burden between generations.
The CBO did not offer any cost estimates in terms of the amount the federal government would need to raise in taxes to fund a single-payer program.
Another favorite topic at the heart of the US healthcare debate is whether governments can run health insurance programs at lower operating costs than private insurance companies.
Two Sides Square Off
Private Industry Supporters: Some argue that governments regularly prove incompetent running large complex operations at a low costs. Regularly cited is the US mail system and the VA; more locally, public schools and DMV’s. And in the case of Medicare and Medicaid, something about these programs appears to set up a breeding ground for costly fraud and theft, they might argue. Finally, this group argues that competition inherently creates innovation, productivity and lower unit operating costs, something that does not naturally occur with government programs.
Government Supporters: On the other side, many argue that the sheer scale of a single program like Medicare creates consistency and low unit costs, the result of economies of scale. Further, that by extending that program to even more Americans, those scale economies will improve more. This group argues that the profit motive of private companies can only result in higher costs, not lower, enriching investors and executives.
What Do The Numbers Say?
As I researched this point, I found that cost effectiveness arguments between Medicare and Private Insurance is an old one, with each side pretty dug in. But there are some important themes associated with the underlying math.
Comparing Costs vs Percentages:
Government program supporterslike to compare operating costs using percentages. The common percentage used is “operating cost as a percent of medical services”. They Argue that Medicare costs only about 2%-3% of the costs of medical services paid. They will further argue that private health plan costs are, by comparison anywhere from 10% to 25% of the costs of medical services they pay. Their conclusion is, “Medicare has far lower operating costs, and is therefore the much more efficient program.”
Private market supportersdispute this “percentage comparison”, and instead look at “operating costs $’s per capita” and compare those. They argue that when compared in this $ per capita measure, monthly Medicare operational costs are well over $100 per capita, while monthly private insurance cost of operations are well less than $100 per capita. Their conclusion is, “Private market providers have far lower operating costs, and are therefore much more efficient than Medicare”.
Why Is This Comparison Of Operating Costs of Medicare and the Private Market So Difficult?
1) As much as 50% of all US healthcare occurs in the last few months of a person’s life. This dynamic is a major driver of Medicare Coverage and its operating costs. It is far less of a driver of private healthcare coverage for younger and mostly working Americans and the related operating costs, confusing the comparisons.
2) Many diseases of aging are much more common in Medicare than in private health coverages. The most expensive is Kidney Care, and ultimately transplant or Dialysis, (which has its own category in Medicare). Beyond that, Cancers, Heart Disease, Dementia/Alzheimer’s and others are far more significant drivers of continuing costs for those covered by Medicare than those on private insurance coverages at younger ages, confusing the comparisons.
3) Workplace related coverages more often coordinate coverage with workers compensation, or even car and homeowners insurance coverages than those with Medicare Coverages. This produces different operating costs and medical coverages under the private health coverages, confusing the comparisons.
4) Private Insurance coverages are or have been subject to significant state Premium Taxes and other health care related state and federal taxes. These are often categorized as “Operating Costs” in comparisons, confusing the comparisons.
5) Some comparisons don’t capture all government expenses that support the Medicare program, perhaps to advantage this argument. Examples of services performed for Medicare by other parts of the government that aren’t accounted for: The Social Security Administration collects premiums, the Internal Revenue Service collects taxes for the program, the F.B.I. provides fraud prevention services, and at least seven other federal agencies and departments also do work that benefits Medicare, confusing the comparisons.
6) As pointed out in previous installments, a large and rapidly increasing portion of the Medicare eligible population opts out of traditional Medicare and purchases a Private Plan alternative from private companies. This is now approximately 40%. Operating costs are imbedded in the coverage price and not easily separated for purposes of comparison any longer, confusing the comparisons.
Conclusion?
As some of this discussion indicates, it is nearly impossible to formulate a clear comparison between Medicare operating costs and “the private market”. However, it also appears unlikely that the original Medicare Program administration, when properly compared, is more efficient than the highly competitive private market. That market now provides many low price, high value alternatives for rapidly growing number of Medicare eligibles. It is those same private market players who provide specialized solutions for younger and more often working American families at lower per capita costs than the Medicare Program, the measure that this writer is moved to support.
To our elected officials and government workers re: Medicare-For-All. “If it’s so great, why aren’t YOU part of the Medicare program today?”
Lets take a quick look at who these government workers are and to what extent they have been the leaders in single payer programs so far.
Federal Government Workers
There are roughly 2 million federal workers in the US today. They and their families participate in a health benefits program created in 1960 just for them (the FEHBP). Interestingly, the FEHBP is not a government run single payer system, but arguably, the opposite. It’s a mostly open marketplace to over 200 private market HMO, PPO and other options from nearly every Blue Cross/Blue Shield plan and many other local and major managed care companies such as Aetna, Humana and United HealthCare.
When federal workers reach age 65, most choose continuing their FEHBP alternative, because it offers great local and national private options that are just a better deal than the single payer Medicare option. Once they actually do retire, workers can continue to choose to apply their Medicare subsidies to alternatives to Medicare that I have talked about in previous posts from the same private insurance company vendors they currently have, with little disruption.
State and Local Government Workers
There are roughly 4.5 Mil workers of each of the states, with coverage structures as varied as the number of states. Beyond that, another 14 Mil workers are associated with local governments, cities and counties and their health coverages even more varied.
Virtually all have unique programs providing multiple PPO and HMO and other coverages from a variety of private health insurance vendors. Those workers over ages 65, typically remain with those private health plans just as they did when they were younger. For retirees, today often older than age 65, the options are too varied for this article. But suffice it to say, they too have many private market alternatives or wraparound options to the Traditional Medicare program, and many opt for those.
Medicare-For-All; Will Federal, State and Local Government Workers Lead The Way?
So government workers and retirees participate in private insurance programs in much the same way way as the rest of us. As such, it would appear that if Medicare were “switched on” as the sole solution for health care coverage, all these government workers would be as impacted as everyone else, and might have similar responses, both positive and negative.
It seems that time and political realities will indicate whether government workers themselves would support a single source for their health care options, defined by the government, without the benefit of private market wrap-arounds or alternatives.
The “Free-ness” of Medicare, like many other commodities, comes down to two important metrics discussed here; Cost, and Price.
Cost:
Costsfor Medicare include all payments to hospitals, doctors, pharmacies, labs, imaging centers, etc.
Costs for Medicare also include amounts paid to 12 private companies contracted regionally to manage and administer the Medicare Program. (i.e. claims, payments, providers, appeals, inquiries, education, medical records, etc). These critical administrative functions have been outsourced to the insurance industry and its affiliates for many years.
Finally, Medicare costs include payments to dozens of private insurance companies who provide private alternatives to Medicare, such as Medicare Advantage PPO’s and HMO’s.
Price:
Current projections are that Medicare costs will increase about 5% per year and prices will have to increase much more than that to keep the program from insolvency in the next few years.
Most adult Americans (including many that are also beneficiaries) pay varying portions of this price through special taxes, depending upon their type and amount of income.
If a Medicare beneficiary has also chosen to take Social Security income (most do), varying portions of that priceare mandatorily deducted from that Social Security income as well, automatically.
So What Does It Really Cost and How Much Is The Real Price?
In 2017, the Medicare program made over $700 Billion in Payments to private insurance administrators and care providers for Traditional Medicare or for alternatives (Medicare Advantage). That year, about 58 Mil beneficiaries were enrolled in the program. The result is a cost for each Beneficiary of just over $1,000 per month. In 2019 that cost and related price will both be higher due to inflation.
But thebeneficiary share of that price also varies widely based upon several factors. Those include income, the number of qualifying years of employment and whether Part B or Part D (coverage for Doctors and Prescriptions) is chosen or waived. (This will be further offset by the amount [if any] of Social Security income deducted first).
Given all that, Medicare Prices for 2019range as follows:
So Is Medicare Free?
When you consider a program that on average costs over $1,000 per beneficiary per month …
… Then knowing that a substantial part of the needed price is covered by the tax on virtually all workers and other income earners …
… and since many beneficiaries may not rationalize the substantial dollars being stripped away from the (unrelated) Social Security payments to help pay their share of the price…
… and considering that a material number of beneficiaries have incomes over $85,000 per year (many still work) …
… and finally, comparing all the components of coverage Americans have received when younger and working (Hospital, Physician and Prescriptions) …
… These numbers, taken together, for many people are certainly not free.
In the mid 1960’s, Medicare was first created as a “Social Insurance Program”, designed to be consistently applied to all older Americans. Comprehensive, inexpensive, and relevant to the standards-of-care at the time, this was considered “Good” Coverage.
But the passing of years unveiled a multitude of unanticipated dynamics.
For example, the very definition of “health care” has both broadened and deepened materially since 1965. The first MRI or the first Angioplasty would not occur until a decade later.
Meanwhile, the age-65 life expectancy has expanded by nearly 50% since then, exposing the medical system to care demands and opportunities never contemplated, late in life.
While care technology, science and processes have responded to this expanding demand, they brought with them dramatically accelerating costs, year after year.
Finally, political pressures to respond to special populations, including dialysis patients, or emerging care settings like home health or hospice, or even outpatient prescription drugs… all resulted in substantial Medicare Program scope creep.
So it should not be surprising that since inception, Medicare COVERAGE itself has required regular, often dramatic modifications to keep its “social insurance purpose” in balance with these and other continually changing demands. Some of that pressure has even challenged the highly protected “social Insurance” model itself:
By the early 2000’s, these pressures yielded to means-based-pricing for seniors of varying income levels
A 2013 survey of Americans over age 65 revealed “raising the age of eligibility to 67” as the second most popular to reduce costs and improve long term viability.
Americans Are Not Very Informed About Medicare
Most Americans (even beneficiaries) are not really aware of the full effect of these sequential program changes, because they have been spread out over many years. After all, the Medicare program has been around for 50 years, but most beneficiaries participate for less than a dozen years. So, many assume this program has been stable and managable year after year, with surprising simplicity and effectiveness. But Medicare Coverage is not at all what it was 50 years ago.
Consider a small number of coverage dynamics between the late 1960’s and today:
Other coverage details and provisions have had to change along the way too, few offsetting the additional copayments, co-insurance, annual and lifetime limits or out-of-pocket cost exposure for beneficiaries.
Could Today’s Medicare Even Work Without The Private Market?
These exposures explain why most Medicare beneficiaries are compelled to purchase a supplemental private insurance plan to cover those costs not covered by today’s Medicare. Such private plans are called Medicare Supplement Plans, and they have been increasingly necessary as the exposures under the Traditional Medicare program have grown over the years. But they too have become expensive due to the the increasing uncovered portions of Medicare. Over the years, the average Medicare Supplement has increased in price from less than $20 per month in the 1980’s to a few Hundred dollars per month today.
Alternatively, Medicare beneficiaries today can choose to leave Traditional Medicare altogether, and apply their “benefit equivalent eligibility” to the purchase of an alternative from a private Insurance company. These programs, called Medicare Advantage Plans, attract nearly 1/3 of all Medicare Beneficiaries who simply can’t make Traditional Medicare pencil out.
So What Does This Mean?
Most of the Medicare-For-All proposals don’t advertise the high coverage gaps in the current model, and the dependency on either a private market supplement (Medicare Supplement Plans), or private market alternative (Medicare Advantage Plans). Without these, Medicare-For-All will be woefully inadequate to meet the coverage expectations of Americans. Alternatively, Medicare-For-All proposals could completely re-invent what Medicare is , increasing its coverage and raising its price substantially.
… like liberty and justice, Medicare is imagined by some to be All-American. But is it? Can it be? Should it be?
A Historical Perspective:
In 1965, the first year of Medicare, nearly 19 Million Americans enrolled, 56% of whom were previously uninsured according to a Kennedy-era study. It was a simple program back then, providing only acute hospital and physician coverage for Americans over age 65. It was the only real health insurance option for people over age 65, virtually all of whom retired by that age back then.
Today, an estimated 63 Mil or 18% of the US population are eligible for Medicare. And after decades of major program changes, the 2018 program covers more than just older Americans, and Medicare coverage is more complex and broader than the original program. Like the original program (Traditional Medicare), the coverage still has substantial patient exposures for deductibles, co-payments and lifetime / per-incident limits. And, despite popular folklore, it is far more expensive due to the same pressures that impact coverages for the rest of us.
Along the way, other alternative or complementary coverages have emerged. No surprise, this dynamic reflects in part, the vastly different nature and demands of American consumers including older American consumers. These newer coverage sources include private insurers, employers, unions, states, municipalities and school districts as well as expanded coverages for the poor (including the older poor).
Does Medicare ALONE Work For Those That Have Access Today?
Consider this:
38 Mil, or only 60% of those eligible are enrolled in Traditional Medicare. But because of indexing coverage limitations, only 19% of these Traditional Program participants do not have some form of supplemental or alternative coverage.
Another 9 Mil are over 65 but still working, and only because of their employer wrap-around coverage, Medicare is workable.
Another 21 Mil are enrolled in Private Alternatives to Medicare called Advantage Plans after opting out of Traditional Medicare. In 2018 there were 2,317 such Medicare Advantage plans available nationwide allowing the average beneficiary to choose among 21, an increase from 19 in 2017. This is anything but single-payer and becoming less single-payer-like each year due to natural market dynamics.
Finally, 12 Mil of all of these are also enrolled in Medicaid (dually eligible), due to low income, disability, etc. Most are part of the 38 Mil people with Traditional Medicare, but only because of the Medicaid program, their Medicare is coverage and price affordable and/or relevant.
What Does This Say About Medicare For All?
Nearly 1/2 of all who are offered Medicare today choose a private market alternative, or can only make it work due to other private market wraparound safety nets. So why do we think Medicare will be attractive to the rest of the population without similar private market protections?
It’s staggering to think of the challenges that CAHs face. Now OIG is calling for a re-examination of a program that it says has overpaid CAHs billions of dollars to provide skilled nursing services using hospital swing beds.
They’re called “Critical Access Hospitals” for a reason. These tiny healthcare outposts provide “critical access” to people who live in remote areas.
That was the intent of the legislation that created CAHs in 1997 at a time when rural hospitals were shuttering at an alarming rate. Congress understood that rural America needed extra Medicare dollars to keep the doors open at hospitals that serve an older, sicker and poorer patient mix.
It’s staggering to think of the challenges that CAHs face:
Because of their location and size, CAHs have few economies of scale, little leverage with vendors or payers, or a sufficiently large patient mix or volume of commercial payers to help cover costs.
CAHs are often limited in their ability to provide some of the more lucrative services that are cash cows for larger hospitals in urban areas.
Recruiting clinicians to rural areas is a slog.
And because of all those challenges, it’s also more difficult to merge or collaborate with other healthcare providers from such an isolated perch. It’s surprising to learn that only 40% of CAHs operate in the red.
Unfortunately, some people in Washington, DC have short institutional memories.
For the past couple of years, reports from the Office of the Inspector General at the Department of Health and Human Services have made it clear that they believe the CAH designation and funding scheme should be overhauled.
In its latest shot across the bow, OIG this week called for a re-examination of the swing bed program that allows CAHs to provide long-term care. The OIG audit claimed that the federal government has overpaid CAHs $4.1 billion over the past six years for services that could have cost less in relatively nearby skilled nursing and long-term care facilities.
Tavenner Pushes Back
Rural healthcare advocates rallied around the reply to the OIG recommendations from former Centers for Medicare & Medicaid Services Administrator Marilyn Tavenner, who challenged the OIG findings and recommendations in her formal response, and suggested that auditors don’t understand healthcare delivery in rural areas.
In that same response to OIG, however, Tavenner said the Obama 2016 budget has called for reducing the Medicare reimbursement that CAHs receive from 101% to 100% of allowable costs, and reassessing and eliminating CAH status for hospitals that are within 10 miles each other.
For a patient’s knee replacement, Medicare will pay a hospital $17,000. The same hospital can get more than twice as much, or about $37,000, for the same surgery on a patient with private insurance.
Or take another example: One hospital would get about $4,200 from Medicare for removing someone’s gallbladder. The same hospital would get $7,400 from commercial insurers.
The yawning gap between payments to hospitals by Medicare and by private health insurers for the same medical services may prove the biggest obstacle for advocates of “Medicare for all,” a government-run system.
If Medicare for all abolished private insurance and reduced rates to Medicare levels — at least 40 percent lower, by one estimate — there would most likely be significant changes throughout the health care industry, which makes up 18 percent of the nation’s economy and is one of the nation’s largest employers.
Some hospitals, especially struggling rural centers, would close virtually overnight, according to policy experts.
Others, they say, would try to offset the steep cuts by laying off hundreds of thousands of workers and abandoning lower-paying services like mental health.
he prospect of such violent upheaval for existing institutions has begun to stiffen opposition to Medicare for all proposals and to rattle health care stocks. Some officials caution that hospitals providing care should not be penalized in an overhaul.
Dr. Adam Gaffney, the president of Physicians for a National Health Program, warned advocates of a single-payer system like Medicare for all not to seize this opportunity to extract huge savings from hospitals. “The line here can’t be and shouldn’t be soak the hospitals,” he said.
“You don’t need insurance companies for Medicare for all,” Dr. Gaffney added. “You need hospitals.”
Soaring hospital bills and disparities in care, though, have stoked consumer outrage and helped to fuel populist support for proposals that would upend the current system. Many people with insurance cannot afford a knee replacement or care for their diabetes because their insurance has high deductibles.
Proponents of overhauling the nation’s health care argue that hospitals are charging too much and could lower their prices without sacrificing the quality of their care. High drug prices, surprise hospital bills and other financial burdens from the overwhelming cost of health care have caught the attention (and drawn the ire) of many in Congress, with a variety of proposals under consideration this year.
But those in favor of the most far-reaching changes, including Senator Bernie Sanders, who unveiled his latest Medicare for all plan as part of his presidential campaign, have remained largely silent on the question of how the nation’s 5,300 hospitals would be paid for patient care. If they are paid more than Medicare rates, the final price tag for the program could balloon from the already stratospheric estimate of upward of $30 trillion over a decade. Senator Sanders has not said what he thinks his plan will cost, and some proponents of Medicare for all say these plans would cost less than the current system.
The nation’s major health insurers are sounding the alarms, and pointing to the potential impact on hospitals and doctors. David Wichmann, the chief executive of UnitedHealth Group, the giant insurer, told investors that these proposals would “destabilize the nation’s health system and limit the ability of clinicians to practice medicine at their best.”
“There’s a hospital in every congressional district,” he said. Passing a Medicare for all proposal in which hospitals are paid Medicare rates “is going to be a really hard proposition.”
Richard Anderson, the chief executive of St. Luke’s University Health Network, called the proposals “naïve.” Hospitals depend on insurers’ higher payments to deliver top-quality care because government programs pay so little, he said.
“I have no time for all the politicians who use the health care system as a crash-test dummy for their election goals,” Mr. Anderson said.
The American Hospital Association, an industry trade group, is starting to lobby against the Medicare for all proposals. Unlike the doctors’ groups, hospitals are not divided. “There is total unanimity,” said Tom Nickels, an executive vice president for the association.
“We agree with their intent to expand coverage to more people,” he said. “We don’t think this is the way to do it. It would have a devastating effect on hospitals and on the system over all.”
Rural hospitals, which have been closing around the country as patient numbers dwindle, would be hit hard, he said, because they lack the financial cushion of larger systems.
Big hospital systems haggle constantly with Medicare over what they are paid, and often battle the government over charges of overbilling. On average, the government program pays hospitals about 87 cents for every dollar of their costs, compared with private insurers that pay $1.45.
Some hospitals make money on Medicare, but most rely on higher private payments to cover their overall costs.
Medicare, which accounts for about 40 percent of hospital costs compared with 33 percent for private insurers, is the biggest source of hospital reimbursements. The majority of hospitals are nonprofit or government-owned.
The profit margins on Medicare are “razor thin,” said Laura Kaiser, the chief executive of SSM Health, a Catholic health system. In some markets, her hospitals lose money providing care under the program.
She says the industry is working to bring costs down. “We’re all uber-responsible and very fixated on managing our costs and not being wasteful,” Ms. Kaiser said.
“If you’re in a consolidated market, you are a monopolist and are setting the price,” said Mark Miller, a former executive director for the group that advises Congress on Medicare payments. He describes the prices paid by private insurers as “completely unjustified and out of control.”
Many hospitals have invested heavily in amenities like single rooms for patients and sophisticated medical equipment to attract privately insured patients. They are also major employers.
“You would have to have a very different cost structure to survive,” said Melinda Buntin, the chairwoman for health policy at the Vanderbilt University School of Medicine. “Everyone being on Medicare would have a large impact on their bottom line.”
People who have Medicare, mainly those over 65 years old, can enjoy those private rooms or better care because the hospitals believed it was worth making the investments to attract private patients, said Craig Garthwaite, a health economist at the Kellogg School of Management at Northwestern University. If all hospitals were paid the same Medicare rate, the industry “should really collapse down to a similar set of hospitals,” he said.
Whether hospitals would be able to adapt to sharply lower payments is unclear.
“It would force health care systems to go on a very serious diet,” said Stuart Altman, a health policy professor at Brandeis University. “I have no idea what would happen. Nor does anyone else.”
But proponents should not expect to save as much money as they hope if they cut hospital payments. Some hospitals could replace their missing revenue by charging more for the same care or by ordering more billable tests and procedures, said Dr. Stephen Klasko, the chief executive of Jefferson Health. “You’d be amazed,’ he said.
While both the Medicare-for-all bill introduced by Representative Pramila Jayapal, Democrat of Washington, and the Sanders bill call for a government-run insurance program, the Jayapal proposal would replace existing Medicare payments with a whole new system of regional budgets.
“We need to change not just who pays the bill but how we pay the bill,” said Dr. Gaffney, who advised Ms. Jayapal on her proposal.
Hospitals would be able to achieve substantial savings by scaling back administrative costs, the byproduct of a system that deals with multiple insurance carriers, Dr. Gaffney said. Under the Jayapal bill, hospitals would no longer be paid above their costs, and the money for new equipment and other investments would come from a separate pool of money.
But the Sanders bill, which is supported by some Democratic presidential candidates including Senators Kirsten Gillibrand of New York, Cory Booker of New Jersey, Elizabeth Warren of Massachusetts and Kamala Harris of California, does not envision a whole new payment system but an expansion of the existing Medicare program. Payments would largely be based on what Medicare currently pays hospitals.
Some Democrats have also proposed more incremental plans. Some would expand Medicare to cover people over the age of 50, while others wouldn’t do away with private health insurers, including those that now offer Medicare plans.
Even under Medicare for all, lawmakers could decide to pay hospitals a new government rate that equals what they are being paid now from both private and public insurers, said Dr. David Blumenthal, a former Obama official and the president of the Commonwealth Fund.
“It would greatly reduce the opposition,” he said. “The general rule is the more you leave things alone, the easier it is.”
According to data from CMS, while dual-eligible patients make up only 15 percent of Medicaid enrollees, they are responsible for 33 percent of the program’s expenditures.
The Centers for Medicare & Medicaid Services is looking to partner with states to determine better models to treat the 12 million dual-eligible Medicaid and Medicare beneficiaries in the country.
CMS and states spend more than $300 billion annually on this patient population, many of whom suffer from multiple chronic conditions made more difficult to treat by social and economic barriers.
The cost for dual-eligible population is outsized when compared to its size. According to data from CMS, while dual-eligible patients make up only 15 percent of Medicaid enrollees, they are responsible for 33 percent of the program’s expenditures.
“Less than 10 percent of dually eligible individuals are enrolled in any form of care that integrates Medicare and Medicaid services, and instead have to navigate disconnected delivery and payment systems,” CMS Administrator Seema Verma said in a statement.
“This lack of coordination can lead to fragmented care for individuals, misaligned incentives for payers and providers, and administrative inefficiencies and programmatic burdens for all.”
The goal from the agency is to promote new models which can better integrate Medicare and Medicaid services and create a more seamless experience for both beneficiaries and providers working across the two programs.
One major goal is to allow states to share in savings and benefits gained from investment in better care for the dual-eligible population.
In a letter addressed to state Medicaid leaders, Verma laid out a few potential payment approaches to address the issue of dual eligible patients, including a capitated payment model which would provide the full array of Medicare and Medicaid services with a set dollar reimbursement amount.
Nine states are currently piloting the model, which creates a three-way contract between the state, CMS and Medicare-Medicaid Plans. So far, CMS said state savings for states have averaged 4.4 percent in these test markets.
Through the experiments, Verma said the agency has been able to foster a competitive marketplace with multiple offerings that incentivizes health plans to invest in services that address the patient population.
CMS said it is currently open to extending the initial state pilots and expanding the geographic scope of the capitated programs.
For states that administer dual-eligible patients on a fee-for-service basis, Verma laid out a merged managed care model that would allow states to share in Medicare savings for metrics like reducing hospital readmissions.
Washington and Colorado are currently testing out the model. In one instance, providers in Washington are using Medicaid health homes to deliver high-intensity care to high-risk beneficiaries and sharing in the cost savings.
CMS said preliminary data from Washington’s program has been positive, with gross savings for Medicare Part A and Part B of 11 percent over three years. This has resulted in $36 million in performance payments to the state.
The letter from CMS also opens up the opportunity to potentially partner on state-specific models developed internally meant to better serve dual eligible patients and reduce Medicare and Medicaid expenditures.
CMS has made payment delivery reform a key initiative, with the ultimate goal of moving towards a outcomes-based payment system and reducing expenditures as Medicare faces an uncertain future.
Anyone interacting with the U.S. health care system is bound to encounter examples of unnecessary administrative complexity—from filling out duplicative intake forms to transferring medical records between providers to sorting out insurance bills. This administrative complexity, with its associated high costs, is often cited as one reason the United States spends double the amount per capita on health care compared with other high-income countries even though utilization rates are similar.1
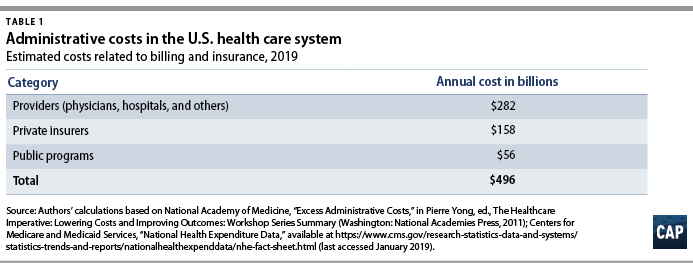
Each year, health care payers and providers in the United States spend about $496 billion on billing and insurance-related (BIR) costs, according to Center for American Progress estimates presented in this issue brief. As health care costs continue to rise, a logical starting point for potential savings is addressing waste. A 2010 report by the National Academy of Medicine (NAM) estimated that the United States spends about twice as much as necessary on BIR costs.2 That administrative excess currently amounts to $248 billion annually, according to CAP’s calculations.
This issue brief provides an overview of administrative expenditures in the U.S. health care system. It first explains the components of administrative costs and then presents estimates of the administrative costs borne by payers and providers. Finally, the issue brief describes how the United States can lower administrative costs through comprehensive reforms and incremental changes to its health care system. Many of the universal health care plans being discussed to expand coverage and lower costs would lower administrative costs through rate regulation, global budgeting, or simplifying the number of payers.3 Each of these financing changes deserves consideration—even in the absence of major systemwide reform.
Components of administrative costs
The main components of administrative costs in the U.S. health care system include BIR costs and hospital or physician practice administration.4 The first category, BIR costs, is part of the administrative overhead that is baked into consumers’ insurance premiums and providers’ reimbursements. It includes the overhead costs for the health insurance industry and providers’ costs for claims submission, claims reconciliation, and payment processing. The health care system also requires administration beyond BIR activities, including medical record-keeping; hospital management; initiatives that monitor and improve care quality; and programs to combat fraud and abuse.
To date, few studies have estimated the systemwide cost of health care administration extending beyond BIR activities. In a 2003 article in The New England Journal of Medicine, researchers Steffie Woolhandler, Terry Campbell, and David Himmelstein concluded that overall administrative costs in 1999 amounted to 31 percent of total health care expenditures or $294 billion5—roughly $569 billion today when adjusted for medical care inflation.6 A more recent paper by Woolhandler and Himmelstein, which looked at 2017 spending levels, placed the total cost of administration at $1.1 trillion.7
Billing and insurance-related costs
Many studies of administrative costs limit their scope to BIR costs. The BIR component of administration is most relevant to systemwide reforms that seek to reduce the expenses related to claims processing, billing rates, or health insurance. The largest share of BIR costs is attributable to insurance companies’ profits and overhead and to providers8where BIR costs include tasks such as record-keeping for claims submission and billing.
The costs associated with BIR administration can extend beyond the chief parties involved in receiving and submitting claims. The process of claims denials has become an industry unto itself, with private firms squeezing dollars out of Medicaid programs.9 One study estimated that the aggregate value of challenged claims ranges from $11 billion to $54 billion annually.10 Claims can also be manipulated to boost providers’ or insurers’ profits by recording services rendered in maximum detail and exaggerating the severity of patients’ conditions—a practice known as upcoding.11 Upcoding costs Medicare Advantage billions of dollars in excess expenditures,12 and in many cases the practice constitutes fraud.13
The NAM published one of the most thorough reports on U.S. administrative costs related to billing and insurance in 2010. In a synthesis of the literature on administrative costs, the NAM report concluded that BIR costs totaled $361 billion in 2009—about $466 billion in current dollars—among private insurers, public programs, and providers, amounting to 14.4 percent of U.S. health care spending at the time. The NAM estimated that BIR costs account for 13 percent of physician care spending; 8.5 percent of hospital care spending; 10 percent of spending on other providers; 12.3 percent of spending on private insurance; and 3.5 percent of public program spending, including Medicare and Medicaid.14
Applying the NAM’s percentages of BIR costs to recent projections of national health expenditures from the Centers for Medicare and Medicaid Services (CMS), CAP estimates that BIR costs will amount to $496 billion for 2019.15 (see Table 1) According to CAP’s calculations, this includes $158 billion in overhead for private insurance; $56 billion for administration of public insurance programs; and $282 billion for the BIR costs of hospitals, physicians, and other care providers. CAP’s estimate does not include the administrative costs associated with retail sales of medical products, including prescription drugs and durable medical equipment.
Even the most inclusive studies of administrative costs have not included at least one key piece of the U.S. health care system, namely, patients.16 The administrative complexity of the U.S. system also burdens patients, whether they are deciphering bewildering bills or shuttling records between providers. Three-quarters of consumers report being confused by medical bills and explanations of benefits.17 A Kaiser Family Foundation survey of people newly enrolled in the health insurance marketplace found that many were not confident in their understanding of the definitions of basic terms and concepts such as “premium,” “deductible,” or “provider network.”18 Insurers and employers spend an estimated $4.8 billion annually to assist consumers with low health insurance literacy, according to the consulting firm Accenture.19
Excess administrative costs
While U.S. administrative care spending is indisputably higher than that of other comparable countries, it’s unclear how much of the difference is excess and how much of that excess could be trimmed. The NAM report estimated that excess BIR costs amount to $190 billion—$245 billion in current dollars—or roughly half of total BIR expenditures in a year.20 The NAM report estimated that 66 percent of BIR costs for private insurers and 50 percent of BIR costs among providers are excess.21Based on these percentages, $248 billion of the total $496 billion BIR costs in CAP’s updated estimate are excess administrative costs.
Most studies that have attempted to identify excess costs in the American health care system rely on comparisons between the United States and Canada.22 In their 2010 review of the literature on the difference between the two countries’ health expenditures, economists Alexis Pozen and David M. Cutler looked at the sources of the gap between U.S. and Canadian health spending. They found that 62 percent of the difference between the two countries was attributable to prices and intensity of care, and 38 percent was linked to administrative costs.23Compared with Canada, the United States has 44 percent more administrative staff, and U.S. physicians dedicate about 50 percent more time on administrative tasks.24 Inflated to current dollars and today’s population, Pozen and Cutler’s estimate of per capita administrative excess in the United States, when compared with Canada, translates into a gap of $340 billion.25
Woolhandler and Himmelstein estimate that the United States currently spends $1.1 trillion on health care administration, and of that amount, $504 billion is excess.26Woolhandler and Himmelstein rely on surveys of physicians’ time use and utilized physician income data to translate the share of time physicians spend on administrative tasks into monetary value; their estimate of excess costs is the difference between U.S. and Canadian administrative spending27 Woolhandler and Himmelstein’s original 2003 article estimated that Canada spent $307 per capita on health system administration, compared with $1,059 per capita in the United States. Assuming this difference is excess requires an assumption that a Canadian-style health care system would achieve an identical level of administrative costs in the United States.
A separate criticism of the original 2003 Woolhandler and Himmelstein estimates, as articulated by Henry J. Aaron, an economist at the Brookings Institution, is that their methodology failed to account for differences in prices.28 Woolhandler and Himmelstein arrive at their national total administrative costs by tallying up costs in each country for items such as rent and salaries. As a consequence, the U.S.-Canada comparison captures not just the differences in the quantity of resources devoted to administration—such as physician time or office space—but also the differences in office rates, wages, and salaries. Taking Woolhandler and Himmelstein’s estimate of total administrative costs as a given and then making standard adjustments for price differences, Aaron argues that the two researchers exaggerated U.S. administrative spending in their 2003 report and that the true portion of excess would be about one-quarter less than what they estimated.
All estimates of administrative costs are inherently sensitive to what portion of health care spending one considers administrative.29 For example, time spent recording diagnosis or prescription information used in billing may also be vital for patient care, allowing medical teams to share up-to-date information or avoid harmful drug interactions. A recent study of an electronic health records (EHR) system estimated that on average, half of a primary care physician’s day is spent on EHR interaction, including billing, coding, ordering, and communication.30 Such tasks, however, can fall into a gray area between administrative and clinical. In a separate study, economist Julie Sakowski and her fellow researchers reported finding varying attitudes among physicians about whether interaction with electronic medical records—a subset of EHR—represented administrative or clinical time. As Sakowski and co-authors wrote, “Some felt they spent extra effort adding documentation that was needed only for billing. Others seemed to feel that nearly all of that information was needed for accurate clinical records.”31
Administrative costs for payers
Within the U.S. system, the share of expenditures that are attributable to administrative costs varies greatly by payer. The BIR costs for traditional Medicare and Medicaid hover around 2 percent to 5 percent, while those for private insurance is about 17 percent.32Some public finance experts, including Robert Book, have argued that the low levels of Medicare overhead are deceptive. Because seniors have relatively high health expenditures, the argument goes, administrative costs make up a relatively small share of their total health care spending. However, Medicare’s per capita administrative expenditures are higher than those in other forms of insurance.33 Even if one compares higher-end estimates of Medicare administrative costs to low-end estimates of costs for private insurance, the gulf between administrative costs for Medicare and private coverage is large.34 Organisation for Economic Co-operation and Development (OECD) data also show that other nations are able to achieve low levels of administrative costs while maintaining universal coverage across all ages of the population.35
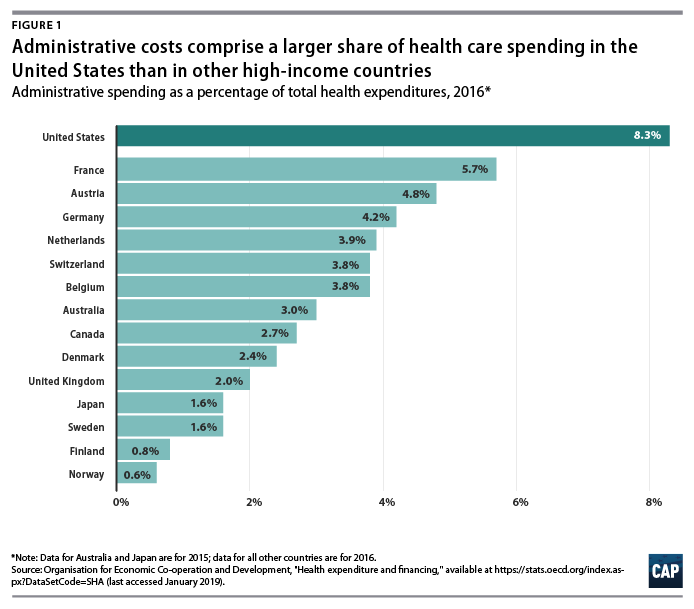
International health system data demonstrate that the United States is a clear outlier on administrative spending. And while the OECD’s definition includes administrative costs to government, public insurance funds, and private insurance, but not those borne by hospitals, physicians, and other providers, the stark difference is still informative. In 2016, administration accounted for 8.3 percent of total health care expenditures in the United States—the largest share among comparable nations. (see Figure 1) Countries with single-payer systems are among those with the lowest administrative costs. For example, administrative spending accounts for just 2.7 percent of total health care expenditures in Canada.36 OECD data also show that within a country, administrative costs are higher in private insurance than in government-run programs.37
Countries that have multipayer systems with stricter rate regulation also achieve much lower administrative costs than the United States. Administrative expenditures account for 4.8 percent of total health care expenditures in Germany, 3.9 percent in the Netherlands, 3.8 percent in Switzerland, and 1.6 percent in Japan, according to the OECD. If the United States could reduce administrative costs down to Canadian levels, it would save 68 percent of current administrative expenditures; reducing to German-level administrative costs would save 42 percent of current administrative expenditures. However, to assume that by simply adapting another country’s health care system—whether it is Canada’s single-payer Medicare, Germany’s sickness funds, or Switzerland’s heavily regulated private plans—the United States would automatically achieve the same level of administrative costs may ignore other fundamental differences between countries, including the market power of health care providers, political systems, and attitudes toward health care. Nevertheless, the experience of other multipayer systems such as those in Germany and Switzerland suggests that the United States could substantially reduce both administrative expenditures and overall health care spending by bringing down reimbursement rates and regulating insurance—even while continuing to allow multiple payers and private health care providers.
The lowest possible level of administrative spending for the U.S. health care system is not necessarily the optimal level of spending. As researchers Robert A. Berenson and Bryan E. Dowd have noted, administrative spending in Medicare may in fact be too low; the program would be more efficient with greater investment in initiatives to lower costs and improve quality.38 Many reforms that could generate overall savings require administrative resources to design and implement. Innovations such as bundled payments—the practice of paying providers a lump sum for an episode of care such as a knee replacement or childbirth rather than reimbursing each individual component—involve upfront investment in development. Increasing resources to combat fraud and abuse would also lower overall spending. While the U.S. Department of Health and Human Services (HHS) boasts that it sees a $5 return on every $1 it puts toward fraud and abuse investigations, that number indicates that the government may be underinvesting in those efforts.39
Administrative costs for health care providers
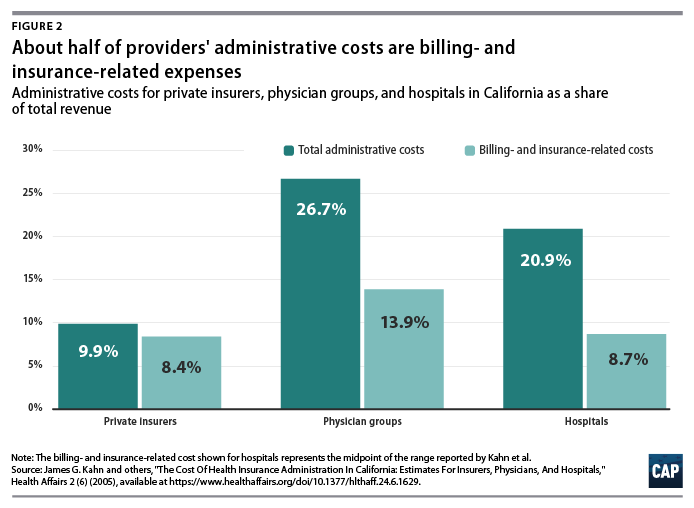
A number of studies have focused on the administrative costs borne by providers. Beyond BIR expenses, hospitals, physician practices, and other health care institutions house departments that are complementary to clinical services such as medical libraries, public relations, and accounting.40 A study of administrative costs in California found that administrative costs represented about one-quarter of physician revenue and one-fifth of hospital revenue, and BIR costs accounted for roughly half of administrative expenditures for physician and hospital services covered by private insurance.41 (see Figure 2) In a separate study, Himmelstein and others reported that one-quarter of U.S. hospital spending went toward administration; they found little difference between nonprofit hospitals and for-profit institutions, where administrative spending was 25 percent and 27.2 percent of total spending, respectively.42
On a per-encounter basis, BIR costs vary as a proportion of overall cost depending on the type of visit. In a 2018 study of an academic health care system, Phillip Tseng and others found that professional billing costs amounted to $20.49 for a primary care visit, $61.54 for an emergency department visit, and $124.26 for a general inpatient stay.43 Relative to the professional revenue associated with each encounter studied, the emergency department visit ranked the highest, with billing costs equal to 25.2 percent of revenue. Inpatient visits were the lowest, at 8 percent of a general inpatient stay and 3.1 percent for inpatient surgery.44 Encounters involving hospital care incurred additional facility-level billing costs. (see Figure 3)
In addition to the dollar cost of BIR activity, the study also reported the time spent on administration for typical encounters. The average processing time was 13 minutes for a primary care visit, 32 minutes for an emergency department visit, and 73 minutes for a general inpatient stay.45
Among other research on provider BIR costs, a 2009 study by Larry Casalino and others estimated that the cost of the time physicians spend on interactions with health plans is about $23 billion to $31 billion per year.46 A 2011 study by Dante Morra of the University of Toronto and others estimated that interaction with payers costs the equivalent of $22,205 per physician annually in Canada and $82,975 per physician annually in the United States, suggesting that the United States would save $27.6 billion annually if U.S. administrative costs could be brought down to Canadian levels.47
As with BIR costs, provider administrative costs in the United States are higher than those in other comparable countries. Hospital administrative costs in the United States far exceed those of other nations. In their comparison of hospital administrative costs among eight Western nations, Himmelstein and co-authors found that the United States had the highest levels, at 25.3 percent of total hospital expenditures.48 They conclude that in nations where hospital administrators have minimal responsibilities for procuring financing and where the hospital reimbursement system is least complex, administrative costs can be reduced to 12 percent of expenditures.49 These findings suggest that reforms that introduce global budgeting or limit the need to bargain with multiple payers could potentially bring down excess hospital administrative costs in the United States.
Lower administrative costs in single-payer and multipayer systems
Although administrative costs contribute to the high expenditures in the United States, they are not the primary reason for the health care spending gap. As economist Uwe Reinhardt and others candidly put it, “It’s the prices, stupid.”50 The United States pays more for care than other countries do—both for administrative services and for other components of health care.
Policies that target administrative costs alone would not necessarily bring overall U.S. health care expenditures in line with other countries. As economists Sherry Glied and Adam Sacarny observed, “there are very substantial variations in administrative costs among countries with universal health insurance, which do not translate directly into variations in overall costs.”51Comparative evidence from U.S. states also suggests that America’s multipayer system explains some, but by no means all, of the discrepancy between the United States and other developed nations. Harvard University researchers Joseph P. Newhouse and Anna Sinaiko observe that “there is considerable variation across the states in spending levels, with the lowest quintile of states spending approximately the same percentage as the higher spending OECD countries other than the U.S. This implies that the [United States’] pluralistic financing system may not be an important cause of the large percentage of GDP that the U.S. devotes to health care.”52
Systemwide reforms to lower administrative costs
Health care financing experts believe that changes to how Americans pay for coverage could dramatically reduce administrative costs. Researchers simulating the effects of single-payer programs have assumed that administrative costs would be brought down substantially. The Urban Institute set administrative costs at a “plausible” 6 percent of health care claims for their simulation of the single-payer plan proposed by Sen. Bernie Sanders (I-VT), noting that they “do not believe that administrative costs can fall far below this level; far too many administrative functions must be conducted.”53 In its analysis of a single-payer system for New York state, the RAND Corporation assumed administrative costs at 6 percent of total health expenditures in its base case, representing a reduction from 18 percent among commercial insurers and 7 percent in New York’s Medicaid program. RAND specified administrative costs at 13 percent and 3 percent in its alternative scenarios. 54 In a separate column, however, RAND researcher Jodi Liu cautioned that achieving the administrative expenditure levels of other countries “may be aspirational and is not guaranteed” under a single-payer system.55
Exactly how such lower costs could be achieved is another question. Reducing BIR costs requires simplifying the billing and payment process, which could be accomplished in a number of ways. Two avenues for reducing administrative costs as well as overall health costs are global budgeting and uniform rate-setting.56 These two concepts are central to health systems around the world and are also responsible for keeping administrative costs lower, whether a country has a multipayer or single-payer system. Another paperwork-reducing option would be a centralized claims clearinghouse to allow providers to submit all claims to a single entity, as they do in Germany and Japan. 57
All-payer rates and global budgeting
Setting all-payer reimbursement rates would eliminate the need for providers to negotiate rates with individual private insurers, while also giving policymakers better leverage for controlling overall health care cost growth. In the current U.S. system, providers charge different rates to different payers, and the billing process is complicated and opaque. The list prices that hospitals are now required to publish bear little connection to what individual patients—or those patients’ insurers—actually pay.58 Setting all-payer rates would simplify billing and improve transparency by establishing a single set of rates for each provider, while also giving regulators a tool to protect consumers from exorbitant rates.59
Global budgeting—the practice of paying providers revenue based on their expected costs—also holds promise for both lowering administrative spending and overall costs. As opposed to traditional fee-for-service payments, which reward providers for doing more, global budgeting incentivizes providers to deliver care more efficiently.60 Global budgeting is a feature of many countries with much lower health care administrative costs, including Scotland, Wales, and Germany.61 As Woolhandler, Campbell, and Himmelstein point out in their 2003 article, “The existence of global budgets in Canada has eliminated most billing and minimized internal cost accounting, since charges do not need to be attributed to individual patients and insurers.”62 As Germany shows, both single-payer and multipayer systems can use global budgets.
A system combining all-payer rates and global budgeting is already partially in place in the state of Maryland, where each hospital has a single set of rates it bills to Medicare, Medicaid, commercial insurers, and other payers. Maryland’s system is keeping overall cost growth lower than the national trend.63 According to RAND analysis of hospital costs, Maryland hospitals have administrative costs that are 9 percent lower than the national average and not far off from the 13 percent savings RAND assumed providers would achieve under a single-payer system. 64
Centralized claims processing
Germany and Japan both have multiple payers but centralized claims processing.65Despite having more than 3,000 health plans,66 Japan’s administrative expenditures were a stunningly low 1.6 percent of overall health care costs in 2015, one of the lowest among OECD member nations.67
In their analysis of three universal health care options for Vermont, including single payer, researchers William C. Hsiao, Steven Kappel, and Jonathan Gruber estimated substantial savings from administrative simplicity from each option. The two single-payer options they examined would result in even greater administrative savings of between 7.3 percent and 7.8 percent, depending on the rate-setting mechanism.68 The group estimated that a third scenario, which would establish a centralized claims clearinghouse while allowing multiple payers, could generate savings equal to 3.6 percent of total expenditures.69This suggests that about half of the total administrative savings from a single-payer system could be obtained within a regulated multipayer system.
Policy proposals directed at administrative costs
While major changes to the U.S. health care system have the greatest potential to bring down costs, more incremental changes could reduce administrative waste. A recent bill proposed by Sens. Bill Cassidy (R-LA) and Tina Smith (D-MN) would direct the HHS secretary to set goals to cut “unnecessary costs and administrative burdens” throughout the health care system by 50 percent over the next 10 years. It would also provide grant money for state-based efforts to bring down administrative costs.70Some possible avenues for achieving those kinds of reductions include changes to payment rules, improvements to facilitate electronic record-keeping and information exchange, and simplification of public insurance programs.
In their 2009 article in TheNew England Journal of Medicine, David Cutler, Elizabeth Wikler, and Peter Basch proposed one such package of reforms. The authors estimated that providers could save $17.9 billion to $23 billion annually with several, more incremental changes to the system, including greater adoption of EHR systems; integrated administrative and clinical systems; national and standardized reporting requirements and credentialing of providers; streamlined enrollment in public insurance programs; and greater automation.71 In a separate report, the same authors proposed additional reforms that they estimated could reduce excess administrative costs by $40 billion, or 25 percent of total health care expenditures.72
In a 2010 study published in Health Affairs, Bonnie B. Blanchfield and other Massachusetts researchers concluded that the administrative burden on physician organizations could be reduced by a “single transparent set of payment rules for a system with multiple payers.” The authors recommended that the United States adopt “a standard set of payment requirements, increased payment-rule transparency, standardized forms, and a standard set of data exchange requirements.” Doing so could save $7 billion in billing costs for physician and other clinical services, according to the authors’ estimates.73
Conclusion
Although estimates vary, a large body of evidence shows that the United States is spending about twice as much as needed on the administration of health care. Other nations enjoy world-class health care systems while spending a fraction of what the United States does on governance, billing, and insurance.
A structural overhaul of how health care is financed and priced that includes key features of other countries’ systems—whether one payer or many—would go a long way toward eliminating excess administrative costs. Simplifying the payment system should be an essential part of future health reform and would make the U.S. system work better for taxpayers and patients alike.