Colleen Lindholz, president of Kroger Health, spoke about the grocery store’s plans to expand further into healthcare.
KEY TAKEAWAYS
Kroger is look to assist customers who have issues with the accessibility and affordability of prescription drugs.
To that end, the Cincinnati-based grocery store giant launched a pharmacy savings club in partnership with GoodRx last December.
Lindholz also impressed the need to incorporate ‘food as medicine’ into the company’s healthcare plans.
Cincinnati-based grocery and retail giant Kroger Co. has ambitions to continue its healthcare expansion mission, according to Colleen Lindholz, president of Kroger Health.
Kroger is one of the largest grocery stores and retail companies in the country, with about 2,300 pharmacies and 221 retail clinics, offering it a sizable footprint to compete in healthcare. Lindholz has been with the company for more than two decades and has helped craft its business strategy focused on health and wellness.
“Our vision is to help people live healthier lives, and our mission statement states that we’re going to simplify healthcare by creating solutions that combine health, wellness, and nutrition to connect with people on a personal level,” Lindholz told HealthLeaders.
From Lindholz’s perspective, there are several opportunities for Kroger to grow in healthcare, most notably through improving prescription drug delivery in a way that benefits consumers and focuses on promoting ‘food as medicine.’ However, she also spoke to the lingering challenges Kroger faces, including industry consolidation, difficult negotiations with pharmacy benefit managers (PBM), and rising direct and indirect remuneration (DIR) fees.
Below are some takeaways from Lindholz on what lies ahead for Kroger in the healthcare sphere.
MANEUVERING PBMS AND DIR FEES
Lindholz said that Kroger, like other healthcare players, is subject to the pressures produced by widespread vertical integration and consolidation. Kroger’s strategy to drive prescriptions into its stores has been affected by the fact that it contracts with multiple PBMs, the major ones being owned by large health plans.
“We’re seeing a lot of pressure as far as reimbursements are concerned and DIR fees, which are escalating out of control,” Lindholz said. “I know there’s some activity going on in Washington right now with a call for DIR reform and where should most of the cost reduction be.”
Lindholz added that Kroger remains a supporter of the concept of DIR fees, citing the purpose for their initial creation as a way to provide a higher quality of care for patients.
“However, we are getting hit with DIR fees that are 300% ahead of where we were in 2016,” Lindholz said.
PBMs also compound the problem for Kroger, according to Lindholz, since they act as a negotiator with the drugmakers but ultimately set the standards for how rebates are passed through to pharmacies.
“The way that they measure us and the way that we compete to get those rebates back, where 2,300 pharmacies are compared to an independent that has five pharmacies, is crazy,” Lindholz said. “I think the way that they’re measuring it is all for their gain, not necessarily for the patient’s gain. We want the lowest cost to be at the point of sale where the patient actually is.”
‘FOOD AS MEDICINE’
A key component to addressing chronic disease is addressing what people eat, Lindholz said. Kroger introduced its free “OptUp” app in an attempt to correct some of the root problems that contribute to chronic disease.
In 2017, Kroger conducted a study to analyze A1Cs, the average blood sugar over 90 days, and blood pressure in diabetic employees and leverage nutritional science to assist them in making food purchasing decisions.
Kroger was so encouraged by the results of the study that it had nutrition and technology experts at the company design an app driven by the Kroger loyalty card as a way to “simplify Kroger customers’ ability to shop for healthier foods.”
“The results were so statistically significant that we decided to bring the app to the market because we believe that over time it can sustain behavior change,” Lindholz said. “What we’re trying to do is be in the prevention space, specifically around diabetes, where we’re helping our diabetics make those food choices that they critically need in order to keep from progressing with their disease and going from two oral medications onto insulin.”
A spokesperson from Kroger said the company will soon be rolling out an update to the app to allow customers the ability to shop for healthier foods, even if they do not shop at Kroger.
Lindholz also commented that healthcare is a fragmented industry, citing the lack of communication between different electronic medical records (EMR) systems.
Lindholz said the company sought to create a solution to foster a better line of communication with systems that run on Epic and Cerner.
“We’re building a platform that we’re going to be able to see across all of our pharmacies and will connect with the top 17 EMRs in the country,” Lindholz said. “It’s important in our quest to go after the triple aim and to decrease some of this fragmentation while closing gaps in care.”
“One of the unique pieces of that new platform is that it will be the first time that anyone’s ever included a food score. We’re going to test in Cincinnati with a cardiologist and an endocrinologist around getting to look at how customers eat, if we can help change their behavior, and will their overall outcomes be better over time?”
TACKLING PRESCRIPTION DRUG PRICES
Given Lindholz’s background as a pharmacist, it should come as no surprise that one of her major initiatives at Kroger is improving the availability and affordability of prescription drugs for customers. To that end, Lindholz noted that Kroger currently has three central prescription fill facilities around the country that fill prescriptions overnight so Kroger can have the lowest cost to fill.
“This allows us to spend more time with the patients that are in the store and deliver the highest quality of care that we can at the lowest cost,” Lindholz said. “We’re doing a lot more one-on-one counseling with customers, both at the counter and also through a center of excellence that we have. We’re up 320% in clinical interventions versus a year ago and that is due to us putting a system in place that queued up pharmacists at the time either when they’re with patients at the store or through our call center.”
Kroger also launched a pharmacy savings club in partnership with GoodRx last December to assist customers dealing with high prices and limited access to prescription drugs.
“What that club does is it brings transparency and pricing directly to the customer. It costs $36 for an individual, $72 for a family, and we are delivering a significant amount of savings to the consumer,” Lindholz said. “What we’re doing with the savings club is cutting out the middleman. We’re taking all the rebates that we would get from the manufacturers and passing them directly down to our customers, which is saving them a whole lot of money.”
Anyone interacting with the U.S. health care system is bound to encounter examples of unnecessary administrative complexity—from filling out duplicative intake forms to transferring medical records between providers to sorting out insurance bills. This administrative complexity, with its associated high costs, is often cited as one reason the United States spends double the amount per capita on health care compared with other high-income countries even though utilization rates are similar.1
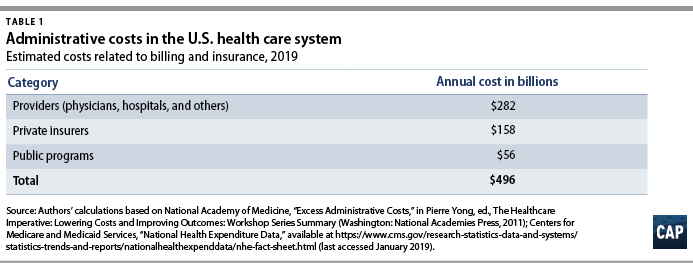
Each year, health care payers and providers in the United States spend about $496 billion on billing and insurance-related (BIR) costs, according to Center for American Progress estimates presented in this issue brief. As health care costs continue to rise, a logical starting point for potential savings is addressing waste. A 2010 report by the National Academy of Medicine (NAM) estimated that the United States spends about twice as much as necessary on BIR costs.2 That administrative excess currently amounts to $248 billion annually, according to CAP’s calculations.
This issue brief provides an overview of administrative expenditures in the U.S. health care system. It first explains the components of administrative costs and then presents estimates of the administrative costs borne by payers and providers. Finally, the issue brief describes how the United States can lower administrative costs through comprehensive reforms and incremental changes to its health care system. Many of the universal health care plans being discussed to expand coverage and lower costs would lower administrative costs through rate regulation, global budgeting, or simplifying the number of payers.3 Each of these financing changes deserves consideration—even in the absence of major systemwide reform.
Components of administrative costs
The main components of administrative costs in the U.S. health care system include BIR costs and hospital or physician practice administration.4 The first category, BIR costs, is part of the administrative overhead that is baked into consumers’ insurance premiums and providers’ reimbursements. It includes the overhead costs for the health insurance industry and providers’ costs for claims submission, claims reconciliation, and payment processing. The health care system also requires administration beyond BIR activities, including medical record-keeping; hospital management; initiatives that monitor and improve care quality; and programs to combat fraud and abuse.
To date, few studies have estimated the systemwide cost of health care administration extending beyond BIR activities. In a 2003 article in The New England Journal of Medicine, researchers Steffie Woolhandler, Terry Campbell, and David Himmelstein concluded that overall administrative costs in 1999 amounted to 31 percent of total health care expenditures or $294 billion5—roughly $569 billion today when adjusted for medical care inflation.6 A more recent paper by Woolhandler and Himmelstein, which looked at 2017 spending levels, placed the total cost of administration at $1.1 trillion.7
Billing and insurance-related costs
Many studies of administrative costs limit their scope to BIR costs. The BIR component of administration is most relevant to systemwide reforms that seek to reduce the expenses related to claims processing, billing rates, or health insurance. The largest share of BIR costs is attributable to insurance companies’ profits and overhead and to providers8where BIR costs include tasks such as record-keeping for claims submission and billing.
The costs associated with BIR administration can extend beyond the chief parties involved in receiving and submitting claims. The process of claims denials has become an industry unto itself, with private firms squeezing dollars out of Medicaid programs.9 One study estimated that the aggregate value of challenged claims ranges from $11 billion to $54 billion annually.10 Claims can also be manipulated to boost providers’ or insurers’ profits by recording services rendered in maximum detail and exaggerating the severity of patients’ conditions—a practice known as upcoding.11 Upcoding costs Medicare Advantage billions of dollars in excess expenditures,12 and in many cases the practice constitutes fraud.13
The NAM published one of the most thorough reports on U.S. administrative costs related to billing and insurance in 2010. In a synthesis of the literature on administrative costs, the NAM report concluded that BIR costs totaled $361 billion in 2009—about $466 billion in current dollars—among private insurers, public programs, and providers, amounting to 14.4 percent of U.S. health care spending at the time. The NAM estimated that BIR costs account for 13 percent of physician care spending; 8.5 percent of hospital care spending; 10 percent of spending on other providers; 12.3 percent of spending on private insurance; and 3.5 percent of public program spending, including Medicare and Medicaid.14
Applying the NAM’s percentages of BIR costs to recent projections of national health expenditures from the Centers for Medicare and Medicaid Services (CMS), CAP estimates that BIR costs will amount to $496 billion for 2019.15 (see Table 1) According to CAP’s calculations, this includes $158 billion in overhead for private insurance; $56 billion for administration of public insurance programs; and $282 billion for the BIR costs of hospitals, physicians, and other care providers. CAP’s estimate does not include the administrative costs associated with retail sales of medical products, including prescription drugs and durable medical equipment.
Even the most inclusive studies of administrative costs have not included at least one key piece of the U.S. health care system, namely, patients.16 The administrative complexity of the U.S. system also burdens patients, whether they are deciphering bewildering bills or shuttling records between providers. Three-quarters of consumers report being confused by medical bills and explanations of benefits.17 A Kaiser Family Foundation survey of people newly enrolled in the health insurance marketplace found that many were not confident in their understanding of the definitions of basic terms and concepts such as “premium,” “deductible,” or “provider network.”18 Insurers and employers spend an estimated $4.8 billion annually to assist consumers with low health insurance literacy, according to the consulting firm Accenture.19
Excess administrative costs
While U.S. administrative care spending is indisputably higher than that of other comparable countries, it’s unclear how much of the difference is excess and how much of that excess could be trimmed. The NAM report estimated that excess BIR costs amount to $190 billion—$245 billion in current dollars—or roughly half of total BIR expenditures in a year.20 The NAM report estimated that 66 percent of BIR costs for private insurers and 50 percent of BIR costs among providers are excess.21Based on these percentages, $248 billion of the total $496 billion BIR costs in CAP’s updated estimate are excess administrative costs.
Most studies that have attempted to identify excess costs in the American health care system rely on comparisons between the United States and Canada.22 In their 2010 review of the literature on the difference between the two countries’ health expenditures, economists Alexis Pozen and David M. Cutler looked at the sources of the gap between U.S. and Canadian health spending. They found that 62 percent of the difference between the two countries was attributable to prices and intensity of care, and 38 percent was linked to administrative costs.23Compared with Canada, the United States has 44 percent more administrative staff, and U.S. physicians dedicate about 50 percent more time on administrative tasks.24 Inflated to current dollars and today’s population, Pozen and Cutler’s estimate of per capita administrative excess in the United States, when compared with Canada, translates into a gap of $340 billion.25
Woolhandler and Himmelstein estimate that the United States currently spends $1.1 trillion on health care administration, and of that amount, $504 billion is excess.26Woolhandler and Himmelstein rely on surveys of physicians’ time use and utilized physician income data to translate the share of time physicians spend on administrative tasks into monetary value; their estimate of excess costs is the difference between U.S. and Canadian administrative spending27 Woolhandler and Himmelstein’s original 2003 article estimated that Canada spent $307 per capita on health system administration, compared with $1,059 per capita in the United States. Assuming this difference is excess requires an assumption that a Canadian-style health care system would achieve an identical level of administrative costs in the United States.
A separate criticism of the original 2003 Woolhandler and Himmelstein estimates, as articulated by Henry J. Aaron, an economist at the Brookings Institution, is that their methodology failed to account for differences in prices.28 Woolhandler and Himmelstein arrive at their national total administrative costs by tallying up costs in each country for items such as rent and salaries. As a consequence, the U.S.-Canada comparison captures not just the differences in the quantity of resources devoted to administration—such as physician time or office space—but also the differences in office rates, wages, and salaries. Taking Woolhandler and Himmelstein’s estimate of total administrative costs as a given and then making standard adjustments for price differences, Aaron argues that the two researchers exaggerated U.S. administrative spending in their 2003 report and that the true portion of excess would be about one-quarter less than what they estimated.
All estimates of administrative costs are inherently sensitive to what portion of health care spending one considers administrative.29 For example, time spent recording diagnosis or prescription information used in billing may also be vital for patient care, allowing medical teams to share up-to-date information or avoid harmful drug interactions. A recent study of an electronic health records (EHR) system estimated that on average, half of a primary care physician’s day is spent on EHR interaction, including billing, coding, ordering, and communication.30 Such tasks, however, can fall into a gray area between administrative and clinical. In a separate study, economist Julie Sakowski and her fellow researchers reported finding varying attitudes among physicians about whether interaction with electronic medical records—a subset of EHR—represented administrative or clinical time. As Sakowski and co-authors wrote, “Some felt they spent extra effort adding documentation that was needed only for billing. Others seemed to feel that nearly all of that information was needed for accurate clinical records.”31
Administrative costs for payers
Within the U.S. system, the share of expenditures that are attributable to administrative costs varies greatly by payer. The BIR costs for traditional Medicare and Medicaid hover around 2 percent to 5 percent, while those for private insurance is about 17 percent.32Some public finance experts, including Robert Book, have argued that the low levels of Medicare overhead are deceptive. Because seniors have relatively high health expenditures, the argument goes, administrative costs make up a relatively small share of their total health care spending. However, Medicare’s per capita administrative expenditures are higher than those in other forms of insurance.33 Even if one compares higher-end estimates of Medicare administrative costs to low-end estimates of costs for private insurance, the gulf between administrative costs for Medicare and private coverage is large.34 Organisation for Economic Co-operation and Development (OECD) data also show that other nations are able to achieve low levels of administrative costs while maintaining universal coverage across all ages of the population.35
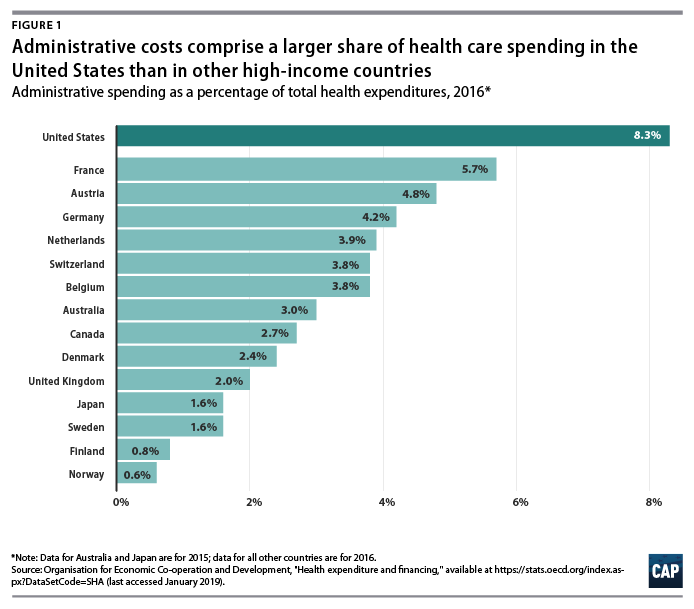
International health system data demonstrate that the United States is a clear outlier on administrative spending. And while the OECD’s definition includes administrative costs to government, public insurance funds, and private insurance, but not those borne by hospitals, physicians, and other providers, the stark difference is still informative. In 2016, administration accounted for 8.3 percent of total health care expenditures in the United States—the largest share among comparable nations. (see Figure 1) Countries with single-payer systems are among those with the lowest administrative costs. For example, administrative spending accounts for just 2.7 percent of total health care expenditures in Canada.36 OECD data also show that within a country, administrative costs are higher in private insurance than in government-run programs.37
Countries that have multipayer systems with stricter rate regulation also achieve much lower administrative costs than the United States. Administrative expenditures account for 4.8 percent of total health care expenditures in Germany, 3.9 percent in the Netherlands, 3.8 percent in Switzerland, and 1.6 percent in Japan, according to the OECD. If the United States could reduce administrative costs down to Canadian levels, it would save 68 percent of current administrative expenditures; reducing to German-level administrative costs would save 42 percent of current administrative expenditures. However, to assume that by simply adapting another country’s health care system—whether it is Canada’s single-payer Medicare, Germany’s sickness funds, or Switzerland’s heavily regulated private plans—the United States would automatically achieve the same level of administrative costs may ignore other fundamental differences between countries, including the market power of health care providers, political systems, and attitudes toward health care. Nevertheless, the experience of other multipayer systems such as those in Germany and Switzerland suggests that the United States could substantially reduce both administrative expenditures and overall health care spending by bringing down reimbursement rates and regulating insurance—even while continuing to allow multiple payers and private health care providers.
The lowest possible level of administrative spending for the U.S. health care system is not necessarily the optimal level of spending. As researchers Robert A. Berenson and Bryan E. Dowd have noted, administrative spending in Medicare may in fact be too low; the program would be more efficient with greater investment in initiatives to lower costs and improve quality.38 Many reforms that could generate overall savings require administrative resources to design and implement. Innovations such as bundled payments—the practice of paying providers a lump sum for an episode of care such as a knee replacement or childbirth rather than reimbursing each individual component—involve upfront investment in development. Increasing resources to combat fraud and abuse would also lower overall spending. While the U.S. Department of Health and Human Services (HHS) boasts that it sees a $5 return on every $1 it puts toward fraud and abuse investigations, that number indicates that the government may be underinvesting in those efforts.39
Administrative costs for health care providers
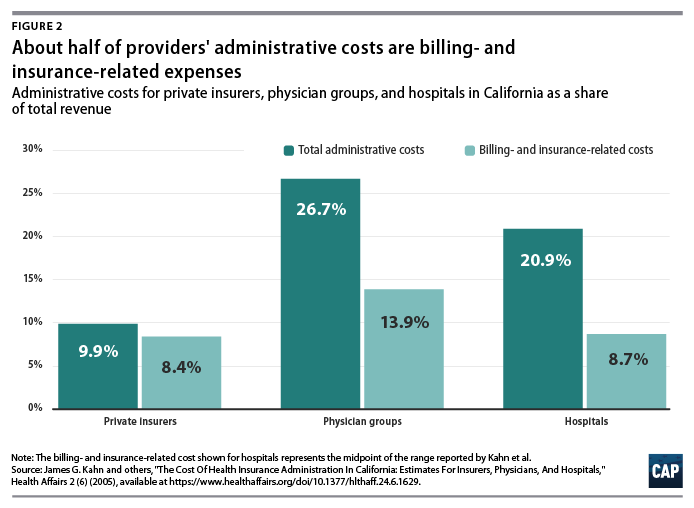
A number of studies have focused on the administrative costs borne by providers. Beyond BIR expenses, hospitals, physician practices, and other health care institutions house departments that are complementary to clinical services such as medical libraries, public relations, and accounting.40 A study of administrative costs in California found that administrative costs represented about one-quarter of physician revenue and one-fifth of hospital revenue, and BIR costs accounted for roughly half of administrative expenditures for physician and hospital services covered by private insurance.41 (see Figure 2) In a separate study, Himmelstein and others reported that one-quarter of U.S. hospital spending went toward administration; they found little difference between nonprofit hospitals and for-profit institutions, where administrative spending was 25 percent and 27.2 percent of total spending, respectively.42
On a per-encounter basis, BIR costs vary as a proportion of overall cost depending on the type of visit. In a 2018 study of an academic health care system, Phillip Tseng and others found that professional billing costs amounted to $20.49 for a primary care visit, $61.54 for an emergency department visit, and $124.26 for a general inpatient stay.43 Relative to the professional revenue associated with each encounter studied, the emergency department visit ranked the highest, with billing costs equal to 25.2 percent of revenue. Inpatient visits were the lowest, at 8 percent of a general inpatient stay and 3.1 percent for inpatient surgery.44 Encounters involving hospital care incurred additional facility-level billing costs. (see Figure 3)
In addition to the dollar cost of BIR activity, the study also reported the time spent on administration for typical encounters. The average processing time was 13 minutes for a primary care visit, 32 minutes for an emergency department visit, and 73 minutes for a general inpatient stay.45
Among other research on provider BIR costs, a 2009 study by Larry Casalino and others estimated that the cost of the time physicians spend on interactions with health plans is about $23 billion to $31 billion per year.46 A 2011 study by Dante Morra of the University of Toronto and others estimated that interaction with payers costs the equivalent of $22,205 per physician annually in Canada and $82,975 per physician annually in the United States, suggesting that the United States would save $27.6 billion annually if U.S. administrative costs could be brought down to Canadian levels.47
As with BIR costs, provider administrative costs in the United States are higher than those in other comparable countries. Hospital administrative costs in the United States far exceed those of other nations. In their comparison of hospital administrative costs among eight Western nations, Himmelstein and co-authors found that the United States had the highest levels, at 25.3 percent of total hospital expenditures.48 They conclude that in nations where hospital administrators have minimal responsibilities for procuring financing and where the hospital reimbursement system is least complex, administrative costs can be reduced to 12 percent of expenditures.49 These findings suggest that reforms that introduce global budgeting or limit the need to bargain with multiple payers could potentially bring down excess hospital administrative costs in the United States.
Lower administrative costs in single-payer and multipayer systems
Although administrative costs contribute to the high expenditures in the United States, they are not the primary reason for the health care spending gap. As economist Uwe Reinhardt and others candidly put it, “It’s the prices, stupid.”50 The United States pays more for care than other countries do—both for administrative services and for other components of health care.
Policies that target administrative costs alone would not necessarily bring overall U.S. health care expenditures in line with other countries. As economists Sherry Glied and Adam Sacarny observed, “there are very substantial variations in administrative costs among countries with universal health insurance, which do not translate directly into variations in overall costs.”51Comparative evidence from U.S. states also suggests that America’s multipayer system explains some, but by no means all, of the discrepancy between the United States and other developed nations. Harvard University researchers Joseph P. Newhouse and Anna Sinaiko observe that “there is considerable variation across the states in spending levels, with the lowest quintile of states spending approximately the same percentage as the higher spending OECD countries other than the U.S. This implies that the [United States’] pluralistic financing system may not be an important cause of the large percentage of GDP that the U.S. devotes to health care.”52
Systemwide reforms to lower administrative costs
Health care financing experts believe that changes to how Americans pay for coverage could dramatically reduce administrative costs. Researchers simulating the effects of single-payer programs have assumed that administrative costs would be brought down substantially. The Urban Institute set administrative costs at a “plausible” 6 percent of health care claims for their simulation of the single-payer plan proposed by Sen. Bernie Sanders (I-VT), noting that they “do not believe that administrative costs can fall far below this level; far too many administrative functions must be conducted.”53 In its analysis of a single-payer system for New York state, the RAND Corporation assumed administrative costs at 6 percent of total health expenditures in its base case, representing a reduction from 18 percent among commercial insurers and 7 percent in New York’s Medicaid program. RAND specified administrative costs at 13 percent and 3 percent in its alternative scenarios. 54 In a separate column, however, RAND researcher Jodi Liu cautioned that achieving the administrative expenditure levels of other countries “may be aspirational and is not guaranteed” under a single-payer system.55
Exactly how such lower costs could be achieved is another question. Reducing BIR costs requires simplifying the billing and payment process, which could be accomplished in a number of ways. Two avenues for reducing administrative costs as well as overall health costs are global budgeting and uniform rate-setting.56 These two concepts are central to health systems around the world and are also responsible for keeping administrative costs lower, whether a country has a multipayer or single-payer system. Another paperwork-reducing option would be a centralized claims clearinghouse to allow providers to submit all claims to a single entity, as they do in Germany and Japan. 57
All-payer rates and global budgeting
Setting all-payer reimbursement rates would eliminate the need for providers to negotiate rates with individual private insurers, while also giving policymakers better leverage for controlling overall health care cost growth. In the current U.S. system, providers charge different rates to different payers, and the billing process is complicated and opaque. The list prices that hospitals are now required to publish bear little connection to what individual patients—or those patients’ insurers—actually pay.58 Setting all-payer rates would simplify billing and improve transparency by establishing a single set of rates for each provider, while also giving regulators a tool to protect consumers from exorbitant rates.59
Global budgeting—the practice of paying providers revenue based on their expected costs—also holds promise for both lowering administrative spending and overall costs. As opposed to traditional fee-for-service payments, which reward providers for doing more, global budgeting incentivizes providers to deliver care more efficiently.60 Global budgeting is a feature of many countries with much lower health care administrative costs, including Scotland, Wales, and Germany.61 As Woolhandler, Campbell, and Himmelstein point out in their 2003 article, “The existence of global budgets in Canada has eliminated most billing and minimized internal cost accounting, since charges do not need to be attributed to individual patients and insurers.”62 As Germany shows, both single-payer and multipayer systems can use global budgets.
A system combining all-payer rates and global budgeting is already partially in place in the state of Maryland, where each hospital has a single set of rates it bills to Medicare, Medicaid, commercial insurers, and other payers. Maryland’s system is keeping overall cost growth lower than the national trend.63 According to RAND analysis of hospital costs, Maryland hospitals have administrative costs that are 9 percent lower than the national average and not far off from the 13 percent savings RAND assumed providers would achieve under a single-payer system. 64
Centralized claims processing
Germany and Japan both have multiple payers but centralized claims processing.65Despite having more than 3,000 health plans,66 Japan’s administrative expenditures were a stunningly low 1.6 percent of overall health care costs in 2015, one of the lowest among OECD member nations.67
In their analysis of three universal health care options for Vermont, including single payer, researchers William C. Hsiao, Steven Kappel, and Jonathan Gruber estimated substantial savings from administrative simplicity from each option. The two single-payer options they examined would result in even greater administrative savings of between 7.3 percent and 7.8 percent, depending on the rate-setting mechanism.68 The group estimated that a third scenario, which would establish a centralized claims clearinghouse while allowing multiple payers, could generate savings equal to 3.6 percent of total expenditures.69This suggests that about half of the total administrative savings from a single-payer system could be obtained within a regulated multipayer system.
Policy proposals directed at administrative costs
While major changes to the U.S. health care system have the greatest potential to bring down costs, more incremental changes could reduce administrative waste. A recent bill proposed by Sens. Bill Cassidy (R-LA) and Tina Smith (D-MN) would direct the HHS secretary to set goals to cut “unnecessary costs and administrative burdens” throughout the health care system by 50 percent over the next 10 years. It would also provide grant money for state-based efforts to bring down administrative costs.70Some possible avenues for achieving those kinds of reductions include changes to payment rules, improvements to facilitate electronic record-keeping and information exchange, and simplification of public insurance programs.
In their 2009 article in TheNew England Journal of Medicine, David Cutler, Elizabeth Wikler, and Peter Basch proposed one such package of reforms. The authors estimated that providers could save $17.9 billion to $23 billion annually with several, more incremental changes to the system, including greater adoption of EHR systems; integrated administrative and clinical systems; national and standardized reporting requirements and credentialing of providers; streamlined enrollment in public insurance programs; and greater automation.71 In a separate report, the same authors proposed additional reforms that they estimated could reduce excess administrative costs by $40 billion, or 25 percent of total health care expenditures.72
In a 2010 study published in Health Affairs, Bonnie B. Blanchfield and other Massachusetts researchers concluded that the administrative burden on physician organizations could be reduced by a “single transparent set of payment rules for a system with multiple payers.” The authors recommended that the United States adopt “a standard set of payment requirements, increased payment-rule transparency, standardized forms, and a standard set of data exchange requirements.” Doing so could save $7 billion in billing costs for physician and other clinical services, according to the authors’ estimates.73
Conclusion
Although estimates vary, a large body of evidence shows that the United States is spending about twice as much as needed on the administration of health care. Other nations enjoy world-class health care systems while spending a fraction of what the United States does on governance, billing, and insurance.
A structural overhaul of how health care is financed and priced that includes key features of other countries’ systems—whether one payer or many—would go a long way toward eliminating excess administrative costs. Simplifying the payment system should be an essential part of future health reform and would make the U.S. system work better for taxpayers and patients alike.
Value-based care demands the switch to wellcare to raise outcomes and decrease costs, Claire Pomeroy says.
Claire Pomeroy, CEO and president of the Albert and Mary Lasker Foundation, an expert in infectious diseases and a long-time advocate for patients, drove home the point of the importance of the social determinants of health by relating a story of a young woman who needed asthma medication but was unable to afford it.
She got a prescription for an inhaler she couldn’t afford, Pomeroy told a full room at HIMSS19. She knew the story because she was that woman. She needed a ride, food and money for a few days and had no way to get any of that, let alone buy a drug she couldn’t afford.
The clinicians followed all of the right clinical protocols for her condition. But, she said, “They didn’t have the information they truly needed to make me better.”
What was needed was for her clinicians to pay attention to the social determinants of health, an issue that providers are increasingly realizing need to be addressed if their population of patients is to remain healthy.
Without this attention being paid to housing, food, transportation and other socio-economic needs, costs will never be brought inline, as hospitals see patients returning to be admitted or get care through the emergency room.
“Our cost and our outcomes demand change,” Pomeroy said.
The statistics show the need. Black mothers die at truly unacceptable rates in this country, she said and all blacks in the United States have a life expectancy that is on average, 10 years less than whites.
All people in the United States who have a college degree live longer than those with a high school diploma. Stress on the job plays a part. And the opioid crisis has led to overdose deaths surpassing the odds of dying than from a car accident.
“We must redesign the U.S. healthcare system from one of sick care to wellcare,” Pomeroy said.
Healthcare makes up only 10 percent of what goes into the social determinants of health. The biggest percentage goes to behavioral patterns, genetic predisposition and social circumstances.
“We work all day and are only impacting 10-15 percent of the social determinants of health,” Pomeroy said. “Spending on social determinants make sense. We need to move beyond pilot programs and start scaling some of these things.”
Hospitals that spend money on housing to take care of their homeless population see a a 93 percent reduction in costs. For every $25 increase in delivered meals for older adults, there’s a 1 percent decline in nursing home admissions.
“Addressing the social determinants is an investment,” she said.
The biggest challenge is lack of funds for hospitals struggling to stay in the black, lack of data and siloed proprietary care information.
Information connectivity allowed one health system to learn that 31 percent of the Medicaid moms in its area were not enrolled in WIC, and therefore not getting access to food and supplies for their babies.
Technology is needed, as are more health policies for reimbursement that address risk adjustment. State innovation models help, as does the Centers for Medicare and Medicaid Services accountable health communities model, a five-year pilot looking at the connection between social assistance, health and costs.
EHRs should include information on housing, food, transportation and other needs. Systems must transform their thinking, create a new strategy, empower multidisciplinary teams, educate health professionals, invest in research and “raise our voices to drive change,” Pomeroy said.
A lot of money has been spent on information technology in health care with little to show for it. To understand why we must pay a visit to the hospital.
It only takes 10 minutes of direct observation of a nurse in a hospital to understand care-delivery processes are not standardized and are dependent on individuals, not systems. This lack of reproducibility leads to errors. Since every caregiver does it his or her own way, it’s difficult to improve anything. Stable systems that are reproducible are required to deliver consistently high quality. Industrial companies figured this out 50 years ago. The writings of manufacturing gurus Imai and Shingo provide insight into how quality is built into processes. A process must first be stabilized then standardized before being improved. Because few standardized processes exist in care delivery there are many possibilities for error. That’s why simply making a poor process electronic by implementing an electronic health record (EHR) doesn’t lead to better quality or cost.
When it comes to change, the technology is the easiest part. Most health systems in America have or are implementing the EHR. And the vendor processes for implementation have become very good. The hard part is to get the doctors, nurses, and administrators to agree on what is the best way to deliver the care. Since the doctors control most care decisions, the rest of the provider team follows the doctors’ lead. If the doctor wants to do things a certain way, that’s what is done. The problem is the next doctor wants it his way and so on. Eventually, we end up with a hopeless mess in which no one knows how anything should be done on any given day. And good luck to a new nurse or technician coming into the system who must learn a multitude of work processes and remember the doctor-dependent differences.
Health care technology is very effective when it is used to support a well-designed care process. The design of new standard care processes need to be owned and driven by the people doing the work, not by some outside consulting firm that brings a 100-page playbook as the answer. As the frontline workers create new designs, they need certain systems that can help them deliver the improved care. Examples of these systems include electronic alerts for medication interactions and reminders to ensure all steps in the care process for the pneumonia patient are followed.
There are two types of improvement systems needed to create a well-designed care process. One is an improvement approach that brings members of an existing clinical team members together to improve an existing care process. They use proven improvement methods such as the principles, systems, and tools of the Toyota Production System (TPS). The second is an innovation process aimed at radically redesigning care. It’s associated with TPS and employsdesign thinking.
In both cases, the initial effort where rapid experimentation occurs might be an ambulatory clinic or an ER. It becomes a place for others in the organization to learn. It is an inch-wide, mile-deep change in practice that incorporates new processes not only for care delivery but also management. It should result in the systems necessary for sustaining improvement over time. As the model line achieves 50% to 80% improvement over baseline performance, the learning should be spread to other parts of the organization. This new way becomes the new best-known way to deliver care.
One example of a radical innovation is the attemptof HealthEast (now part of Fairview Health Services), which serves the Minneapolis-Saint Paul area, to create the clinic of the future. The leaders brought the vendors in their extended supply chain to the table to help in the design process. This included Epic, an EHR company; Herman Miller, an office furniture company; Boldt, a construction company; and HGA, an architectural firm. Together, the team began redesigning the care-delivery model. Each vendor had the opportunity to deeply understand the needs of the HealthEast providers. By the end of the design phase a new process supported by electronic records, architecture, furniture, and building was integrated to create a unique patient experience.
Before HealthEast formed the model clinic, a group of 11 clinicians had over 11 preferred ways for “their” clinic assistant to do just about everything. One key process, screening the patient for health risks such as cancer and hypertension, resulted in over seven places in the EMR for the provider to look for relevant information. Not only is that time-consuming (contributing to physician burnout), but it also greatly increases the chances of missing important information.
The multi-disciplinary team created a single screening process. Now, clinicians have just two places to look in the EMR for information on whether patients have had screens like mammograms and colonoscopies for cancer, staff can remind patients about what screening tests they need, and leaders are able to support the development of standardized clinical processes. The leader’s standard work is to audit the process and monitor the data. If the process stops being followed or the data shows deteriorating results, leaders will know that immediately.
In the first three months after its introduction, the redesigned process reduced provider search time per patient by 23 minutes. The overall screening rate went from 60% compliance to 72% compliance, meaning over 500 more individuals were appropriately screened over baseline. Perhaps more telling are the changes in patient comments. They went from comments such as “I do not feel my medication list was reviewed,” to “My doctor and medical assistant are always timely, thorough, and reassuring.” These results would not have happened unless all parties were working to build a better process.
Technology now exists to support disruptive innovation in health care. It is an important enabler, but the process must precede the technology. For example, Hospital at Home is an innovation that may well cut the cost of care significantly by reducing the need for inpatient beds. It couldn’t happen without the technology, which allows 24-hour monitoring of patients, real-time electronic communication between providers, and complex equipment to be rapidly set up in the patient home. But it still requires a nurse and a doctor.
What that nurse and doctor do and how they do it are still what will determine successful outcomes of care. Building the care process through careful understanding of what each process step delivers is critical. The medical team can then leverage the technology for data and communication and other needs that support the steps in the process.
Again, this requires standardized work. Every nurse and doctor does not get to do it his or her own way. Standards are established about how the work is performed, and those standards are followed by all until a better way is determined collectively by the team. New innovative care models such as Hospital at Home are based on clear and reproducible standards and will obsolete the old ways of the non-standardized care delivered in most hospitals.
***
It takes more design time to create a care model that builds in quality and efficiency, but without that work upfront, the technology doesn’t matter and, in fact, only increases costs. This thinking is not new. Many industries from aviation to automotive to nuclear power have been applying this concept of “process before technology” for a long time. The safety and quality results in those industries is second to none. It’s about time health care catches up. Our lives may depend on it.
The pace of change in healthcare is not slowing down; in fact, it is accelerating. Healthcare organizations that are most successful in 2019 will know what challenges and changes are coming down the pipeline, and they will prepare accordingly.
To help ensure you don’t get left behind, we’ve assembled the top six challenges the industry will face in 2019.
1. Shifting the focus from payment reform to delivery reform. For the past few years, C-suite leaders at healthcare organizations have been focused on navigating healthcare payment reform—attempting to preserve, improve, and maintain revenue. Amidst those efforts, delivery reform has sometimes taken a back seat.
That will need to change in 2019. Organizations that are the most successful will focus more on patient care than revenue, and they will see improved outcomes and reduced costs as a result.
Many organizations are already exploring delivery reform with initiatives that focus on:
In 2019, however, they will need to bring all of these initiatives together to implement sustainable improvements in how healthcare is delivered.
An added bonus? Organizations that accomplish this will see enhanced revenue streams as value-based reimbursement accelerates.
2. Wrestling with the evolving healthcare consumer. Healthcare consumers are demanding more convenient and more affordable care options. They expect the same level of customer service they receive from other retailers—from cost-estimation tools and online appointment booking to personalized interactions and fast and easy communication options such as text messaging and live chats.
Organizations that don’t deliver on these expectations will have a difficult time retaining patients and attracting new ones.
That’s not the only consumer-related challenge healthcare organizations will face. In 2019, millennials (between the ages of 23 and 38), will make up nearly a quarter of the U.S. population.
This generation doesn’t value physician-patient relationships as highly as previous generations. In fact, nearly half of them do not have a personal relationship with their physician, according to a 2015 report by Salesforce.
Finding ways to maintain or increase the level of humanity and interaction with millennials will be a key challenge in 2019. Patient navigator solutions and other engagement tools will be critical to an organization’s success.
3. Clinician shortages. Physician and nurse shortages will continue to intensify in 2019, creating significant operational and financial challenges for healthcare organizations.
The most recent numbers from the Association of American Medical Colleges predict a shortage of up to 120,000 physicians by 2030. On the nursing side, the Bureau of Labor Statistics projects a need for 649,100 replacement nurses by 2024.
The implications of the shortages, combined with the fact that healthcare organizations face a number of new challenges in the coming years, are many. Fewer clinicians can lead to burnout, medical errors, poorer quality, and lower patient satisfaction.
Healthcare organizations that thrive amidst the shortages will find new ways to scale and leverage technology to streamline work flows and improve efficiencies.
4. Living with EHR choices. Despite the hype and hopes surrounding EHRs, many organizations have found that they are failing to deliver on their expectations.
A recent Sage Growth Partners survey found that 64 percent of healthcare executives say EHRs have failed to deliver better population health management tools, and a large majority of providers are seeking third-party solutions outside their EHR for value-based care.
The survey of 100 executives also found that less than 25% believe their EHRs can deliver on core KLAS criteria for value.
Despite the dissatisfaction surrounding EHRs, switching EHRs may be a big mistake for healthcare organizations. A recent Black Book survey found 47% of all health systems who replaced their EHRs are in the red over their replacements. A whopping 95% said they regret the decision to change systems.
Hospitals and physician may not be entirely happy with their EHR choices, but the best course may be to stick with their system. Highly successful hospitals and health systems will find ways to optimize workflow and patient care which may involve additional IT investments and best of breed investment approaches, rather than keeping all of the proverbial eggs in the EHR basket.
5. Dealing with nontraditional entrants and disruptors. In 2018, several new entrants entered and/or broadened their reach into healthcare.
New partnerships have also arisen between traditional healthcare entities that could result in significant healthcare delivery changes. Cigna and Express Scripts received the go-ahead from the DOJ for their merger in September, and CVS and Aetna formally announced the completion of their $70 billion merger November 28.
All of these new industry disruptors and mergers will impact healthcare organizations, likely creating new competition, disrupting traditional healthcare delivery mechanisms, creating price transparency and pressures, and fostering higher expectations from consumers in 2019. Keeping an eye on these potential disrupters will be important to ensuring sustained success in the long term.
6. Turning innovation into an opportunity. From new diagnostic tests and machines to new devices and drug therapies—the past few years in healthcare have seen exciting and lifesaving developments for many patients. But these new devices and treatment approaches come with a cost.
One of biggest 2018 developments that best exemplifies the challenge between innovation and cost is CAR T-cell therapy. This new cancer treatment is already saving lives, but it racks up to between $373,000 and $475,000 per treatment. When potential side effects and adverse events are accounted for, costs can reach more than $1 million per patient.
Finding the best way to incorporate new treatments like this one, while balancing outcomes, cost, and healthcare consumer demands, will be a top challenge for healthcare organizations in 2019.
Vertical integration is all the rage in healthcare these days, with Aetna, Cigna and Humana making notable plays.
If the proposed CVS-Aetna, Cigna-Express Scripts and Humana-Kindred deals are cleared by regulators, the tie-ups will have to immediately face UnitedHealth Group’s Optum, which has been ahead of the curve for years and built out a robust pharmacy benefit manager (PBM) business already along with a care services unit, employing about 30,000 physicians and counting.
UnitedHealth formed Optum by combining existing pharmacy and care delivery services within the company in 2011. Michael Weissel, Group EVP at Optum, told Healthcare Dive the company began by focusing on three core trends in the industry: data analytics, value-based care and consumerism.
Since then, the company has been on an acquisition spree to position itself as a leader in integrated services.
“For the longest time, the market assumed that they were building the Optum business [to spin it out] and what is interesting in the evolution of the industry is that that combination has now set a trend,” Dave Windley, managing director at Jefferies, told Healthcare Dive.
“United has now set the industry standard or trend … to be more vertically integrated and it seems less likely now that United would spin this out … because many of their competitors are now mimicking their strategy by trying to buy into some of the same capabilities,” he said.
Weissel said Optum will continue to push on the three identified trends in the next three to five years, with plans to invest heavily in machine learning, AI and natural language processing.
The question will be whether and how the company can keep its edge.
What Optum is
Optum is a company within UnitedHealth Group, a parent of UnitedHealthcare. Optum’s sister company UnitedHealthcare is perhaps more well known within the industry and with consumers.
However, Optum, a venture that encompasses data analytics, a PBM and doctors,has been gradually building its clout at UnitedHealth Group.
In 2017, the unit accounted for 44% of UnitedHealth Group’s profits.
In 2011, UnitedHealth Group brought together three existing service lines under one master brand. Services are delivered through three main businesses within a business within a business:
OptumHealth – the care delivery and ambulatory care capabilities of OptumCare, as well as the care management, behavioral health, and consumer offerings of Optum;
OptumInsight – the data and analytics, technology services and health care operations business; and
OptumRx – its pharmacy benefit service.
The company focuses on five core capabilities, including data and analytics, pharmacy care services, population health, healthcare delivery and healthcare operations. Services include but are certainly not limited to OptumLabs (research), OptumIQ (data analytics), Optum360 (revenue cycle management), OptumBank (health savings account) and OptumCare (care delivery services).
The Eden Prairie, MN-headquartered company has recently expanded its care delivery services, with much of the growth coming from acquisitions. The past two years have seen Optum expand its footprint into surgical care (Surgical Care Affiliates), urgent care (MedExpress) and primary care (DaVita Medical Group).
It’s a wide pool, but the strategy affords UnitedHealth the opportunity to grab more revenue by expanding its market presence. For example, the DaVita acquisition, which is still pending, allows OptumCare to operate in 35 of 75 local care delivery markets the company has targeted for development, Andrew Hayek, OptumHealth CEO, said on an earnings call in January.
Optum’s strategy of meeting patients where they are and deploying more ambulatory, preventative care services works in concert with its sister company UnitedHealthcare’s goal of reducing high-cost, unnecessary care services, when applicable. If Optum succeeds in creating healthier populations that use lower levels of care more often, that benefits the parent company UnitedHealth Group as UnitedHealthcare spends less money and time on claims processing/payout.
The strategy has been paying off so far.
Three charts that show UnitedHealth’s financial health as it relates to Optum
Optum’s presence has grown as it has steadily increased its percentage of profits for UnitedHealth Group.
Credit: Healthcare Dive / Jeff Byers
In 2011, the first year Optum was configured as it looks today, the company contributed 14.8% of total earnings through operations to UnitedHealth Group with $1.26 billion. That’s about 29 percentage points lower than in 2017, when Optum brought in $6.7 billion in profits on $83.6 billion in revenue.
Broken down, it’s clear that pharmacy services make up the lion’s share of the company’s revenue. In 2017, OptumRx earned $63.8 billion in revenue, fulfilling 1.3 billion prescriptions. OptumRx’s contributions to the company took off in 2015 when Optum acquired pharmacy benefit manager Catamaran.
Credit: Healthcare Dive / Jeff Byers
In recent years, OptumHealth has grown due to expansion in care delivery services, including consumer engagement and behavioral and population health management. The care delivery arm served 91 million people last year, up from 60 million in 2011.
OptumInsight has grown largely due to an increase in revenue cycle management and operations services in recent years.
On Wall Street, UnitedHealth Group is performing well and has seen healthy growth since 2008. The stock peaked in January and took a dive when Amazon, J.P. Morgan and Berkshire Hathaway — industry outsiders yet financial giants — announced they would create a healthcare company.
Credit: Healthcare Dive / Jeff Byers
While these charts suggest a dominant force, the stock activity shows that investors believe there’s still more room for competition, if the new entrants play their cards right.
Where Optum could lock out and rivals could cut in on competition
UnitedHealth started down this strategic path many years ago and the rest of the industry just now seems to be catching up.
“Optum’s been the leader in showing how a managed care organization with an ambulatory care delivery platform and a pharmacy benefit manager all in house can lower or maintain and bend cost trend and then drive better market share gains in their health insurance business,” Ana Gupte, managing director of healthcare services at Leerink, told Healthcare Dive. “I think they have been the impetus in the large space for the Aetna-CVS deal.”
Because the company is multi-dimensional, Optum’s competition will be varied. If all the mergers making news — including the Walmart’s rumored buyout of Humana — close, here’s what competition could look like:
Perhaps oddly, its largest revenue contributor, OptumRx, seems to have the largest vulnerability for competition in the coming years.
Optum’s competitive advantage in the PBM space is driven largely by already realized integration. Merging data across IT systems is no easy task, and Optum has spent years harmonizing pharmacy data across platforms to assist care managers in OptumCare to see medical records for United members.
Anyone with experience implementing EHR systems can tell you such integration doesn’t happen over night.
If the Cigna-Express Scripts deal closes, the equity can compete with OptumRx, but the technology investment needed to harmonize data and embed Cigna’s service and pharmacy information into Express Scripts servers will take time, Windley said. Optum, on the other hand, has invested in the effort and integration for years.
Gupte says the encroaching organizations in the PBM space have the ability to realize the efficiencies and savings and the integrated medical that Optum has been realizing across OptumRx and the managed care organization.
Optum’s leg up in PBM space could last two to three years over the competition, she said.
On the care delivery side, OptumHealth has been purchasing large physician groups for a variety of services. There are only so many large physician groups putting themselves on the market, and Optum has been making bids for them.
There’s still a bit of white space to fill in its 75 target markets, but analysts note Optum may have the competition on lock in this space
Even if CVS-Aetna closes, OptumCare is a $12 billion business with many urgent and surgery care access points. If CVS-Aetna is finalized, the company will have about 1,100 MinuteClinics capable of realizing efficiencies with Aetna, but, as Windley notes, they likely won’t have primary care or surgery care elements.
There’s also a lot of time and capital needed for building out and retrofitting retail space to medical areas.
On the surgical care services, “I don’t see either Cigna, Aetna or Humana getting into that business,” Gupte said. “That will be one element of their footprint on care delivery that will be unique and differentiated for them.”
Urgent care has the potential for outsider competition, she added. However, Optum is using its MedExpress business to treat higher acuity conditions and have an ER doctor on staff in each center. Compared to the typical types of conditions treated in retail clinics or those that would be feasible over time, Gupte believes services that could be seen in CVS or Walmart would be lower acuity, chronic care management services.
“[Optum has] been so proactive and so strategic I don’t think there’s going to be a lot of reactive catchup they have to do,” Gupte said. “I think it’s going to be hard for the other entities to play catch up, outside of the PBM.”
One potential issue will be harmonizing the disparate businesses so patients can be effectively managed across the various organizations, Trevor Price, founder and CEO of Oxean Partners, told Healthcare Dive.
“I think the biggest challenge for Optum is operationalizing the combined platform,” Price said. “The biggest question is do they continue to operate as individual businesses or do they merge into one.”
What’s next?
Optum will continue to explore ground in the three core trends it has identified.
Out of the three, consumerism has the longest path to maturity in healthcare, Weissel said, adding he believes consumerism is going to change healthcare more than any other trend over the next decade.
“There is a wave coming, and this expectation that we will move there,” he said. “Increasingly, this aging of people who become very comfortable in a different modality is going to tip the balance with how people will want to interact with healthcare. I know there’s pent up demand already.”
That means the company is putting bets into the marketplace around consumer building and segmentation models as well as thinking about how to connect data to allow patients to schedule appointments, view health records, sign up for insurance, search for providers or renew prescriptions online.
Consumer-centric projects currently underway include digital weight loss programs — including streaming fitness classes — and maternity programs to track pregnancy. The company is also experimenting with remote patient monitoring to understand the impacts on those with heart disease or asthma and to search for service opportunities.
Optum will pursue investments as well as acquisitions to push into the consumer space.
“When it comes to acquisitions to Optum overall, we’re always in the marketplace looking to extend our capabilities, to extend our reach in the care management space to fill in holes or gaps that we have,” Weissel said. “That’s a constant process in our enterprise.”
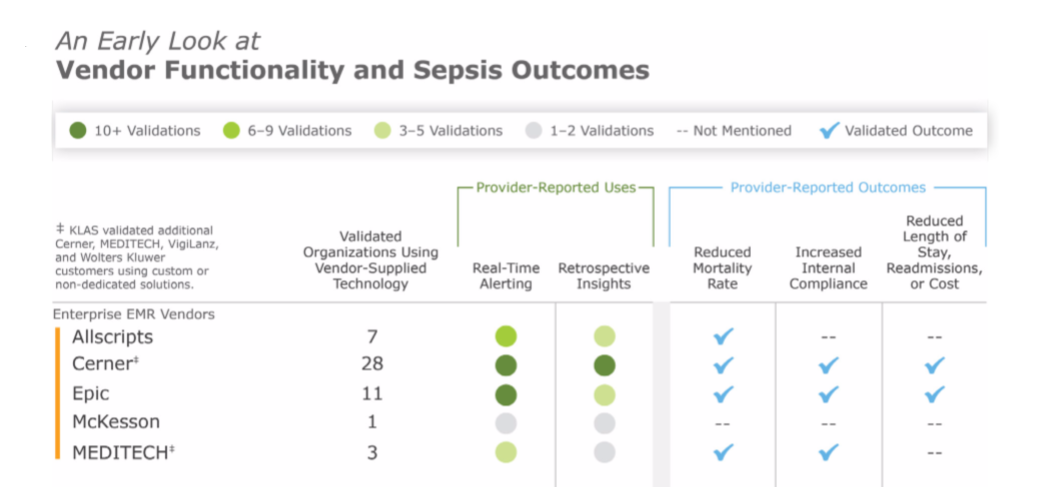
Cerner and Epic offer the most frequently adopted clinical surveillance tools in the provider market, according to a KLAS Research report.
KLAS interviewed providers about their experiences with vendors offering popular clinical surveillance tools for its report. These tools review information from data sources such as EMRs to alert clinicians about a range of patient care activities that decrease readmissions and mortality. The most common use case for clinical surveillance tools today is sepsis detection, according to KLAS.
Cerner and Epic were the only vendors KLAS validated as having “extensive adoption” for their clinical surveillance tools. Of the 17 Cerner customers surveyed, most were using the vendor’s clinical surveillance for sepsis detection. The 18 Epic customers KLAS surveyed tended to use the vendor’s functionalities for sepsis detection, orders checking and floorwide alerts, among a few other less-common use cases.
KLAS noted that although Cerner and Epic were the most widely adopted clinical surveillance vendors, customers of these two vendors tended to be “less satisfied than customers of the other charted vendors in this report,” which included companies like Bernoulli and Stanson Health.
Cerner customers told KLAS they felt the system needed to better integrate with physician workflows and lacked customization options. Epic customers said that the vendor’s alerts were difficult to set up, but were pleased with its ease of use after implementation. KLAS noted Epic does not have a dedicated clinical surveillance modality, but customers have adapted its EMR to provide similar features.
Hospital expenses are rising faster than revenue growth for health systems, resulting in declining operating income.
Health system operating income is deteriorating as hospital expenses continue to grow, according to a recent Navigant analysis.
In the three-year analysis of the financial disclosures for 104 prominent health systems that operate almost one-half of US hospitals, the healthcare consulting firm found that two-thirds of the organization saw operating income fall from FY 2015 to FY 2017. Twenty-two of these health systems had three-year operating income reductions of over $100 million each.
Furthermore, 27 percent of the health systems analyzes lost revenue on operations in at least one of the three years analyzed and 11 percent reported negative margins all three years.
In total, health systems facing operating earnings reductions lost $6.8 billion during the period, representing a 44 percent reduction.
Rapidly growing hospital expenses as the primary driver of declining operating margins, Navigant reported. Hospital expenses increased three percentage points faster hospital revenue from 2015 to 2017. Top-line operating revenue growth decreased from seven percent in 2015 to 5.5 percent by 2017.
Hospital revenue growth slowed during the period because demand went down for key hospital services, like surgery and inpatient admissions, Navigant explained.
Many of the revenue-generating services hospitals rely on are under the microscope. Policymakers and healthcare leaders are particularly looking to decrease the number of hospital admissions and safely shift inpatient surgeries to less expensive outpatient settings.
In exchange, Medicare and other leading payers are reimbursing hospitals for decreasing admissions or readmissions and their performance on other value-based metrics.
The shift to value-based reimbursement, however, is slow and steady, with just over one-third of healthcare payments currently linked to an alternative payment model. Hospitals and health systems are still learning to navigate the new payment landscape while keeping their revenue growing.
Value-based contracts also failed to deliver sufficient patient volume to counteract the discounts given to payers, Navigant added.
According to the firm, other factors contributing to a slowdown in hospital revenue growth included a decline in collection rates for private accounts and reductions in Medicare reimbursement updates because of the Affordable Care Act and the 2012 federal budget sequester.
“Because of reductions in Medicare updates from ACA and the sequester, hospital losses in treating Medicare patients rose from $20.1 billion in 2010 to $48.8 billion in 2016, according to American Hospital Association analyses,” the report stated. “The sharp $7.2 billion deterioration in Medicare margins that occurred from 2015 to 2016 surely contributed to the reduction in hospital operating margins in the same year of this analysis.”
While hospital revenue growth slowed, hospital expenses sharply rose as healthcare organizations invested in new technologies. Value-based reimbursement, federal requirements, and other components of the Affordable Care Act prompted hospitals to make strategic investments in EHRs, physicians, and population health management, causing expenses to increase, Navigant stated.
Key strategic investments made by hospitals and health systems included:
Compliance with the 2009 Health Information Technology for Economic and Clinical Health (HITECH) Act, which requires certified EHR implementation in hospitals and affiliated physician practices
Compliance with Medicare payment reform initiatives, such as accountable care organizations (ACOs) or pay-for-performance programs
Participation in new value-based contracts with payers
Establishment of employed physician groups or clinically integrated networks to develop the capabilities needed for compliance with performance- or value-based initiatives
“In addition to these strategic investments, other factors drove up routine patient care expenses, including a nursing shortage that increased nursing wages and agency expenses; specialty drug costs, particularly for chemotherapeutic agents; and, for some systems, recalibration of retirement fund costs,” the report stated.
The shift to value-based reimbursement and all of its accompanying policies will be the “new normal,” and hospitals should expect the low rate of revenue growth to persist, Navigant stated.
But hospitals and health systems can withstand the economic downturn by achieving strategic discipline and operational excellence, the firm advised.
“Systems must be disciplined to invest their growth capital in areas of actual reachable demand; that is, matched to the growth potential in the specific local markets the system serves,” the report stated. For example, creating a Kaiser-like closed panel capitated health offering in markets where there is no employer or health plan interest in buying such a product is a waste of scarce capital and management bandwidth.”
In line with strategic discipline, organizations will need to “prune” their owned assets portfolio by improving the utilization of their clinical capacity and growing patient throughput. Health systems can achieve this by focusing on scheduling and staffing, ensuring adherence to clinical pathways, streamlining discharges and care transitions, and adjusting physical capacity to actual demand.
The tools used to succeed in value-based contracts should also be applied to Medicare lines of business to reduce Medicare operating losses.
Additionally, vertical alignment will be key to weathering falling operating earnings, Navigant explained.
“Revenue growth is more likely to occur around the edges of the hospital’s core services — inpatient care, surgery, and imaging — rather than from those services themselves,” the report stated. “Creatively repackaging services like care management that is presently imbedded in every aspect of clinical operations, and finding retail demand for services presently bundled as part of the hospital’s traditional service offerings, represent such edge opportunities.”
Reducing patient leakage in multi-specialty groups and systems through improved referral patterns, scheduling, or care coordination will help to grow revenue and keep it within the system.
“To achieve better performance, health system management and boards must take a fresh look at their strategy considering local market realities. They need to look closely at the markets they serve, and size and target their offerings to actual market demand,” the report concluded. “They must re-examine and rationalize their portfolio of assets and demand marked improvements in efficiency and effectiveness, and measurable value creation for those who pay for care, particularly their patients. Since much of this should have been done five years ago, time is of the essence.”
Almost three-quarters of C-suite and supply chain leaders say their health systems prioritize value-based contracting, although barriers remain.
Most hospital and health system leaders are interested in value-based contracting when it comes to their supply chains, but a new Premier survey shows a lack of opportunities to lock down contracts with suppliers.
Among 200 C-suite executives and supply chain leaders, 73 percent said their health systems prioritize value-based contracting when looking to improve their return on investment.
IMPACT
In perhaps another sign of the inevitability of value-based care, 81 percent of respondents said they would be interested in more suppliers offering value-based contracting options.
Despite that, only 38 percent said they had participated in value-added or risk-based contracting with suppliers or pharmaceutical companies.
There are some barriers. When asked if they had considered participating in value-based contracts with suppliers with both up- and downside risk/reward, 55 percent said they didn’t know enough about shared risk contracts. Another 20 percent said they’re actively considering such contracts; 16 percent are already participating in them.
As for why many providers haven’t yet taken part in value-based or risk-based contracting with suppliers, 67 percent said it’s due to not having been engaged by a supplier. About 11 percent said it doesn’t align with the organization’s strategy.
WHAT ELSE YOU SHOULD KNOW
Respondents provided some examples of value-based contracts they had implemented, and at the top of the list was surgical services at 13 percent.
Following that was purchased services (11 percent); cardiovascular (11 percent); pharmacy and materials management (9 percent); nursing (8 percent), imaging and lab (6 percent); and facilities (5 percent).
Data was the most common challenge, cited by 22 percent of respondents. That was followed by internal communications (14 percent); coordination with suppliers (12 percent); infrastructure support (11 percent); and physician buy-in (10 percent).
THE TREND
Research this year from Sage Growth Partners highlighted the challenges providers face in succeeding under value-based contracting. Slightly more than two-thirds of the survey’s 100 respondents said value-based care has provided them with a return on investment, but many have had to supplement their electronic health records with third-party population health management solutions to get the most bang for their buck.