https://www.kff.org/medicare/issue-brief/the-facts-on-medicare-spending-and-financing/
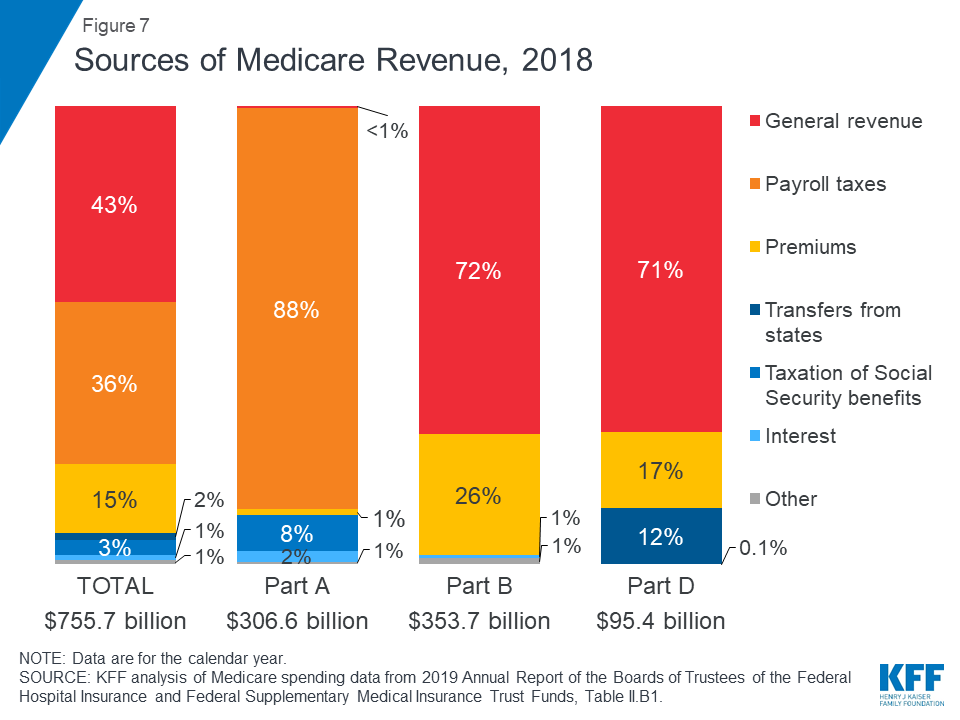
Figure 7: Sources of Medicare Revenue, 2018
Medicare, the federal health insurance program for more than 60 million people ages 65 and over and younger people with long-term disabilities, helps to pay for hospital and physician visits, prescription drugs, and other acute and post-acute care services. This issue brief includes the most recent historical and projected Medicare spending data published in the 2019 annual report of the Boards of Medicare Trustees from the Centers for Medicare & Medicaid Services (CMS) Office of the Actuary (OACT) and the 2019 Medicare baseline and projections from the Congressional Budget Office (CBO).
| Key Facts |
|
Overview of Medicare Spending
Medicare plays a major role in the health care system, accounting for 20 percent of total national health spending in 2017, 30 percent of spending on retail sales of prescription drugs, 25 percent of spending on hospital care, and 23 percent of spending on physician services. In 2018, Medicare spending (net of income from premiums and other offsetting receipts) totaled $605 billion, accounting for 15 percent of the federal budget (Figure 1).
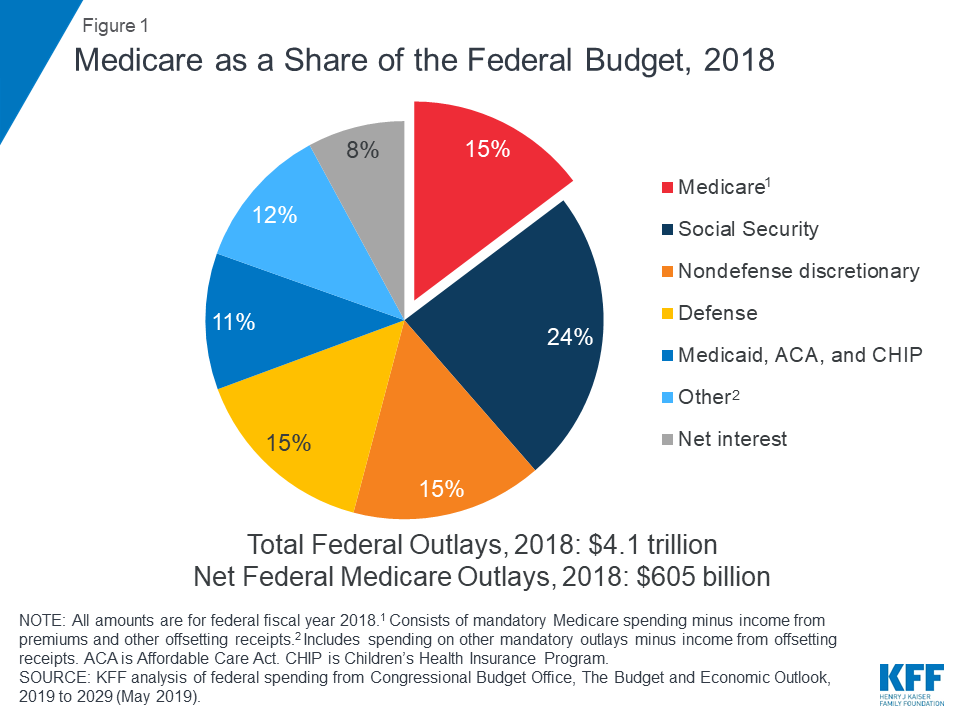
Figure 1: Medicare as a Share of the Federal Budget, 2018
Historical Trends in Medicare Spending
Trends in Medicare Benefit Payments
In 2018, Medicare benefit payments totaled $731 billion, up from $462 billion in 2008 (Figure 2) (these amounts do not net out premiums and other offsetting receipts). While benefit payments for each part of Medicare (A, B, and D) increased in dollar terms over these years, the share of total benefit payments represented by each part changed. Spending on Part A benefits (mainly hospital inpatient services) decreased from 50 percent to 41 percent, spending on Part B benefits (mainly physician services and hospital outpatient services) increased from 39 percent to 46 percent, and spending on Part D prescription drug benefits increased from 11 percent to 13 percent.
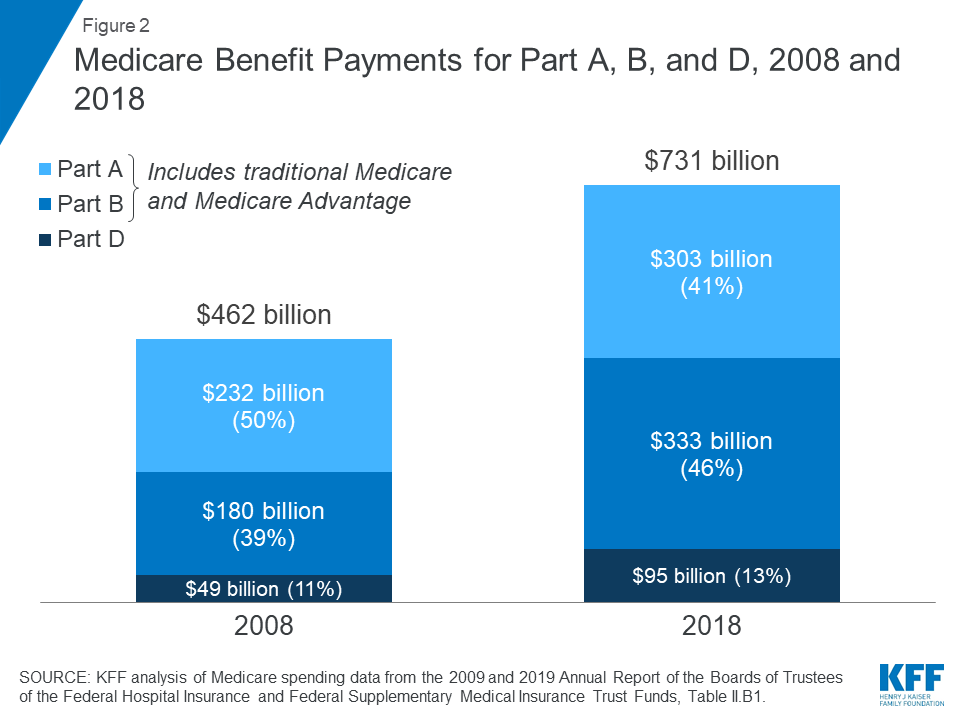
Figure 2: Medicare Benefit Payments for Part A, B, and D, 2008 and 2018
Another notable change in Medicare spending in the past 10 years is the increase in payments to Medicare Advantage plans, which are private health plans that cover all Part A and Part B benefits, and typically also Part D benefits. As a percent of total Medicare benefit spending, payments for Part A and Part B benefits covered by Medicare Advantage plans increased by nearly 50 percent between 2008 and 2018, from 21 percent ($99 billion) to 32 percent ($232 billion), as private plan enrollment grew steadily over these years (Figure 3). In 2018, 34 percent of Medicare beneficiaries were enrolled in Medicare Advantage plans, up from 22 percent in 2008.
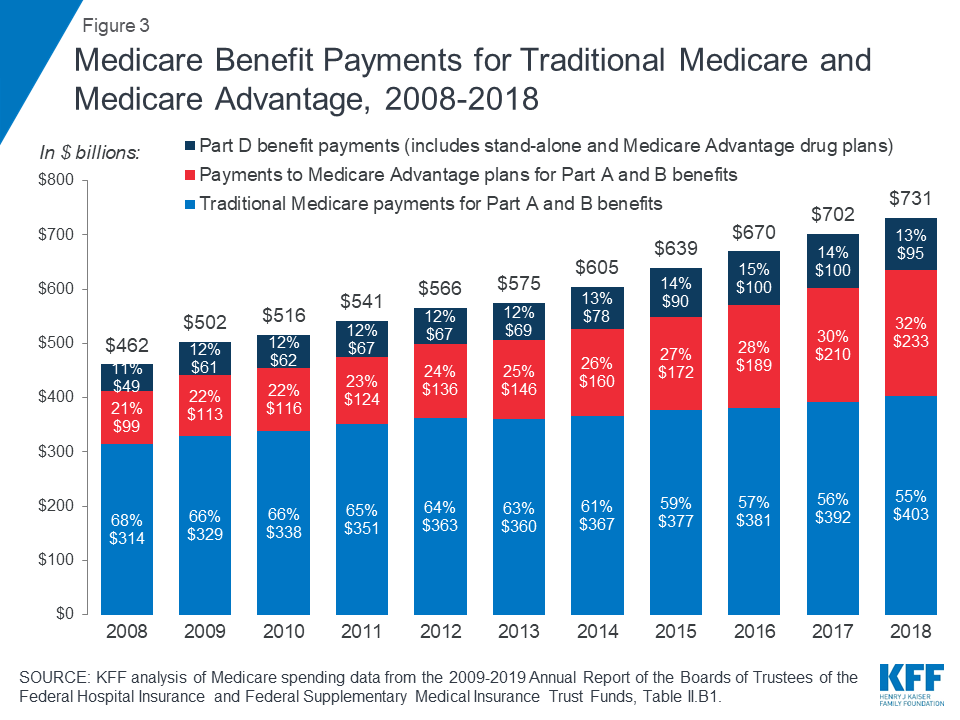
Figure 3: Medicare Benefit Payments for Traditional Medicare and Medicare Advantage, 2008-2018
The overall cost of administering benefits for traditional Medicare is relatively low. In 2018, administrative expenses for traditional Medicare (plus CMS administration and oversight of Part D) were 1.3 percent of total program spending; this includes expenses for the contractors that process claims submitted by beneficiaries in traditional Medicare and their providers. This estimate does not include insurers’ costs of administering private Medicare Advantage and Part D drug plans, which are considerably higher. Medicare’s actuaries estimate that insurers’ administrative expenses and profits for Part D plans were 10.7 percent of total plan benefit payments in 2018. The actuaries have not provided a comparable estimate for Medicare Advantage plans; however, according to a recent analysis, simple loss ratios (medical expenses as a share of total premiums collected) averaged 86 percent for Medicare Advantage plans in 2018, which means that administrative expenses, including profits, were 14 percent for Medicare Advantage plans.
Trends in Total and Per Capita Medicare Spending
There has been a notable reduction in the growth of Medicare spending in recent years, compared to prior decades, both overall and per beneficiary.
- Average annual growth in total Medicare spending was 4.4 percent between 2010 and 2018, down from 9.0 percent between 2000 and 2010, despite faster growth in enrollment since 2011 when the baby boom generation started becoming eligible for Medicare (Figure 4).
- Average annual growth in Medicare spending per beneficiary was just 1.7 percent between 2010 and 2018, down from 7.3 percent between 2000 and 2010.
- Spending on each of the three parts of Medicare (A, B, and D) has grown more slowly in recent years than in previous decades (Figure 5). For example, the average annual growth rate between 2010 and 2018 was 0.1 percent for Part A, compared to 4.4 percent in the 2000s, and 3.1 percent for Part B, compared to 7.0 percent in the 2000s.
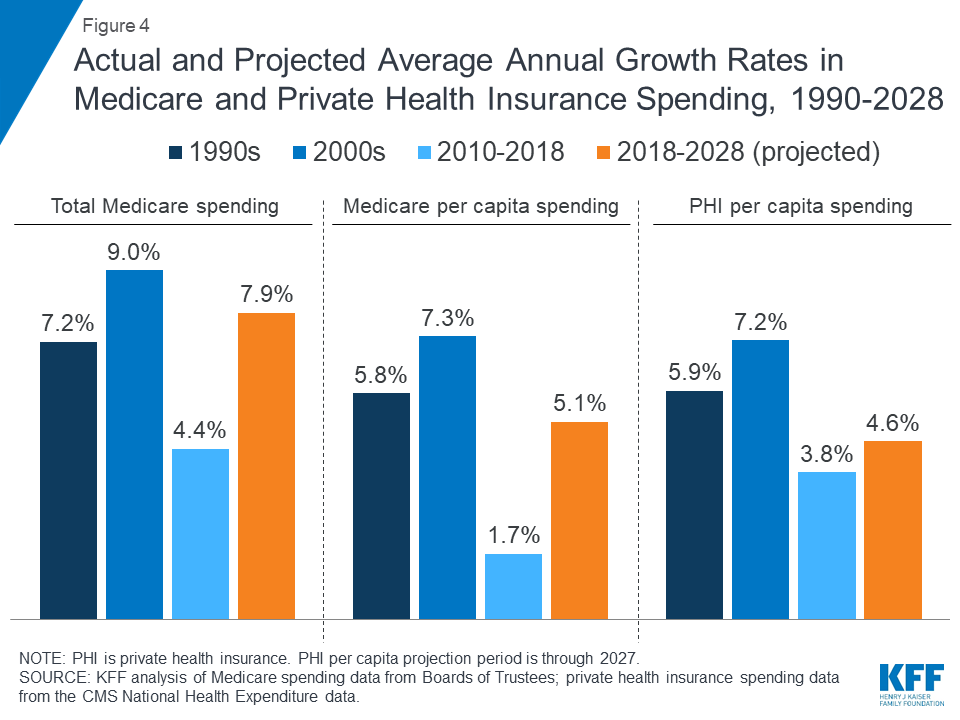
Figure 4: Actual and Projected Average Annual Growth Rates in Medicare and Private Health Insurance Spending, 1990-2028
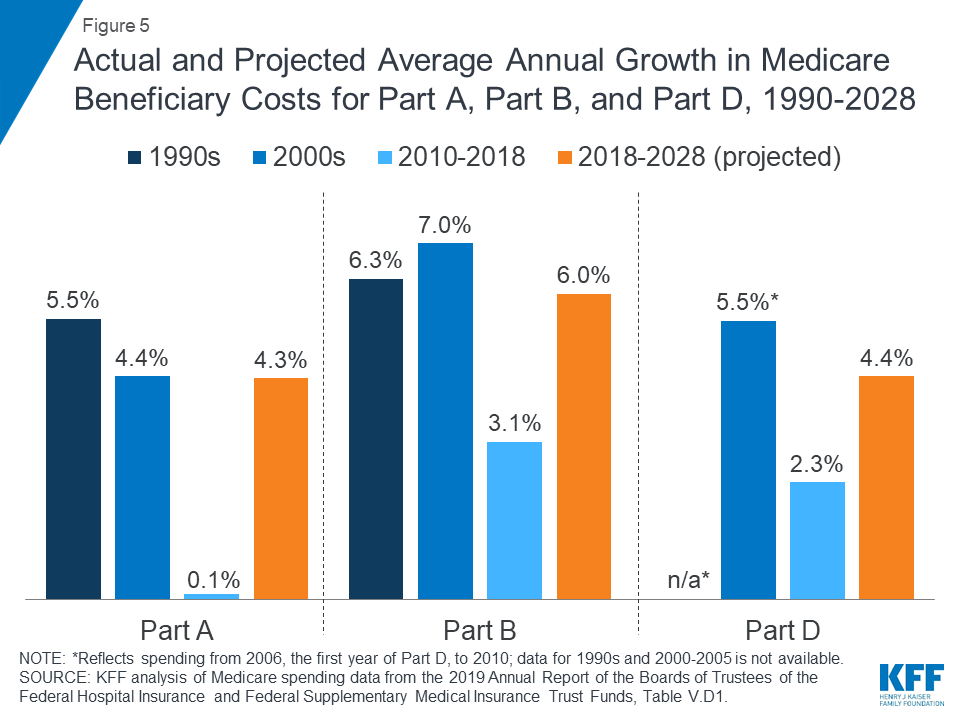
Figure 5: Actual and Projected Average Annual Growth in Medicare Beneficiary Costs for Part A, Part B, and Part D, 1990-2028
Slower growth in Medicare spending in recent years can be attributed in part to policy changes adopted as part of the Affordable Care Act (ACA) and the Budget Control Act of 2011 (BCA). The ACA included reductions in Medicare payments to plans and providers, increased revenues, and introduced delivery system reforms that aimed to improve efficiency and quality of patient care and reduce costs, including accountable care organizations (ACOs), medical homes, bundled payments, and value-based purchasing initiatives. The BCA lowered Medicare spending through sequestration that reduced payments to providers and plans by 2 percent beginning in 2013.
In addition, although Medicare enrollment has been growing between 2 percent and 3 percent annually for several years with the aging of the baby boom generation, the influx of younger, healthier beneficiaries has contributed to lower per capita spending and a slower rate of growth in overall program spending.
Spending Trends for Medicare Compared to Private Health Insurance
Prior to 2010, per enrollee spending growth rates were comparable for Medicare and private health insurance. With the recent slowdown in the growth of Medicare spending and the recent expansion of private health insurance through the ACA, however, the difference in growth rates between Medicare and private health insurance spending per enrollee has widened.
- In the 1990s and 2000s, Medicare spending per enrollee grew at an average annual rate of 5.8 percent and 7.3 percent, respectively, compared to 5.9 percent and 7.2 percent for private insurance spending per enrollee (Figure 4).
- Between 2010 and 2018, Medicare per capita spending grew considerably more slowly than private insurance spending, increasing at an average annual rate of just 1.7 percent over this time period, while average annual private health insurance spending per capita grew at 3.8 percent.
Medicare Spending Projections
Short-Term Spending Projections for the Next 10 Years
While Medicare spending is expected to continue to grow more slowly in the future compared to long-term historical trends, Medicare’s actuaries project that future spending growth will increase at a faster rate than in recent years, in part due to growing enrollment in Medicare related to the aging of the population, increased use of services and intensity of care, and rising health care prices.
Looking ahead, CBO projects Medicare spending will double over the next 10 years, measured both in total and net of income from premiums and other offsetting receipts. CBO projects net Medicare spending to increase from $630 billion in 2019 to $1.3 trillion in 2029 (Figure 6). Between 2019 and 2029, net Medicare spending is also projected to grow as a share of the federal budget—from 14.3 percent to 18.3 percent—and the nation’s economy—from 3.0 percent to 4.1 percent of gross domestic product (GDP).
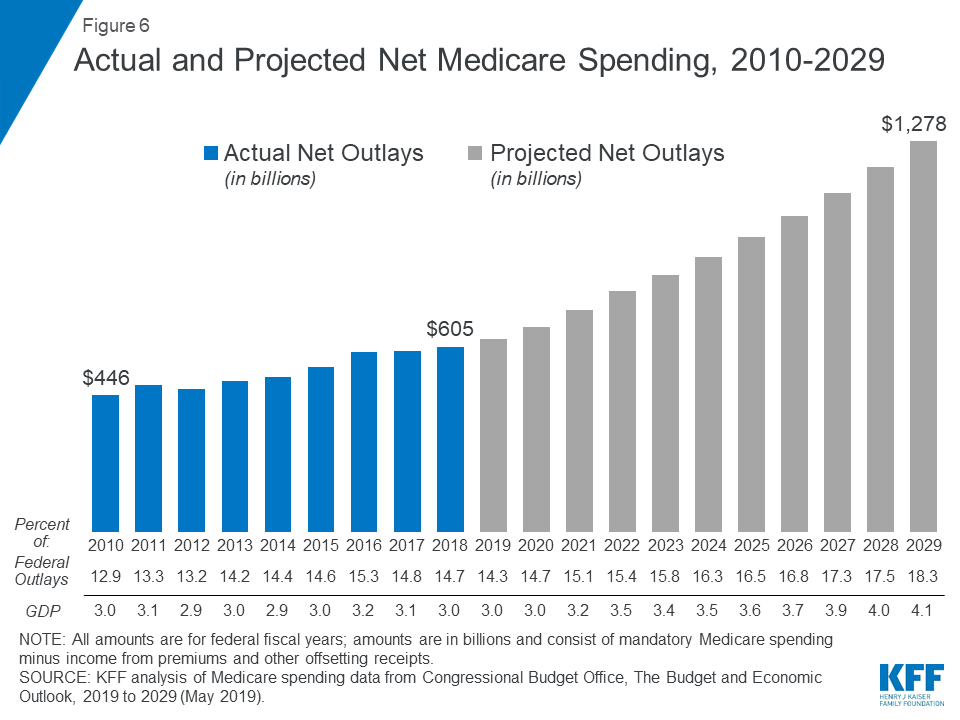
Figure 6: Actual and Projected Net Medicare Spending, 2010-2029
Spending Growth Rate Projections for the Next 10 Years
- Average annual growth in total Medicare spending is projected to be higher between 2018 and 2028 than between 2010 and 2018 (7.9 percent versus 4.4 percent) (Figure 4).
- On a per capita basis, Medicare spending is also projected to grow at a faster rate between 2018 and 2028 (5.1 percent) than between 2010 and 2018 (1.7 percent), and slightly faster than the average annual growth in per capita private health insurance spending over the next 10 years (4.6 percent).
- Medicare’s actuaries project a higher per capita growth rate in the coming decade for each part of Medicare, compared to their 2010-2018 growth rates: 6.0 percent for Part B, 4.4 percent for Part D, and 4.3 percent for Part A (Figure 5).
- Among the reasons cited for projected growth in Part B spending are legislative changes in the Bipartisan Budget Act (BBA) of 2018, including repeal of the Independent Payment Advisory Board (which also affects Part A and Part D spending projections) and repealing annual limits on therapy services covered under Part B, and higher Medicare Advantage spending. Projected increases in Part B per capita spending will lead to increases in the Part B premium and deductible.
- The projected increase in Part D per capita spending growth is driven by a slowdown in the generic dispensing rate and increased specialty drug use, offset by higher manufacturer rebates negotiated by private plans and a decline in spending for hepatitis C drugs, which was a significant driver of higher total Part D spending in 2014 and 2015.
Long-term Spending Projections
Over the longer term (that is, beyond the next 10 years), both CBO and OACT expect Medicare spending to rise more rapidly than GDP due to a number of factors, including the aging of the population and faster growth in health care costs than growth in the economy on a per capita basis. According to CBO’s most recent long-term projections, net Medicare spending will grow from 3.0 percent of GDP in 2019 to 6.0 percent in 2049.
Over the next 30 years, CBO projects that “excess” health care cost growth—defined as the extent to which the growth of health care costs per beneficiary, adjusted for demographic changes, exceeds the per person growth of potential GDP (the maximum sustainable output of the economy)—will account for half of the increase in spending on the nation’s major health care programs (Medicare, Medicaid, and subsidies for ACA Marketplace coverage), and the aging of the population will account for the other half.
How is Medicare Financed?
Medicare is funded primarily from general revenues (43 percent), payroll taxes (36 percent), and beneficiary premiums (15 percent) (Figure 7).
Figure 7: Sources of Medicare Revenue, 2018
- Part A is financed primarily through a 2.9 percent tax on earnings paid by employers and employees (1.45 percent each) (accounting for 88 percent of Part A revenue). Higher-income taxpayers (more than $200,000/individual and $250,000/couple) pay a higher payroll tax on earnings (2.35 percent).
- Part B is financed through general revenues (72 percent), beneficiary premiums (26 percent), and interest and other sources (2 percent). Beneficiaries with annual incomes over $85,000/individual or $170,000/couple pay a higher, income-related Part B premium reflecting a larger share of total Part B spending, ranging from 35 percent to 85 percent.
- Part D is financed by general revenues (71 percent), beneficiary premiums (17 percent), and state payments for beneficiaries dually eligible for Medicare and Medicaid (12 percent). Higher-income enrollees pay a larger share of the cost of Part D coverage, as they do for Part B.
- The Medicare Advantage program (Part C) is not separately financed. Medicare Advantage plans, such as HMOs and PPOs, cover Part A, Part B, and (typically) Part D benefits. Beneficiaries enrolled in Medicare Advantage plans pay the Part B premium, and may pay an additional premium if required by their plan; about half of Medicare Advantage enrollees pay no additional premium.
Assessing Medicare’s Financial Condition
Medicare’s financial condition can be assessed in different ways, including comparing various measures of Medicare spending—overall or per capita—to other spending measures, such as Medicare spending as a share of the federal budget or as a share of GDP, as discussed above, and estimating the solvency of the Medicare Hospital Insurance (Part A) trust fund.
Solvency of the Medicare Hospital Insurance Trust Fund
The solvency of the Medicare Hospital Insurance trust fund, out of which Part A benefits are paid, is one way of measuring Medicare’s financial status, though because it only focuses on the status of Part A, it does not present a complete picture of total program spending. The solvency of Medicare in this context is measured by the level of assets in the Part A trust fund. In years when annual income to the trust fund exceeds benefits spending, the asset level increases, and when annual spending exceeds income, the asset level decreases. When spending exceeds income and the assets are fully depleted, Medicare will not have sufficient funds to pay all Part A benefits.
Each year, Medicare’s actuaries provide an estimate of the year when the asset level is projected to be fully depleted. In the 2019 Medicare Trustees report, the actuaries projected that the Part A trust fund will be depleted in 2026, the same year as their 2018 projection and three years earlier than their 2017 projection (Figure 8). The actuaries estimate that Medicare will be able to cover 89 percent of Part A costs from payroll tax revenue in 2026.
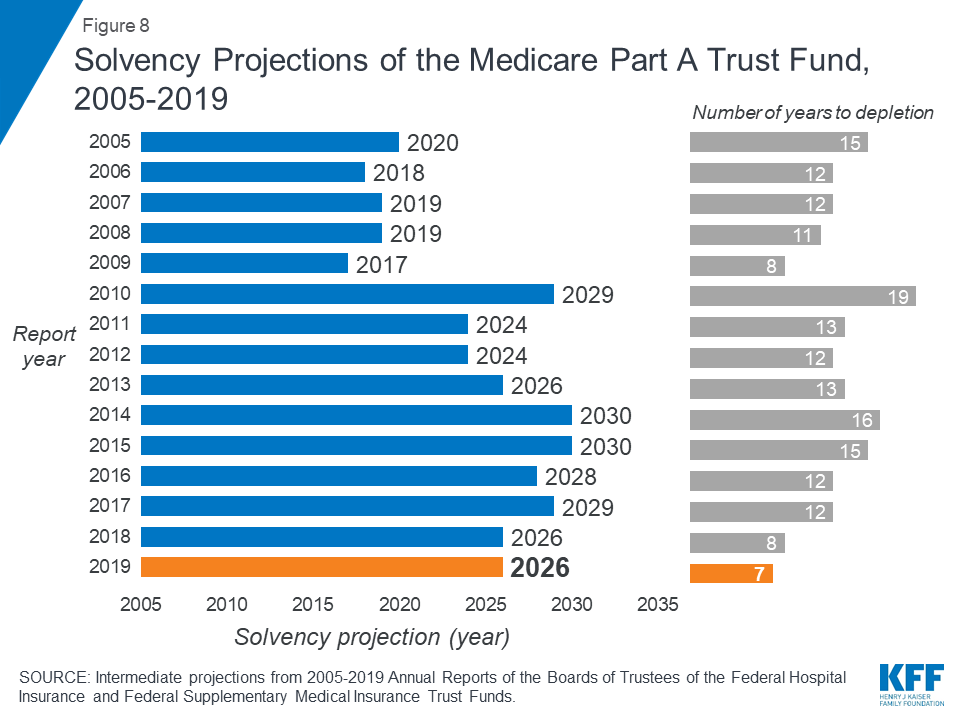
Figure 8: Figure 8: Solvency Projections of the Medicare Part A Trust Fund, 2005-2019
In the 2018 and 2019 Medicare Trustees reports, the actuaries attributed the earlier depletion date to several factors, including legislative changes enacted since the 2017 report that will reduce revenues to the Part A trust fund and increase Part A spending:
- lower-than-expected revenues from payroll taxes in 2017 and 2018 due to lowered wages and lower levels of projected GDP;
- lower revenue projections from taxation of Social Security benefits (which provided 8 percent of Part A revenues in 2018) as a result of the tax cut legislation enacted in December 2017;
- higher-than-expected spending for Part A benefits and higher projected provider payment updates;
- higher spending projections due repeal of the ACA’s individual mandate, which is expected to increase the number of people without health insurance, which will result in an increase in Medicare’s disproportionate share hospital (DSH) payments for uninsured patients; and
- higher spending projections due to repeal of the Independent Payment Advisory Board, which would have helped to control Medicare spending if the growth rate exceeded certain target levels.
In general, Part A trust fund solvency is also affected by the level of growth in the economy, which affects Medicare’s revenue from payroll tax contributions, by overall health care spending trends, and by demographic trends—of note, an increasing number of beneficiaries, especially between 2010 and 2030 when the baby boom generation reaches Medicare eligibility age, and a declining ratio of workers per beneficiary making payroll tax contributions.
Part B and Part D do not have financing challenges similar to Part A, because both are funded by beneficiary premiums and general revenues that are set annually to match expected outlays. Expected future increases in spending under Part B and Part D, however, will require increases in general revenue funding and higher premiums paid by beneficiaries.
The Future Outlook
Although Medicare spending is on a slower upward trajectory now than in past decades, total and per capita annual growth rates are trending higher than their historically low levels of the past few years. The aging of the population, growth in Medicare enrollment due to the baby boom generation reaching the age of eligibility, and increases in per capita health care costs are leading to growth in overall Medicare spending. At the same time, recent legislative changes, including repeal of the ACA’s individual mandate and repealing IPAB, have worsened the short-term outlook for the Medicare Part A trust fund and have led to projections of higher Medicare spending in the future.
A number of changes to Medicare have been proposed in the past to address the fiscal challenges posed by the aging of the population and rising health care costs. Lately, policymakers have been focused more narrowly on policy options to control Medicare prescription drug spending, rather than on broader proposals to reduce the growth in Medicare spending. And there has been little discussion of revenue options that could be considered to help finance care for Medicare’s growing and aging population, including raising the Medicare payroll tax or increasing other existing taxes. Meanwhile, Medicare has featured prominently in the 2020 presidential campaign, with proposals from some Democratic candidates to expand on it as part of a Medicare-for-all plan, and ideas from others to allow people to buy into it.
The prospects for proposals that would affect Medicare’s financial outlook are unknown, but they will require careful deliberation over the effects on not only the program’s finances but also its growing number of beneficiaries.