

Cartoon – Modern Diagnosis


https://www.hrdive.com/news/50-essentia-health-workers-fired-for-refusing-flu-vaccine/511593/

The American Hospital Association (AHA), along with the National Business Group on Health and the American Academy of Family Physicians, strongly supports vaccinations to prevent the spread of the flu. The AHA backs mandatory patient safety policies that require workers to get flu vaccinations or wear hygienic masks when coming in contact with patients during the flu season.
Statistics from the Centers for Disease Control (CDC) show that less than 45.6% of Americans got flu shots during the 2015 to 2016 flu season. According to the CDC, some people don’t think the flu vaccination is effective, while others don’t think they’ll come down with the flu or think the side effects will be worse than the disease. Other workers might be eligible for a medical or religious exemption.
Employees routinely come to work ill, spreading infections to coworkers. Some 80% of employees came to work sick last year based on findings from Staple Business Advantage’s cold and flu survey. The cost of the flu alone is $10.4 billion in medical expenses and, for employees, $16.3 billion in lost earnings each year.
Healthcare statistics would seem to support the argument for mandatory flu vaccinations. However, legal considerations come into play. States like New York allow employers to have blanket mandatory flu vaccination policies, but the Equal Employment Opportunity Commission (EEOC) is against mandatory policies. Employers will need to pay attention to local and state law before making any such policies of their own.
https://www.beckershospitalreview.com/finance/healthcare-bankruptcies-more-than-triple-in-2017.html

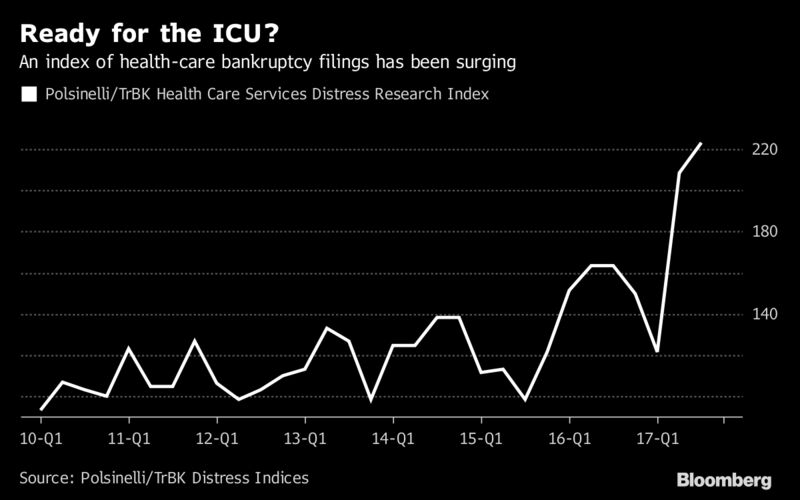
Regulatory changes, the rise of high-deductible health plans and advances in technology are a few of the factors that have taken a toll on healthcare companies’ finances, and these challenges may lead many hospitals and other medical companies to restructure their debt or file for bankruptcy in the coming year, according to Bloomberg.
Although hospitals are expected to face financial challenges in the year ahead, many healthcare companies are already struggling. According to data compiled by Bloomberg, healthcare bankruptcy filings have more than tripled in 2017. Healthcare bankruptcies are on the rise as filings across the broader economy have fallen since 2010, according to the report.
The challenges in the healthcare sector may hit rural hospitals the hardest due to the reduction in Disproportionate Share Hospital payments.
The ACA calls for annual ggregate reductions to DSH payments from fiscal year 2014 through fiscal year 2020. Subsequent legislation delayed the start of the reductions until fiscal year 2018, which began Oct. 1, and pushed the end date back to fiscal year 2025.
David Neier, a partner at Winston & Strawn, told Bloomberg the cuts to DSH payments may “single-handedly throw hospitals into immediate financial distress.”
https://www.healthcaredive.com/news/5-payer-trends-to-watch-in-2018/510136/

Expect insurers to accelerate programs and policies that cut costs and to push for value-based contracting as consumers demand more transparency in healthcare pricing.
The past year has been an eventful one for payers, from the tumultuous Affordable Care Act (ACA) exchange markets to potential mega-mergers. Insurers continue, however, to keep their efforts focused on lowering healthcare costs where possible, with the intention that quality of care is not sacrificed.
Those payer efforts are working. Healthcare spending growth dropped to the lowest level in nearly two years, and hospital spending growth lags behind all other healthcare sectors. Hospital spending increased by only 0.8% year-over-year in June, which was the slowest growth rate since January 1989.
Looking ahead to next year, you can expect payers to implement more cost-saving measures and push for value-based contracting. Here’s a look at five payer trends to watch for in 2018, and some tips for preparing to deal with them.
Insurance companies have created policies, designed plans and narrowed provider networks to bring down healthcare costs. They’ve shown success. Expect payers to accelerate those programs and policies and search for more cost-saving levers in 2018.
The most public example of health insurers cutting costs over the past year was Anthem’s policies to not pay for unnecessary emergency department visits or imaging services at hospitals. Anthem’s policies looked to nudge patients to less costly outpatient facilities, including urgent care centers and freestanding imaging centers.
Michael Abrams, co-founder and managing partner at Numerof & Associates, told Healthcare Dive that Anthem’s decision to not reimburse hospital outpatient MRI and CT scans without precertification is “an important message to the provider community.” Anthem’s policy is in response to “ballooning growth in outpatient imaging — both in volume and in unit cost.”
For hospitals searching for ways to improve their bottom lines, many health systems viewed imaging as a way to make up for lost reimbursements and less utilization elsewhere. However, Abrams said the payer’s message was that medical necessity is the stronger consideration and that unit pricing needs to reflect broader market pricing.
“Many provider institutions had turned this under-regulated service line into a profit center,” Abrams said. “Anthem’s action made it clear that such actions would not be acceptable.”
Aneesh Krishna, partner in McKinsey & Company’s Silicon Valley office, told Healthcare Dive payers will likely roll out similar policies for imaging, lab, diagnostic testing and low-risk surgeries. “We see a trend toward rationalizing the levels of payments across various sites of service,” he said. “Imaging-related initiatives are the first steps in that direction.”
In addition to pushing for more services outside of hospitals, Fred Bentley, vice president at Avalere, told Healthcare Dive that he expects payers to focus on readmissions. Providers will need to manage patients post-discharge and keep them healthy in their homes rather than in hospitals.
Though not as high profile as Anthem’s policies, payers have been narrowing provider networks to bring down costs. This has been especially true in ACA exchange plans and Medicare Advantage (MA). In fact, a recent Kaiser Family Foundation study found that 35% of MA enrollees were in narrow-network plans in 2015, while only 22% were in broad-network plans.
Bentley said narrow provider networks haven’t had a huge impact yet. However, the “significant value” associated with narrow and tiered provider networks will ultimately cause more payers to expand narrow provider networks in the employer-based market.
Payers and the CMS have pushed for more value-based care and payments, but it’s been slow going.
“Payers see potential to contain costs and improve quality in such contracts. However, the pace of adoption is tempered by provider resistance to taking on risk and by payer reluctance to push providers to do so before they are operationally prepared to be successful,” Abrams said, referencing findings in Numerof & Associates’ 2017 State of Population Health Survey.
Krishna believes payers may move more into bundled payments, bonus payments and capitation as it pushes providers to care for the whole patient rather than receiving payments for individual services.
Krishna said the shift toward cost-effective sites of service will require payers to align provider incentives to get the best outcomes. It also gives providers greater flexibility to choose the right care for their patients. This will additionally mean payers will need to share the right data to providers. “Increasing levels of data availability and easier integration between payer and provider systems will make the transition easier and scalable,” Krishna said.
“Increasing levels of data availability and easier integration between payer and provider systems will make the transition easier and scalable.”
Partner, McKinsey& Company’s Silicon Valley office
Steve Wiggins, founder and chairman of Remedy Partners, told Healthcare Dive payers will continue to leverage payment models that encourage patients to find care in the most cost-effective locations and use those service efficiently. This will lead to more bundled payments that trigger at diagnosis rather than only at inpatient admission, which is already happening in Medicare, he said.
“Orthopedics, all post-acute services, oncology care, most elective surgeries, all episodes that patients control and a wide range of chronic conditions lend themselves to bundled payments that start at diagnosis,” Wiggins said.
Payers have been pushing more patients to outpatient facilities as a way to cut costs.
“Care delivery is moving out of the acute care setting and into the community. Such a trend is responsive to consumer demands for fast, convenient access, and it offers the potential for higher volume and lower costs in specialized clinic settings. An increasing portion of hospital system revenues comes from outpatient services, and that ratio will continue to define the progress of systems in a market-driven, value-based healthcare environment,” Abrams said.
Wiggins said innovations will also play a larger role in keeping down costs. He said shifting away from traditional delivery models and fee for service to bundled payment models will lead to more remote monitoring and telemedicine.
“Bundled payments hold great potential to become the driver of innovations that leverage the explosion of wearables, remote monitoring and greater patient engagement,” Wiggins said.
A recent KLAS Research and the College of Healthcare Information Management Executives survey found that reimbursement remains the main barrier to telehealth expansion, but Krishna said virtual care will play a bigger role in the coming year, including for initial consultations and follow-up visits that don’t require an onsite doctor visit.
“Overall, these trends will likely shift significant patient volume from higher-intensity settings to lower-intensity settings while maintaining — or in some cases even improving — quality of care or patient experience,” Krishna said.
Abrams said the cost consequences of virtual care are not fully known, but consumers want that access to providers. More virtual care could include nurses offering guidance on day-to-day health issues and physicians monitoring and visiting virtually with chronically ill patients at home.
“As larger and better capitalized healthcare systems move toward risk-based contracting, we expect to see growth in the use of such services,” Abrams said.
Consumers are demanding more healthcare cost data on procedures. A recent HealthFirst Financial Patient Survey found that 77% of healthcare consumers say it’s important or very important to know costs before treatment.
Higher out-of-pocket costs and high-deductible health plans are the biggest reasons for this greater interest in transparency. A recent Kaiser Family Foundation study found that out-of-pocket spending is outpacing wage growth.
Deductibles went from accounting for less than 25% of cost-sharing payments in 2005 to almost half in 2015. The average payments toward deductibles rose 229% from $117 to $386, and the average payments toward coinsurance increased 89% from $134 to $253 in that period. Overall, patient-cost sharing increased by 66% from an average of $469 in 2005 to $778 in 2015.
With members taking on more healthcare utilization costs, payers and employers view cost and quality data as a key to reducing healthcare costs. However, the information is not always easy to find for consumers.
Bentley said consumers are frustrated and confused by their bills. Health systems understand they need to provide pricing and outcomes information and payers like Anthem have created comparison shopping tools for consumers, he said.
That is just the start of a greater move toward consumerism as patients take on more out-of-pocket costs.
“In the new market-based healthcare landscape that is evolving, buyers will look for transparency, accountability for cost and quality across the continuum and consumer choice based on real competition,” Abrams said.
Payers have pushed more cost controls that are affecting provider bottom lines, but there have been some moments this year when payers and providers have seen eye-to-eye. Providers and payers have increasingly worked collaboratively.
Payer-provider partnerships vary in type, size, location and model. There are 50/50 joint ventures with co-branding, and less intensive partnerships like pay for performance, accountable care organizations, patient-centered medical homes and bundled payments. Oliver Wyman found the partnerships can be broken down depending on providers’ appetite for risk.
They involve national payers like Aetna, Cigna and various Blues and new players in the payer space like Oscar Health and Bright Health.
Bentley said healthcare is becoming a “messy hybrid world” in which payers get more involved in the provider side and vice-versa. Increasingly, providers and payers are more concerned about managing patients’ health rather than viewing them as volume. Bentley said to expect more experiments and partnerships as the lines in healthcare continue to get blurred.
Now, the important question for hospitals and providers is: What should we do to get ready?
Here are five suggestions from experts:
https://www.healthcaredive.com/news/skyrocketing-out-of-pocket-spending-outpaces-wage-growth/506734/

KFF researchers reviewed health benefit claims from the Truven MarketScan Commercial Claims and Encounters Database to calculate the average that members pay for deductibles, copayments and coinsurance. What they found should not surprise anyone in healthcare or with employer-based health insurance — deductibles and overall out-of-pocket health costs are rising.
The organization found patient cost-sharing “rose substantially faster than payments for care by health plans as insurance coverage became a little less generous” between 2005 and 2015.
Deductibles went from accounting for less than 25% of cost-sharing payments in 2005 to almost half in 2015. The average payments toward deductibles rose 229% from $117 to $386 and the average payments toward coinsurance increased 89% from $134 to $253 in that period.
On the plus side, copayments fell by 36% from $218 to $139 as payers and employers have moved more costs to healthcare utilization.
Overall, patient-cost sharing increased by 66% from an average of $469 in 2005 to $778 in 2015. Average payments by health plans also increased 56% from $2,932 to $4,563.
While out-of-pocket health costs have skyrocketed, wages in the same period increased by 31%.
The KFF study comes on the heels of a JPMorgan Chase Institute report that found Americans are struggling with out-of-pocket costs. In many cases, JPMorgan Chase Institute found that people are delaying healthcare payments until they get “liquid assets.” In fact, healthcare payments spike in March and April when Americans get tax refunds.
In another recent study on the topic, HealthFirst Financial Patient Survey said more than 40% of respondents are “very concerned” or “concerned” about whether they could pay out-of-medical bills over the next two years. More than half said they are worried that they might not be able to afford a $1,000 bill, 35% were concerned about a $500 bill and 16% said they’re worried about paying a bill less than $250.
Those amounts are usually well below health plan deductibles. The Kaiser Family Foundation/Health Research & Educational Trust 2017 Employer Health Benefits Survey recently found that health plan deductibles often exceed $3,000.
That could be a problem not just for those individuals. Providers and hospitals are already struggling with sagging reimbursements and payer cost-saving measures and policies. More bad debt would only make matters worse.
Increases in cost-sharing payments continue to outpace wage growth

Rising cost-sharing for people with health insurance has drawn a good deal of public attention in recent years. For example, the average deductible for people with employer-provided health coverage rose from $303 to $1,505 between 2006 and 2017.
While we can get a sense of employees’ potential exposure to out-of-pocket costs by looking at trends in deductibles, many employees will never reach their deductibles and other employees may have costs that far exceed their deductibles. In addition to deductible payments, some employees also have copayments (set dollar amounts for a given service) or coinsurance payments (a percentage of the allowed amount for the service). To look at what workers and their families actually spend out-of-pocket for services covered by their employer-sponsored plan, we analyzed a sample of health benefit claims from the Truven MarketScan Commercial Claims and Encounters Database to calculate the average amounts paid toward deductibles, copayments and coinsurance.
We find that, between 2005 and 2015, average payments for deductibles and coinsurance rose considerably faster than the overall cost for covered benefits, while the average payments for copayments fell. As can be seen in the chart below, over this time period, patient cost-sharing rose substantially faster than payments for care by health plans as insurance coverage became a little less generous.
The MarketScan claims database contains information about health benefit claims and encounters for several million individuals each year provided by large employers. The advantage of using claims information to look at out-of-pocket spending is that we can look beyond the plan provisions and focus on actual payment liabilities incurred by enrollees. A limitation of these data is that they reflect cost sharing incurred under the benefit plan and do not include balance-billing payments that beneficiaries may make to health care providers for out-of-network services or out-of-pocket payments for non-covered services. We use a sample of between 933,000 and 14.8 million enrollees per year to analyze the change from 2005 to 2015 in average health costs for covered benefits overall, the average amount paid by health benefit plans, and the average amounts attributable to deductibles, copayments, and coinsurance. The analysis of costs for each year was limited to enrollees with more than six months of coverage during that year.
From 2005 to 2015, the average payments by enrollees towards deductibles rose 229% from $117 to $386, and the average payments towards coinsurance rose 89%, from $134 to $253, while average payments for copays fell by 36%, from $218 to $139. Overall, patient cost-sharing rose by 66%, from an average of $469 in 2005 to $778 in 2015. During that period, average payments by health plans rose 56%, from $2,932 to $4,563. This reflects a modest decline in the average generosity of insurance – large employer plans covered 86.2% of covered medical expenses on average in 2005, decreasing to 85.4% in 2015. Wages, meanwhile, rose by 31% from 2005 to 2015.
Individuals in the top 15 percent of health spenders (who together account for 75.1% of total health benefit costs for the sample), had substantially higher out-of-pocket costs, averaging $2,766 in 2015, including $1,302 in coinsurance payments, $1,006 in deductible spending, and $458 in copays. The growth in cost-sharing for this group was similar to the sample overall. As of 2015, 6.5% of all enrollees had deductible payments that exceeded $1,500 and 8.4% had overall cost-sharing payments that exceeded $2,500.
The relatively high growth in payments toward deductibles is evident in the changes over time in the distribution of cost sharing payments: deductibles accounted for 25% of cost sharing payments in 2005, rising to 50% in 2015. Conversely, copayments accounted for nearly half (46%) of cost sharing payments in 2005, falling to 18% in 2015. The increase in coinsurance over the period from 29% of total employee cost-sharing in 2005 to 33% in 2015 may reflect the strong growth over the period in plans that qualify a person to establish a health savings account; these plans are more likely to have coinsurance than copayments for physician services. Patients are more sensitive to the actual price of health care with deductibles and coinsurance than they are with copays, which are flat dollar amounts. The other difference between a copay and a deductible is that copays may add up over time, while a deductible may need to be met at once, causing affordability challenges.
While average payments towards deductibles are still relatively low in the context of total household budgets, they have increased quite rapidly. Deductibles are the most visible element of an insurance plan to patients, which may help explain why consumers continue to show concern about their out-of-pocket costs for care. Although health insurance coverage continues to pay a large share of the cost of covered benefits, patients in large employer plans are paying a greater share of their medical expenses out-of-pocket. And, while health care spending has been growing at fairly modest rates in recent years, the growth in out-of-pocket costs comes at a time when wages have been largely stagnant.

A recently unsealed lawsuit filed by attorneys under the qui tam, or whistle-blower, provision of the False Claims Act accuses Indiana hospitals of overcharging patients for their electronic medical records.
Here are eight things to know about the lawsuit.
1. After experiencing difficulty obtaining medical records from four Indiana hospitals in their work on personal injury and medical malpractice cases, attorneys from Anderson, Agostino & Keller sued the hospitals in September 2016. They alleged the hospitals falsely certified they were meaningful users of EHR technology.
2. Under meaningful use stage 1, hospitals could show compliance and receive incentive payments by filing attestation documents reporting compliance with core criteria requirements. The lawsuit against the Indiana hospitals focuses on core measure No. 11, which aimed to provide patients with electronic medical records within three business days of receiving a request from the patient or their agent.
3. To receive the incentive payments, hospitals had to show the number of medical record requests they received annually and if the records were supplied to those requesting them within three business days. Hospitals that failed to meet at least 50 percent of their requests within the time frame would not be eligible to receive incentive payments.
4. Based on their experience requesting records from the hospitals and after examining public disclosures, the lawyers alleged the hospital defendants falsely certified compliance with core measure No. 11.
5. The lawyers also claim the hospitals allowed CIOX Health, a company that provided medical records for the hospitals, to illegally profit from the release of the electronic medical records.
“CIOX routinely and repeatedly engaged in a practice, policy, and/or scheme to illegally and fraudulently over-bill patients for the provision of medical records,” the complaint states.
6. The lawyers added organizations operating an additional 65 hospitals to the lawsuit after examining disclosures and identifying a statistical trend that they argue indicates the same type of fraudulent reporting of core measure No. 11.
7. “In sum, these hospitals have been paid $324,386,169.32 in public funding from the citizens of the United States in return for the promise that patients would be provided with fast, cheap, easy access to their electronic health records, and these hospitals have failed to keep that promise,” the complaint states.
“A failure to properly track and report core measure 11 means that the defendant hospitals did not achieve ‘meaningful use’ as defined by the legislation and its ensuing rules. This means that they were not eligible to receive any funding under this program, and have sought and received the grant funding at issue in a fraudulent manner that constitute false claims for public funding.”
8. The Department of Justice declined to intervene in the lawsuit.
A growing number of health-care companies may face near-death experiences of their own.
“Smaller hospitals have already been struggling for years,” said Kristin Going, a partner in the New York office of Drinker, Biddle & Reath LLP. Both lawyers declined to discuss specific companies. Since 2010, a growing number of patients have enrolled in high-deductible health plans that force them to shoulder more of costs when they get treatment, according to the U.S. Centers for Disease Control and Prevention. That has translated into more bad debt from customers for hospitals and other providers.
Some publicly traded hospital companies that were already under pressure from high debt loads have been further buffeted by this year’s hurricanes. Community Health Systems Inc., with $1.9 billion in debt maturing in 2019, has suffered doctor revolts over crumbling, cash-strapped facilities, as well as losses linked to the storms in Texas and Florida earlier this year. A representative for Community Health didn’t return a call seeking comment.
Jorian Rose, partner in the New York office of Baker & Hostetler LLP, said many health-care restructurings are already going on under the radar right now. Rose, Going and Neier are members of the Turnaround Management Association, a group for bankruptcy and restructuring professionals.
The Polsinelli Health Care Services Distress Research index, which tracks bankruptcy filings for companies with more than $1 million in assets, shows that activity has surged 123 percent since the fourth quarter of 2010. By comparison, the law firm said, the general index that tracks Chapter 11 filings in the U.S. is down nearly 58 percent from 2010. The Affordable Care Act, which Republican lawmakers have been looking to repeal, replace, defund, or otherwise change, was cited as one of the systemic changes rocking the sector.
Since 1997, health-care cases have made up only 5.25 percent of all U.S. bankruptcy filings, according to Bloomberg data. Year to date, they already comprise 7.25 percent of all filings. Emergency-room operator Adeptus Health, cancer-care provider 21st Century Oncology, and cancer treatment specialist California Proton Treatment are the largest filings. Those statistics exclude pharmaceutical company Concordia, which is restructuring in Canada, and Preferred Care Inc., one of the U.S.’s largest nursing home groups, operating 108 assisted living facilities.
Problems for the sector aren’t limited to U.S. companies. Israeli drugmaker Teva Pharmaceutical Industries Ltd., saddled with debt that’s more than double its market value, is putting together a “detailed restructuring plan” after the company has slashed its profit forecasts, cut its dividend, signaled it may sell new shares, and reduced its goal for paying down debt this year. It announced a management shakeup on Monday.
Distress among health-care companies can spread to other parts of the economy. Quality Care Properties Inc., for example, is a real estate investment trust with a struggling tenant, HCR Manorcare Inc. Moody’s Investors Service said in an October report that if HCR Manorcare files for bankruptcy, Quality Care could also need to amend the terms of its own debt. Representatives for HCR Manorcare and Quality Care didn’t return calls seeking comment.
