Roughly 27.5 million people, or 8.5% of the U.S. population, had no health insurance at some point in 2018, according to new figures from the Census Bureau.
Why it matters: Last year’s uninsured rate increased from 7.9% in 2017 — the first time the uninsured rate has gone up since the Affordable Care Act has been in effect.
Between the lines: The uninsured population does not include the “underinsured,” or people who have medical coverage but face prohibitively high deductibles and out-of-pocket costs.
The figure also does not include people who have short-term plans, association plans and religious-based sharing ministries — policies the Trump administration has promoted, but that have holes in coverage that could leave people on the hook for high costs.
The intrigue: The type of coverage that witnessed the largest decline in 2018 was Medicaid, which fell 0.7 percentage points.
4 states where the uninsured rate had a statistically significant increase were Alabama, Idaho, Tennessee and Texas, all of which have not fully expanded Medicaid under the ACA.
The bottom line: The uninsured rate is still markedly lower before the ACA became law, but it’s an odd paradox to see more people lose health coverage even though the economy created more jobs.
The battle over health care that has dominated the Democratic race for the White House took center stage in Houston, where for the first time the top three candidates tangled over whether the nation is ready for sweeping reforms.
Former Vice President Joe Biden went back and forth at the opening of Thursday’s debate with the two progressives who are his leading challengers atop the polls, Sens. Bernie Sanders (I-Vt.) and Elizabeth Warren (D-Mass.).
Arguing that the “Medicare for All” proposal championed by Sanders would cost people their insurance, Biden called out the Vermont senator as a socialist and said his proposals would be too costly.
At one point in the debate, Biden said of Warren and Sanders that “nobody’s yet said how much it’s gonna cost for the taxpayer.”
He also pointed to the taxes that would have to increase for middle class people to pay for Medicare for All.
“There will be deductible in your paycheck,” Biden said, referencing the chunk that taxes would take out of people’s pay.
Sanders said most Americans were getting a raw deal in terms of their present health care costs compared with countries that have systems more similar to his Medicare for All approach.
“Let us be clear, Joe, in the United States of America we are spending twice as much per capita on health care as the Canadians or any other major country on earth,” Sanders said.
“This is America,” Biden retorted.
“Yeah, but Americans don’t want to pay twice as much as other countries and they guarantee health care to all people,” Sanders responded.
Health care is a top issue in the race according to polls, and Democrats believe they can win the White House if the general election against President Trump is focused on the issue.
But it is also the issue that divides the Democratic candidates the most, with Biden and other centrists proposing more modest steps, such as reforms to ObamaCare.
The battle over health care is intertwined with the debate Democrats are having over which of their candidates is best positioned to defeat President Trump, with some in the party worried that Warren and Sanders are too liberal to win a general election. Others say their bold ideas are what is needed for the party to defeat Trump.
Biden argues Medicare for All means scrapping former President Obama’s signature achievement, the Affordable Care Act, instead of building on it.
While Sanders touted that everyone would have coverage under his plan and that it would be more generous, with no premiums or deductibles, Biden countered with the cost of the proposal, which estimates put at around $32 trillion over 10 years.
In the debate’s first hour, Biden was already hitting Sanders and Warren over the cost of the plan.
“The senator says she’s for Bernie,” Biden said of Warren’s support for Sanders’s Medicare for All plan. “Well I’m for Barack.”
Warren, pressed by host George Stephanopolous on whether middle class taxes would rise from Medicare for All, did not directly answer, pivoting to argue that overall costs for the middle class would go down once the abolition of premiums and deductibles is taken into account.
“What families have to deal with is cost, total cost,” Warren said, adding: “The richest individuals and the biggest corporations are going to pay more, and middle class families are going to pay less.”
Other candidates were also in the middle of the Medicare for All exchanges.
Sen. Kamala Harris (D-Calif.), who drew flak in the early months of the campaign for seeming to change her position on health care several times, touted the plan she eventually developed, to allow some private insurance to remain under Medicare for All by allowing private companies to administer some plans in a tightly regulated way.
“I want to give credit to Bernie. Take credit, Bernie,” Harris said, while adding, “I wanted to make the plan better, which I did.”
At another point in the debate, Biden dismissed the idea that employers would raise workers’ wages if employers no longer had to provide health insurance under a Medicare for All system.
“My friend from Vermont thinks the employer’s going to give you back what you’ve negotiated as a union all these years … they’re going to give back that money to the employee?” Biden said.
“As a matter of fact they will,” Sanders interjected.
“Let me tell you something, for a Socialist you’ve got a lot more confidence in corporate America than I do,” Biden responded.
While all of the Democrats advocate large additional government spending to expand health insurance coverage, the debates over whether private insurance should remain as an option has proven to be a particularly fierce source of debate.
Republicans have sensed an opening on that point as well, eagerly bashing Democrats for wanting to take away employer-sponsored coverage that millions of Americans have. Sanders and Warren counter that Medicare for All coverage would be better insurance, with no deductibles at all, so people would not miss it.
“I’ve actually never met anybody who likes their health insurance company,” Warren said, noting people like their doctors, which they would be able to keep.
Sen. Amy Klobuchar (D-Minn.), who has staked out a more moderate ground, tore into Sanders, though, over his plan’s elimination of private insurance.
“While Bernie wrote the bill, I read the bill, and on page eight of the bill it says that we will no longer have private insurance as we know it,” Klobuchar said.
“I don’t think that’s a bold idea, I think it’s a bad idea,” she added.
Amid the division, Harris tried to strike a unifying note.
“I think this discussion is giving the American people a headache,” she said. “What they want to know is that they’re going to have health care and cost will not be a barrier to getting it.”
States use the Commonwealth Fund’s 2019 Scorecard on State Health System Performance to identify places where their health care policies are on track and areas that need improvement. Using the Scorecard, states can compare their improvement to others, and see how they stack up. In the most recent edition, released in June, Rhode Island improved on the most health system performance indicators tracked over time, followed by Missouri, Washington, West Virginia, and Arkansas.
Rhode Island particularly made strides in the areas of coverage and behavioral health. The state uninsured rate among adults dropped from 17 percent in 2013 to 7 percent in 2015 and 6 percent in 2017. In addition, the percentage of adults with any mental illness reporting an unmet need dropped from 27 percent in 2010–11 to 18 percent in 2014–16. The state also saw significant reductions in the percentage of children with unmet mental health needs.
These improvements did not happen by chance. What actions did policymakers take to drive progress and what work lies ahead?
Making Progress Through Clear Priorities and State Leadership
In 2014, Governor Gina Raimondo came into office fully committed to the Affordable Care Act, including Rhode Island’s state-based health insurance marketplace and expanded Medicaid eligibility.
Another early administration priority was making sure behavioral health care was as available and affordable as medical care. The opioid epidemic was hitting Rhode Island hard, making access to treatment for mental health and substance use disorder a top concern.
Coverage expansion. The decision to create a state-based marketplace, HealthSource Rhode Island (HSRI), was instrumental in helping the state make gains in coverage and affordability. The state has its own funding for marketing and navigators who help people understand and choose health plans. This has helped shield residents from federal outreach cuts. The state’s commitment also helped when the Trump administration decided to end marketplace cost-sharing-reduction subsidies. The state’s Office of the Health Insurance Commissioner (OHIC) worked with the state marketplace HSRI to protect consumers by building price increases to cover the loss of subsidies into silver-level health plans and keeping premiums lower in the other plans. HSRI plans offered among the lowest state-based marketplace premiums in the country. During last year’s open-enrollment period, HSRI saw a 5 percent increase in new and overall customers.
Access to behavioral health. In 2015, Governor Raimondo issued an executive order to establish the Overdose Prevention and Intervention Task Force, which has guided state reforms. The opioid crisis also has led to more open conversations about mental health and to improved relationships between first responders and communities. To facilitate these relationships, Rhode Island now requires police officers receive training to recognize behavioral health issues and help connect individuals with the care they need.
Rhode Island experienced a decline in overall overdose deaths, from 336 in 2016 to 314 in 2018. Community programs and pharmacies have worked hard to get naloxone, used to counter the effects of opioid overdose, into the hands of people who need it. Rhode Island was also the first state to offer medication-assisted opioid treatment in prison. Community health workers follow up on inmates after release to ensure treatment is continued. Fatal overdoses declined by 60 percent among people leaving detention from 2016 to 2017, and continued to drop in 2018.
OHIC also has prioritized integrating behavioral health into the primary care setting as a cost-effective way of increasing access to such services. Studies have shown that integrated care improves depression and anxiety outcomes, along with quality of life, while reducing the total cost of care.
Additionally, OHIC has been working on encouraging parity between medical and behavioral health in the insurance market by reviewing insurers’ coverage documents. It is focusing on limiting mental health benefit exclusions and ensuring the states’ major carriers are in compliance with the laws related to coverage for mental health and substance use disorder treatment. As a result, the four major insurers have agreed to discontinue prior authorization requirements for certain medication-assisted treatments.
Maintaining Momentum
In 2018 an HSRI/OHIC workgroup was formed to develop policy options to mitigate the potential impact of federal changes on health coverage costs, consumer choice, and access. The group recommended pursuing a Section 1332 waiver to establish a reinsurance program to reduce premium increases in the individual market; implementing a state-level requirement that individuals have health insurance to offset the impact of the federal health insurance mandate penalty repeal; and establishing OHIC’s regulatory authority over short-term limited duration plans. All three recommendations were signed into law on July 5.
In addition, recent state legislation has expanded OHIC’s authority related to establishing behavioral health parity, such as a law giving it authority over health plans and third-party organizations that conduct benefit reviews.
Addressing population health challenges demands a concerted effort. Rhode Island is fortunate to have a culture of collaboration among health care leaders, coupled with strong political commitment to health system improvement.
New numbers from the U.S. Census Bureau show an uptick in Americans who are uninsured but modest progress on poverty and income — handing Democrats and Republicans data for talking points.
The rise in the uninsured spanned demographic groups. Uninsured rates rose between 2017 and 2018 for whites, African-Americans, Hispanic Americans, Asian Americans, native-born Americans, foreign-born Americans, people with disabilities, people without high school degrees, and those under 18.
The 2017 and 2018 figures are not directly comparable with previous years due to changes in how the data is calculated. But a different data set showed that the small rises in the uninsured rate for 2017 and 2018 marked a change for a number that had improved every year since its peak in 2010, when the Affordable Care Act was passed. The law created a national marketplace for individual insurance and allowed states to expand Medicaid to more people.
Democrats pounced on the data release, with House Speaker Nancy Pelosi, D-Calif., blaming “President Trump’s cruel health care sabotage,” including his efforts to pare back the Affordable Care Act through regulations and in court.
But the Trump administration could point to modest gains in other statistics reported by the Census Bureau.
“Americans of all backgrounds are experiencing economic success in the Trump economy,” the White House said in a statement that cited media coverage of the new numbers on income and poverty.
The U.S. poverty rate fell for the fourth consecutive year, from 12.3% in 2017 to 11.8% in 2018. The national poverty rate is currently lower than it has been in any year since 2000, as this chart indicates.
Meanwhile, median household income rose for the fourth consecutive year after adjusting for inflation. It was a small rise, however, from $62,626 in 2017 to $63,179 in 2018, or an increase of less than 1%. And the pace of growth has slowed somewhat since the middle of this decade.
A leading measure of income inequality known as the GINI coefficient dipped slightly between 2017 and 2018. But its decades-long rise toward greater inequality was not greatly slowed.
Under this measurement, a score of 0.0 represents total income equality, while a score of 1.0 represents total inequality.
The overall statistics for poverty and income also mask significant differences by race and ethnicity.
In 2018, for instance, the poverty rate for whites was 8.1%. But it was much higher for African-Americans (20.8%) and Hispanic-Americans (17.6%) and modestly higher for Asian-Americans (10.1%).
The poverty rate fell slightly in 2018 for whites, African-Americans and Hispanic-Americans, while rising slightly for Asian-Americans.
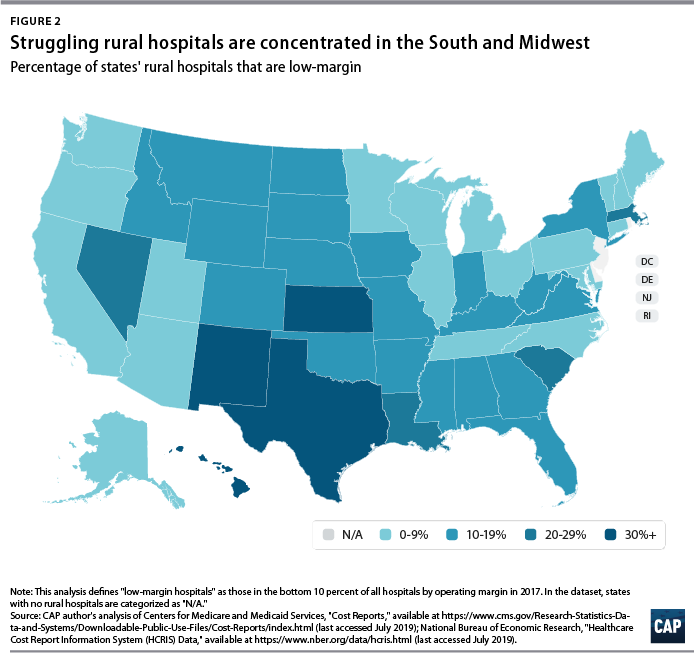
The number of rural hospital closures in the United States has increased over the past decade.1 Since 2010, 113 rural hospitals,2 predominantly in Southern states, have closed. This is a concerning trend, since hospital closures reduce rural communities’ access to inpatient services and emergency care.3 In addition, hospitals that are at risk financially are more likely to serve rural communities with higher proportions of vulnerable populations.4
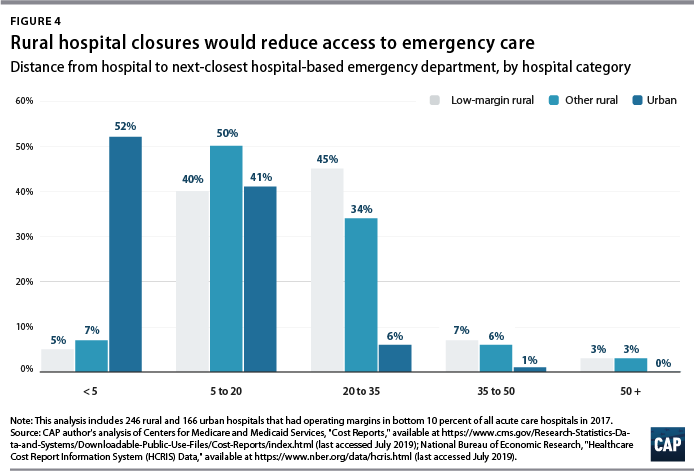
Understanding the financial pressures facing rural hospitals is imperative to ensuring that America’s 60 million rural residents have access to emergency care.5 Rural hospitals are generally less profitable than urban ones, and those with the lowest operating margins maintain fewer beds and have lower occupancy rates. Low-margin rural hospitals are also more likely to be in states that have not expanded Medicaid under the Affordable Care Act (ACA). According to new analysis by the Center for American Progress, future hospital closures would reduce rural Americans’ proximity to emergency treatment. Among low-margin, rural hospitals—those most likely to close—the majority of those with emergency departments are at least 20 miles away from the next-closest emergency department.
This report first discusses the role that hospitals and emergency care play in rural health care as well as trends in hospital closures. It then uses federal data to examine differences in the financial viability of rural and urban hospitals and the availability of hospital-based emergency care in rural areas. The final section of this report offers policy recommendations to improve health care access and emergency care for rural residents.
Rural hospitals have been closing at an unprecedented rate
From 2013 to 2017, rural hospitals closed at a rate nearly double that of the previous five years.6 (See Figure 1) According to the Government Accountability Office (GAO), recent rural hospital closures have disproportionately occurred among for-profit and Southern hospitals. Southern states accounted for 77 percent of rural hospital closures over that time period but only 38 percent of all rural hospitals in 20137
Hospital closures may deepen existing disparities in access to emergency care. Closures are more likely to affect communities that are rural, low income, and home to more racial/ethnic minority residents.8 Although about half of acute care hospitals are located in rural communities and the other half are located in urban areas,9 rural residents live 10.5 miles from the nearest acute care hospital on average, compared with 4.4 miles for those in urban areas.10 According to a poll by the Pew Research Center, about one-quarter (23 percent) of rural residents said that “access to good doctors and hospitals” is a problem in their community, while only 18 percent of urban residents and 9 percent of suburban residents said it was a problem.11
A variety of factors influence hospitals’ sustainability. Thanks to medical and technological advances, conditions that once required hospitalization can now be treated in an ambulatory care center or a physician’s office. University of Pennsylvania professor and CAP nonresident senior fellow Ezekiel Emanuel has argued that one reason hospitals are closing is that “more complex care can safely and effectively be provided elsewhere, and that’s good news.”12 As a whole, the hospital industry remains highly profitable, and hospital margins are at their highest in decades.13
Evidence on the relationship between hospital closures and health outcomes is mixed. A 2015 study of nearly 200 hospital closures in Health Affairs found no significant changes in hospitalization rates or mortality in the affected communities, whether rural or urban.14 More recent studies have found an association between rural hospital closures and increased mortality. Harvard researcher Caitlin Carroll showed that rural hospital closures led to an overall increase in mortality rates for time-sensitive health conditions,15 and Kritee Gujral and Anirban Basu of the University of Washington found that rural hospital closures in California were followed by increases in mortality for inpatient stays.16
In rural areas, hospitals face additional challenges to their viability, including lower patient volumes; higher rates of uncompensated care; and physician shortages.17 In addition, rural patients tend to be older and lower income.18 Rural hospitals tend to be smaller, serve a higher share of Medicare patients, and have lower occupancy rates than urban hospitals.19 Rural hospitals commonly offer obstetrics, imaging and diagnostic services, emergency departments, as well as hospice and home care,20 but patients needing more complicated treatment are often referred to tertiary or specialized hospitals. In fact, rural patients are more likely to be transferred to another hospital than patients at urban hospitals.21
Most urban hospitals are reimbursed under the prospective payment systems (PPS) for Parts A and B of Medicare. Through both the inpatient and outpatient PPS, the Centers for Medicare and Medicaid Services (CMS) reimburse hospitals at a predetermined amount based on diagnoses, with adjustments—including those for local input costs and patient characteristics.22However, rural hospitals often face higher costs due to lower occupancy rates and provide care to a higher percentage of patients covered by Medicare, Medicaid, and the Children’s Health Insurance Program (CHIP). Such hospitals may be eligible to receive higher payments from Medicare if they qualify as a Sole Community Hospital (SCH) or Medicare-Dependent Hospital (MDH).23
Another form of financial relief for rural hospitals is obtaining designation as a Critical Access Hospital (CAH), which Medicare reimburses based on cost rather than on the PPS.24 To qualify as a CAH, a hospital must provide 24/7 emergency services; maintain no more than 25 beds; and serve a rural area that is 35 miles from another hospital.25 Medicare reimburses CAHs at 101 percent of reasonable costs, rather than through the inpatient and outpatient PPS structures.26 As of 2018, there were 1,380 CAHs nationwide,27 accounting for about two-thirds of all rural hospitals.28
Even with cost-based reimbursement, however, some CAHs are unable to sustain the costs required to maintain inpatient beds.29 The 25-bed limit for CAHs prevent participating hospitals from eliminating inpatient services and restrict their ability to expand in response to fluctuations in community populations or care volumes. Other challenges facing rural hospitals include lacking sufficient patient volume to maintain high-quality performance for certain procedures and pressure to drop high-value but poorly reimbursed services such as obstetrics while maintaining low-volume, high profit services such as joint replacement procedures. 30
A key way that states can support struggling rural hospitals is by expanding Medicaid under the ACA. Expanding Medicaid increases coverage among low-income adults, 31 which in turn reduces uncompensated care costs for hospitals32 and allows financially vulnerable hospitals to improve their viability.33 Consistent with other recent studies,34 the GAO concluded in a 2018 report on rural hospitals that those “located in states that increased Medicaid eligibility and enrollment experienced fewer closures.”35
Rural hospitals are cutting back on services
Rural hospitals in different states have responded to financial pressures in a variety of ways, trying to balance community needs with financial viability. For many hospitals this has meant cutting inpatient obstetric services, leaving more than half of rural counties without hospital obstetric services.36 For instance, in Wisconsin, falling birth rates led to 12 hospitals in the state closing their obstetric services in the past decade.37 In Grantsburg, Wisconsin, lower birth rates and an older community population led Burnett Medical Center to shut down its obstetrics services.38 In order to offer these services, Burnett Medical Center would have needed to keep a general surgeon on call to perform caesarean sections, and with just 40 deliveries in 2017, the hospital could not justify the expense.39 While the hospital will continue providing prenatal and postnatal care, it will refer patients to a facility in Minnesota for deliveries—a facility is almost 40 minutes away.40
In other communities, hospitals have been replaced by other types of health care facilities. For example, Appalachian Regional Healthcare System closed Blowing Rock Hospital in North Carolina in 2013. Three years later, it opened a 112-bed post-acute care center in Blowing Rock in response to demand for rehabilitation services and the aging population in the surrounding area.41
Financial data shows that rural hospitals are more likely to struggle
To compare the financial situations of rural and urban hospitals and examine how future rural hospital closures could affect the availability of emergency care, CAP analyzed data from the CMS Healthcare Cost Report Information System (HCRIS). The CMS requires all Medicare-certified hospitals to report their financial information annually. CAP used the HCRIS to examine the financial margins and other characteristics of 4,147 acute care hospitals for fiscal year 2017. Of these, 1,954 hospitals (47 percent) were in rural areas, while the remaining were in urban areas. Hospitals self-report their status in the HCRIS as either urban or rural, which the CMS defines as either inside or outside of a metropolitan statistical area, respectively.42 Further information about CAP’s hospital sample can be found in the Methodological appendix.
Hospital operating margins, which measure excess patient-related revenues relative to patient-related expenses, are often used as an indicator of financial health.43 A 2011 study by Harvard researchers Dan Ly, Ashish Jha, and Arnold Epstein found that the lowest 10 percent of hospitals by operating margin were 9.5 times more likely to close within two years compared to all others. 44 The same study concluded that hospitals with low operating margins were also more likely to be acquired or merge.45
In CAP’s hospital sample, the median operating margin was negative 2.6 percent among all hospitals, negative 0.1 percent for urban hospitals, and negative 4.9 percent for rural hospitals.46 Public hospitals and MDHs in the sample were more likely to have negative operating margins, consistent with what other studies have found.47 To analyze hospitals’ relative financial health across geographic areas, CAP ranked hospitals in the HCRIS sample based on operating margin, splitting them into three groups: the lowest 10 percent, the middle 80 percent, and the highest 10 percent. The range of operating margins for each group is shown in Table 1.
Rural hospitals are less likely to be financially healthy than urban hospitals. In 2017, rural hospitals comprised only 27.9 percent of the hospitals with operating margins in the highest decile but comprised 59.7 percent of the hospitals in the lowest decile. Southern and Midwestern states had the greatest proportion of rural hospitals with low operating margins, mimicking the geographic patterns in hospital closures that the GAO report identified. CAP finds that from 2015 through 2017, rural hospitals were consistently more likely than urban hospitals to fall in the bottom 10 percent of operating margins. CAP’s analysis also confirms that rural hospitals in states that expanded Medicaid had a higher median operating margin (negative 3.4 percent) than those in states that have not expanded Medicaid (negative 5.7 percent).
To examine commonalities among the hospitals most vulnerable to closure, CAP analyzed characteristics of the hospitals with low margins, defined as having an operating margin in the lowest 10 percent among all hospitals. Smaller, low-occupancy rural hospitals were most likely to struggle financially: nearly 1 in 6 (15 percent) of hospitals with 25 or fewer beds had low margins, and nearly one-fifth (17 percent) of hospitals with low-occupancy rates had low margins. (See Figure 3)
Emergency departments are on the front lines for rural health
In some emergency situations, hospital closures can be life-threatening, increasing the time and distance patients travel to receive care. Studies show that the probability of dying from a heart attack increases with distance from emergency care,48 and traumatic injuries are more likely to be fatal for rural residents than for urban ones.49
Rural residents are more likely than urban residents to visit the emergency department.50 A shortage of primary care providers; lack of public transportation infrastructure; shortages in preventive care; higher rates of smoking and obesity; and greater prevalence of chronic disease in rural areas all contribute to the greater utilization of emergency room care.51 As a result, emergency departments often stand in as the main source of care for vulnerable and low-income populations, especially for communities that face a shortage of primary care. 52 Among the dozens of rural hospitals that have closed in recent years, some served as the only emergency department in a community, according to MedPAC53
While freestanding emergency departments have proliferated,54 they are not filling the gap for rural emergency care. MedPAC found that, as of 2016, nearly all the country’s 566 stand-alone emergency departments were in urban areas and tended to be located in more affluent communities.55 Researchers at the North Carolina Rural Health Research Program found that the freestanding emergency department model was generally not viable in rural areas of the state due to low patient volumes, high rates of uninsured patients, and provider shortages.56 One limit on the growth of independent freestanding emergency centers is that they are not recognized in Medicare law and are therefore unable to bill the program, unlike hospital-affiliated off-campus emergency departments. 57
Future rural hospital closures would increase the distances that patients travel for emergencies
To better understand how future rural hospital closures could affect access to emergency care, CAP calculated hospitals’ distance to the next-closest hospital-based emergency department. CAP restricted its 2017 HCRIS data sample to the 3,616 acute care hospitals that provide 24-hour emergency services.58 Using addresses or coordinates provided in the HCRIS, CAP mapped each low-margin rural hospital to the next-closest hospital emergency department. Mapping strategies are detailed in the Methodological appendix.
Among the 222 low-margin rural hospitals, more than half (55 percent) were more than 20 miles away from the next-closest hospital-based emergency department, and one-tenth were more than 35 miles away. (See Figure 4). The average distance to the next-closest emergency department was 22 miles.
The disappearance of rural, low-margin hospitals would greatly increase patients’ travel distances for emergency care. Without other resources to fill the gap, some patients might forgo care they need and others would be forced to undertake an even longer journey to receive medical attention.
Policies to improve rural emergency and nonemergency care
As rural hospitals continue to close, it is crucial to preserve access to emergency care for rural Americans. The following section details a series of policy recommendations to support adequate emergency care and address care shortages in rural communities.
Expand Medicaid
Experience to date suggests that rural hospitals in those states that have not yet expanded their Medicaid programs under the ACA would benefit from Medicaid expansion through lower levels of uncompensated care and increased financial sustainability. Medicaid expansion is associated with improvements in health and a wide variety of other outcomes, including lower mortality, less uncompensated care, and lower rates of medical debt.59 According to the Kaiser Family Foundation, about 4.4 million adults would gain Medicaid eligibility if the remaining 14 nonexpansion states expanded their programs.60
Policymakers can also support rural communities and their hospitals by opposing efforts to repeal the ACA. If the Trump administration-backed lawsuit against the ACA were to succeed, 20 million Americans would lose health insurance coverage, and uncompensated care would rise by $50 billion, according to the Urban Institute.61
Create a greater number of rural emergency centers
To preserve access to emergency care, Congress could allow rural hospitals like CAHs to downsize to an emergency department and eliminate inpatient beds without giving up special Medicare reimbursement arrangements. Qualifying hospitals could transfer patients requiring inpatient admission to other hospitals, while continuing to offer some diagnostic imaging and other outpatient services.
One such proposal is the Rural Emergency Acute Care Hospital Act (REACH Act), bipartisan legislation proposed by Sen. Amy Klobuchar (D-MN) and Sen. Chuck Grassley (R-IA) that would create rural emergency centers.62 This designation would allow hospitals to provide only emergency care in rural communities and receive Medicare reimbursement at 110 percent of operating costs. Separately, MedPAC has recommended that rural hospitals located more than 35 miles from the nearest emergency department be allowed to convert to freestanding emergency departments while still being reimbursed at hospital rates.63
Institute global budgeting for rural hospitals
Under global budgeting, hospitals are paid a fixed amount rather than having their reimbursements based on the volume and types of services they provide.64 Global budgeting can reduce small, rural hospitals’ financial risk by providing them with a more predictable stream of revenue. In addition, payment reforms that include both hospital and nonhospital care can encourage communities to invest in services that are typically less generously reimbursed, such as preventive care.65
For example, in 2014, Maryland transitioned its acute hospitals from fee-for-service payments to a global budget.66 An evaluation of the global budget program showed that it reduced hospital expenditures relative to trend without transferring costs to other parts of the health care system.67 Future global budgets should emphasize improvements in population health and primary care,68 including ensuring that patients receive care in appropriate settings and reducing the number of avoidable hospital visits.
The Pennsylvania Rural Health Model is the first Medicare demonstration project to test the financial viability and community effects of a global budget for strictly rural hospitals.69 This six-year program aims to smooth out cash flow for 30 rural Pennsylvania hospitals on a monthly basis with the goal of enabling hospitals to meet community needs, especially for substance-use disorder and mental health services.70 With global budgets based on the previous year’s revenues, participating hospitals will have a more predicable stream of revenue. Importantly, the program allows hospitals to share in the savings that result from avoidable utilization.71
Improve transportation for rural residents
The lack of transportation infrastructure can lead rural residents to rely on ambulances and emergency rooms for nonemergency care. In nonemergency situations, patients often cite the lack of affordable transportation as a major barrier to care access.72 In order to fill the gap, payers and policymakers should consider efforts to utilize existing community transit resources for medical transportation or reimburse patients who use ride-sharing services in areas that lack public transit or taxi services. 73 Another option would be to formalize volunteer services for medical transit. Oregon offers a tax credit for volunteer rural emergency medical services (EMS) providers, who provide medical and transportation services analogous to those of volunteer firefighter programs.74 The CMS should also consider policies to better reimburse and expand the use of telehealth in remote areas to reduce patients’ burden of transportation.75Finally, the CMS should stop approving states’ requests to waive coverage of nonemergency medical transportation (NEMT) requirements under Medicaid.76 NEMT is vital to eligible beneficiaries’ access to care, including appointments for preventive care, chronic disease management, and substance-use disorder treatment.
Strengthen the rural health care workforce
Rural health care provider shortages contribute to poorer access to care and poorer quality of care in rural communities. While 20 percent of the U.S. population lives in rural areas, only 9 percent of primary care physicians practice in rural areas.77 Greater access to primary care providers in rural areas would improve quality of care and health outcomes while also reducing unnecessary emergency department visits.78
One way to assist rural areas would be to encourage health professionals to train and work in underserved communities. Federal funding for physician training should include reimbursements for community-based sites so that medical residents can rotate through nonhospital settings.79 Expanding the National Health Service Corps—which provides scholarships and student loan repayment for professionals who work in federally designated health professional shortage areas—could also help bolster the rural workforce. In addition, changes to immigration policy—such as expanding the Conrad 30 program that funnels immigrant doctors into rural and underserved communities, reforming H-1B visas to benefit high-need communities—could help alleviate rural areas’ shortage of medical professionals.80
Conclusion
Mounting closures of rural hospitals across the country are exacerbating the disparity in health care access between rural and urban areas. The financial vulnerability of the remaining rural hospitals suggests that the trend may continue, leaving shortages in emergency care and other hospital services.
Policymakers should support initiatives that allow remaining rural hospitals the flexibility to tailor their services to meet community needs and improve access to care for rural Americans.
When it comes to out-of-pocket medical costs, many people are unaware of their potential financial burden, according to a new study released by Discover Personal Loans, a provider of banking tools and resources across various financing options.
For the study, researchers examined the average cost of certain medical procedures and compared them to perceptions of costs from 969 surveyed U.S. residents.
Four takeaways from the study:
1. Researchers found that a three-day hospitalization, knee replacement surgery and an appendectomy had the greatest variation of average actual costs compared to average perceived costs.
2. For example, surveyed Americans perceived the average cost of a three-day hospitalization to be $11,013, while the actual average cost posted on Healthcare.gov is about $30,000. That’s a variation of 63 percent.
3. The variation between average actual cost and average perceived cost for a knee replacement surgery and an appendectomy were 34 percent and 32 percent, respectively.
4. Surveyed Americans anticipate spending $2,016 for an emergency room visit, up 5 percent from the average actual cost from the Health Care Cost Institute and cited by CNN, $1,917.
Rural America is stuck in a cycle of increasingly vulnerable patients with declining access to health care.
Why it matters: Rural patients often can’t afford care, are being hounded by hospitals and collection agencies over their unpaid bills, and are facing the reality of life in communities where the last hospital has closed.
Rural Americans tend to be older, sicker and lower-income than urban Americans. They suffer from higher rates of obesity, mental health issues, diabetes, cancer and opioid addiction, as my colleagues Stef Kight and Juliet Bartz reported.
They’re also more likely to be uninsured or covered by Medicare or Medicaid, which pay doctors and hospitals less than private insurance does.
A small and shrinking population, mostly covered by insurance plans that don’t pay very much, many of whom need a lot of care, puts more financial pressure on providers, especially hospitals. Physician shortages are common.
What they’re saying: “Rural hospitals have long been right there on the edge on average, and we’re seeing more and more of them flip over to red,” said Mark Holmes, a professor at UNC-Chapel Hill and director of the Cecil G. Sheps Center for Health Services Research.
And hospital closures often exacerbate the problems communities were already facing.
Hospitals are often the largest or second-largest employer in a rural community.
These are disproportionately located in the South — the region with the nation’s worst health outcomes, and where most states haven’t expanded Medicaid — leaving hospitals with more uninsured patients.
A 2018 study in Health Affairs found that Medicaid expansion is “associated with improved hospital financial performance and substantially lower likelihoods of closure, especially in rural markets.”
The bottom line: “What we have here is not one root cause; there’s multiple things going on here,” Holmes said. “All these sort of modest kind of trends are adding up to something that’s quite considerable.”
Go deeper:
Bloomberg Businessweek reported on eastern Montana’s sole psychiatrist, despite being the state with the nation’s highest suicide rate.
The Washington Post detailed a hospital in Missouri’s practice of suing its patients for payment — money that the hospital needed but patients generally don’t have.
Kaiser Health News and NPR have profiled the fallout in a rural community in Kansas after its sole remaining hospital closed, which included a 2-week lapse in nearby emergency care.
Premiums for Affordable Care Act coverage are going down in some places, and barely rising in others.
The big picture: Health insurers raised ACA rates dramatically over the past few years, largely due to political chaos. But their plans have still proven to be extremely profitable. Now many companies are lowering premiums as they expect to send money back to their customers.
Driving the news: Blue Cross Blue Shield of North Carolina is reducing the average premium for ACA plans by 5.5% in 2020.
Nationally, average ACA premiums are basically flat for next year and are going down in a handful of states, according to an analysis by ACA tracker Charles Gaba.
Between the lines: Insurers jacked up ACA premiums after the Trump administration cut off cost-sharing subsidies and nullified the individual mandate, and as Republicans threatened to eradicate the entire law, among other things. Now, they’re correcting for that overpricing.
BCBS of North Carolina CEO Patrick Conway said in an interview premiums are falling because the plan cut some providers from its already narrow network and changed the way it pays some hospitals. But he also said the company has “more expertise in the market than when we started.”
BCBS of North Carolina’s ACA plans have been extremely lucrative — in fact, too lucrative. The ACA requires insurers to spend at least 80% of their premiums on medical care, or rebate the difference back to their customers.
In the first quarter of this year, BCBS of North Carolina spent just 67 cents of every premium dollar on care for most of its ACA plans, according to financial documents.
The bottom line: ACA plans for many middle-class people remain prohibitively expensive — often around $600 a month for individuals who get no subsidies. But for those who get financial help, “this is a stable, functional, mature market,” said David Anderson, a health policy researcher at Duke University.
Buying a new car every year would be a very impractical expense. It would also be cheaper than a year’s worth of health care for a family.
Why it matters: The cost-shifting and complexity of health insurance can hide its high cost, which crowds out families’ other needs and depresses workers’ wages.
By the numbers: Health care for a family covered by a large employer cost, on average, $22,885 last year.
That’s $2,000 more than the sticker price for a brand-new Volkswagen Beetle.
If the iconic Beetle isn’t your style, $22,885 would also be more than enough to get you a Ford Focus ($17,950), a Toyota Corolla ($18,600) or a Hyundai Sonata ($22,050).
Between the lines: Roughly $15,000 of that $22,885 comes from employers’ contribution to their workers’ premiums. That share alone is enough to buy a basic sedan.
Workers chip in an average of $4,706 per year premiums, and then spend an additional of $3,020 out of pocket. Combined, that’s almost 4 times more than the average family spends on gas in a year.
The Beetle is being discontinued in the U.S. after this year. But as health care costs continue to rise, they’ll be comparable to even fancier cars. They’re already inching up toward the cheapest Cadillac — a familiar car metaphor.
The Affordable Care Act’s “Cadillac tax” was intended to put downward pressure on prices by taxing the most generous health plans. But it actually affects a broad range of plans, and Congress has delayed the tax until 2022. The House has voted to repeal it altogether.
Medicare, the federal health insurance program for more than 60 million people ages 65 and over and younger people with long-term disabilities, helps to pay for hospital and physician visits, prescription drugs, and other acute and post-acute care services. This issue brief includes the most recent historical and projected Medicare spending data published in the 2019 annual report of the Boards of Medicare Trustees from the Centers for Medicare & Medicaid Services (CMS) Office of the Actuary (OACT) and the 2019 Medicare baseline and projections from the Congressional Budget Office (CBO).
Key Facts
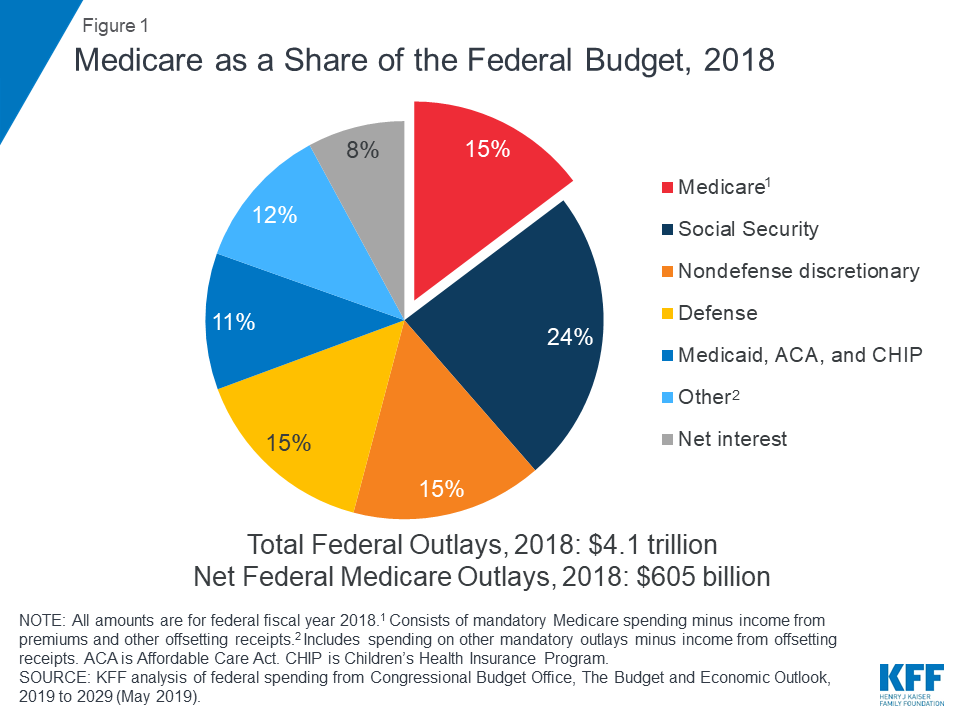
Medicare spending was 15 percent of total federal spending in 2018, and is projected to rise to 18 percent by 2029.
Based on the latest projections in the 2019 Medicare Trustees report, the Medicare Hospital Insurance (Part A) trust fund is projected to be depleted in 2026, the same as the 2018 projection.
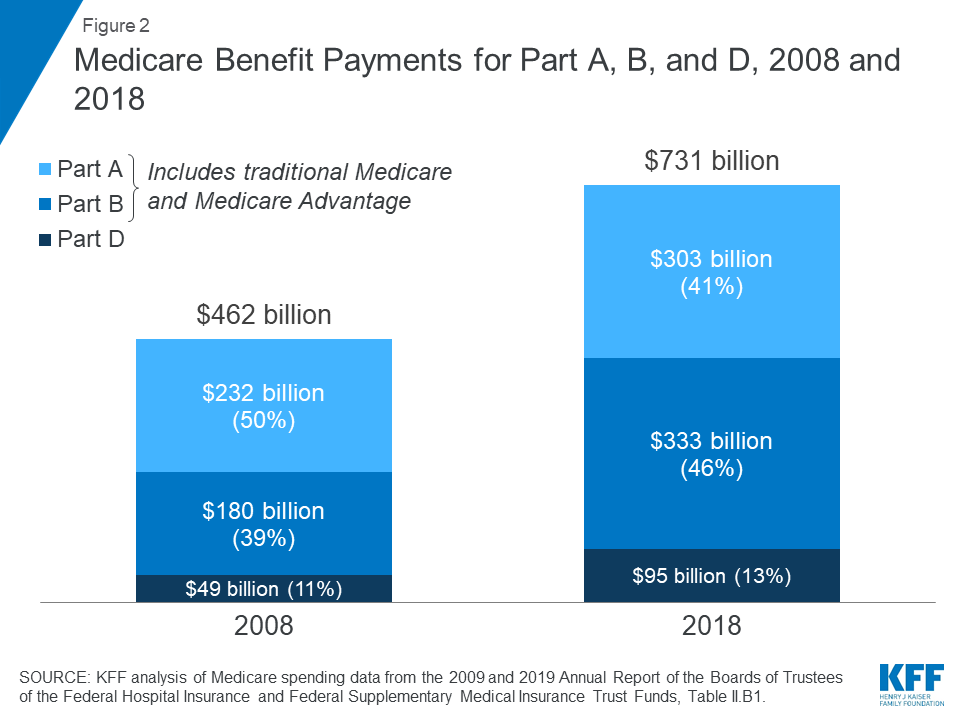
In 2018, Medicare benefit payments totaled $731 billion, up from $462 billion in 2008.
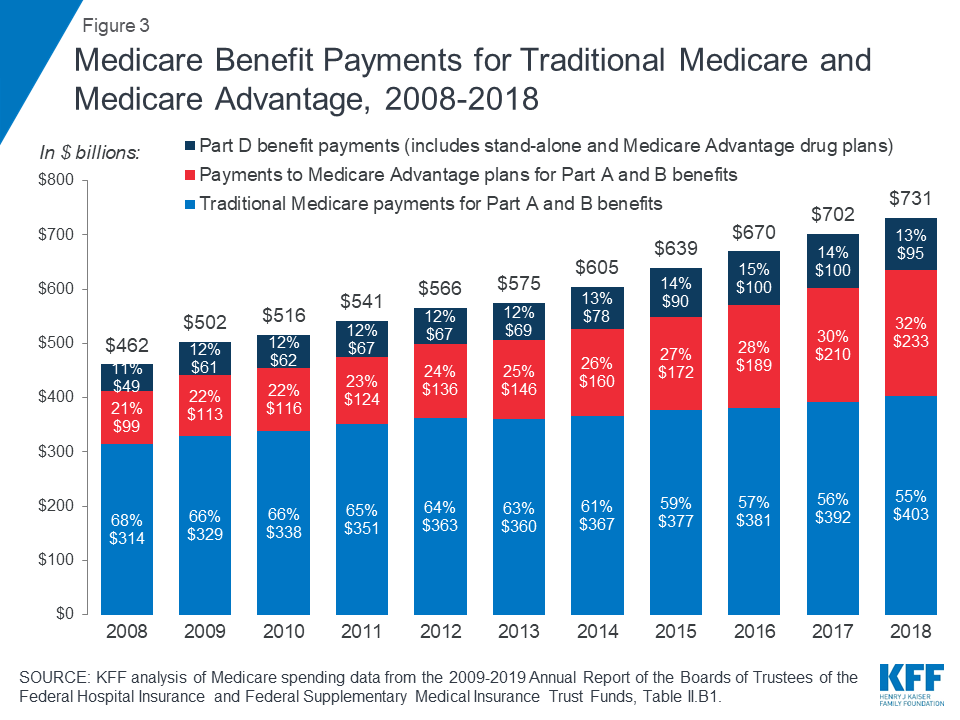
As a share of total Medicare benefit spending, payments to Medicare Advantage plans for Part A and Part B benefits increased by nearly 50 percent between 2008 and 2018, from 21 percent ($99 billion) to 32 percent ($232 billion) of total spending, as enrollment in Medicare Advantage plans increased over these years.
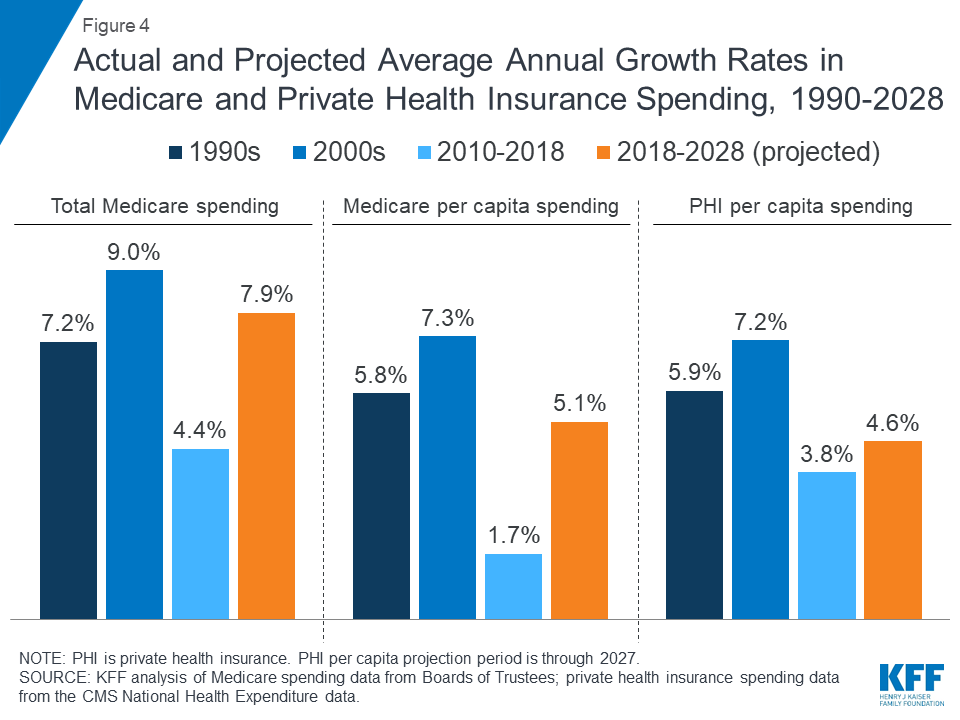
Average annual growth in Medicare per capita spending was 1.7 percent between 2010 and 2018, down from 7.3 percent between 2000 and 2010, due in part to the Affordable Care Act’s reductions in payments to providers and plans, and to an influx of younger beneficiaries from the baby boom generation aging on to Medicare, who have lower per capita health care costs.
Medicare per capita spending is projected to grow at an average annual rate of 5.1 percent over the next 10 years (2018 to 2028), due to growing Medicare enrollment, increased use of services and intensity of care, and rising health care prices.
Overview of Medicare Spending
Medicare plays a major role in the health care system, accounting for 20 percent of total national health spending in 2017, 30 percent of spending on retail sales of prescription drugs, 25 percent of spending on hospital care, and 23 percent of spending on physician services. In 2018, Medicare spending (net of income from premiums and other offsetting receipts) totaled $605 billion, accounting for 15 percent of the federal budget (Figure 1).
Figure 1: Medicare as a Share of the Federal Budget, 2018
Historical Trends in Medicare Spending
Trends in Medicare Benefit Payments
In 2018, Medicare benefit payments totaled $731 billion, up from $462 billion in 2008 (Figure 2) (these amounts do not net out premiums and other offsetting receipts). While benefit payments for each part of Medicare (A, B, and D) increased in dollar terms over these years, the share of total benefit payments represented by each part changed. Spending on Part A benefits (mainly hospital inpatient services) decreased from 50 percent to 41 percent, spending on Part B benefits (mainly physician services and hospital outpatient services) increased from 39 percent to 46 percent, and spending on Part D prescription drug benefits increased from 11 percent to 13 percent.
Figure 2: Medicare Benefit Payments for Part A, B, and D, 2008 and 2018
Another notable change in Medicare spending in the past 10 years is the increase in payments to Medicare Advantage plans, which are private health plans that cover all Part A and Part B benefits, and typically also Part D benefits. As a percent of total Medicare benefit spending, payments for Part A and Part B benefits covered by Medicare Advantage plans increased by nearly 50 percent between 2008 and 2018, from 21 percent ($99 billion) to 32 percent ($232 billion), as private plan enrollment grew steadily over these years (Figure 3). In 2018, 34 percent of Medicare beneficiaries were enrolled in Medicare Advantage plans, up from 22 percent in 2008.
Figure 3: Medicare Benefit Payments for Traditional Medicare and Medicare Advantage, 2008-2018
The overall cost of administering benefits for traditional Medicare is relatively low. In 2018, administrative expenses for traditional Medicare (plus CMS administration and oversight of Part D) were 1.3 percent of total program spending; this includes expenses for the contractors that process claims submitted by beneficiaries in traditional Medicare and their providers. This estimate does not include insurers’ costs of administering private Medicare Advantage and Part D drug plans, which are considerably higher. Medicare’s actuaries estimate that insurers’ administrative expenses and profits for Part D plans were 10.7 percent of total plan benefit payments in 2018. The actuaries have not provided a comparable estimate for Medicare Advantage plans; however, according to a recent analysis, simple loss ratios (medical expenses as a share of total premiums collected) averaged 86 percent for Medicare Advantage plans in 2018, which means that administrative expenses, including profits, were 14 percent for Medicare Advantage plans.
Trends in Total and Per Capita Medicare Spending
There has been a notable reduction in the growth of Medicare spending in recent years, compared to prior decades, both overall and per beneficiary.
Average annual growth in total Medicare spending was 4.4 percent between 2010 and 2018, down from 9.0 percent between 2000 and 2010, despite faster growth in enrollment since 2011 when the baby boom generation started becoming eligible for Medicare (Figure 4).
Average annual growth in Medicare spending per beneficiary was just 1.7 percent between 2010 and 2018, down from 7.3 percent between 2000 and 2010.
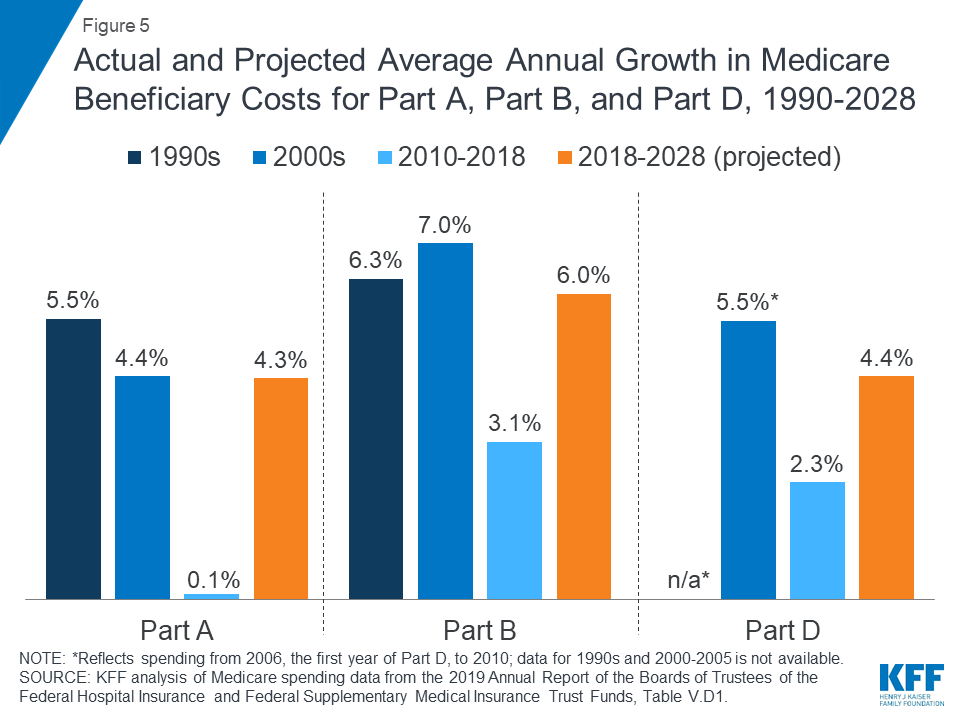
Spending on each of the three parts of Medicare (A, B, and D) has grown more slowly in recent years than in previous decades (Figure 5). For example, the average annual growth rate between 2010 and 2018 was 0.1 percent for Part A, compared to 4.4 percent in the 2000s, and 3.1 percent for Part B, compared to 7.0 percent in the 2000s.
Figure 4: Actual and Projected Average Annual Growth Rates in Medicare and Private Health Insurance Spending, 1990-2028
Figure 5: Actual and Projected Average Annual Growth in Medicare Beneficiary Costs for Part A, Part B, and Part D, 1990-2028
Slower growth in Medicare spending in recent years can be attributed in part to policy changes adopted as part of the Affordable Care Act (ACA) and the Budget Control Act of 2011 (BCA). The ACA included reductions in Medicare payments to plans and providers, increased revenues, and introduced delivery system reforms that aimed to improve efficiency and quality of patient care and reduce costs, including accountable care organizations (ACOs), medical homes, bundled payments, and value-based purchasing initiatives. The BCA lowered Medicare spending through sequestration that reduced payments to providers and plans by 2 percent beginning in 2013.
In addition, although Medicare enrollment has been growing between 2 percent and 3 percent annually for several years with the aging of the baby boom generation, the influx of younger, healthier beneficiaries has contributed to lower per capita spending and a slower rate of growth in overall program spending.
Spending Trends for Medicare Compared to Private Health Insurance
Prior to 2010, per enrollee spending growth rates were comparable for Medicare and private health insurance. With the recent slowdown in the growth of Medicare spending and the recent expansion of private health insurance through the ACA, however, the difference in growth rates between Medicare and private health insurance spending per enrollee has widened.
In the 1990s and 2000s, Medicare spending per enrollee grew at an average annual rate of 5.8 percent and 7.3 percent, respectively, compared to 5.9 percent and 7.2 percent for private insurance spending per enrollee (Figure 4).
Between 2010 and 2018, Medicare per capita spending grew considerably more slowly than private insurance spending, increasing at an average annual rate of just 1.7 percent over this time period, while average annual private health insurance spending per capita grew at 3.8 percent.
Medicare Spending Projections
Short-Term Spending Projections for the Next 10 Years
While Medicare spending is expected to continue to grow more slowly in the future compared to long-term historical trends, Medicare’s actuaries project that future spending growth will increase at a faster rate than in recent years, in part due to growing enrollment in Medicare related to the aging of the population, increased use of services and intensity of care, and rising health care prices.
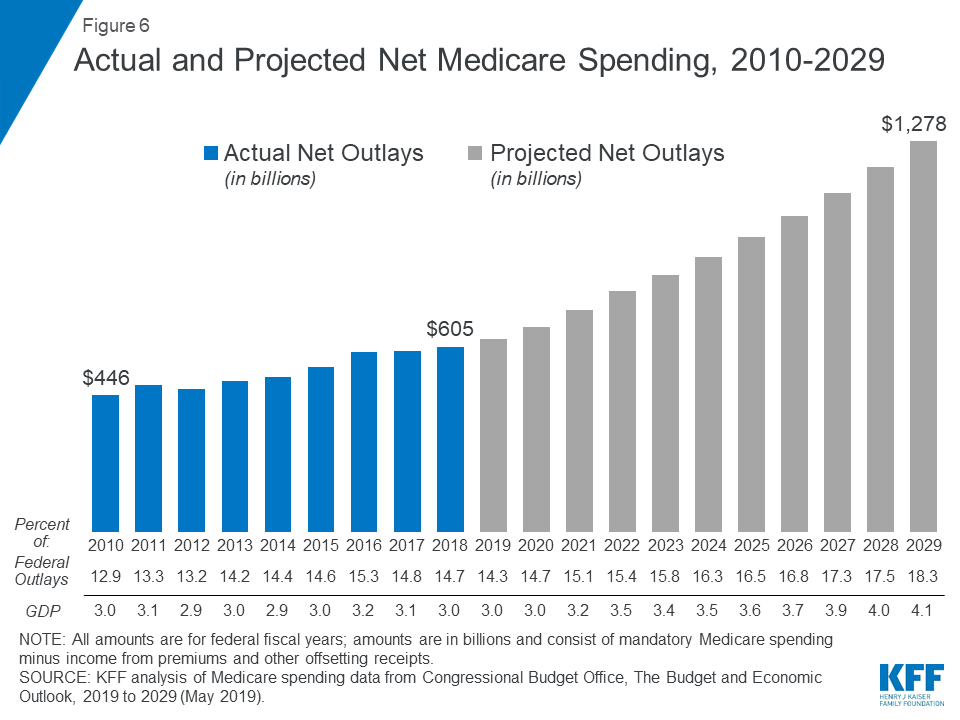
Looking ahead, CBO projects Medicare spending will double over the next 10 years, measured both in total and net of income from premiums and other offsetting receipts. CBO projects net Medicare spending to increase from $630 billion in 2019 to $1.3 trillion in 2029 (Figure 6). Between 2019 and 2029, net Medicare spending is also projected to grow as a share of the federal budget—from 14.3 percent to 18.3 percent—and the nation’s economy—from 3.0 percent to 4.1 percent of gross domestic product (GDP).
Figure 6: Actual and Projected Net Medicare Spending, 2010-2029
Spending Growth Rate Projections for the Next 10 Years
Average annual growth in total Medicare spending is projected to be higher between 2018 and 2028 than between 2010 and 2018 (7.9 percent versus 4.4 percent) (Figure 4).
On a per capita basis, Medicare spending is also projected to grow at a faster rate between 2018 and 2028 (5.1 percent) than between 2010 and 2018 (1.7 percent), and slightly faster than the average annual growth in per capita private health insurance spending over the next 10 years (4.6 percent).
Medicare’s actuaries project a higher per capita growth rate in the coming decade for each part of Medicare, compared to their 2010-2018 growth rates: 6.0 percent for Part B, 4.4 percent for Part D, and 4.3 percent for Part A (Figure 5).
Among the reasons cited for projected growth in Part B spending are legislative changes in the Bipartisan Budget Act (BBA) of 2018, including repeal of the Independent Payment Advisory Board(which also affects Part A and Part D spending projections) and repealing annual limits on therapy services covered under Part B, and higher Medicare Advantage spending. Projected increases in Part B per capita spending will lead to increases in the Part B premium and deductible.
The projected increase in Part D per capita spending growth is driven by a slowdown in the generic dispensing rate and increased specialty drug use, offset by higher manufacturer rebates negotiated by private plans and a decline in spending for hepatitis C drugs, which was a significant driver of higher total Part D spending in 2014 and 2015.
Long-term Spending Projections
Over the longer term (that is, beyond the next 10 years), both CBO and OACT expect Medicare spending to rise more rapidly than GDP due to a number of factors, including the aging of the population and faster growth in health care costs than growth in the economy on a per capita basis. According to CBO’s most recent long-term projections, net Medicare spending will grow from 3.0 percent of GDP in 2019 to 6.0 percent in 2049.
Over the next 30 years, CBO projects that “excess” health care cost growth—defined as the extent to which the growth of health care costs per beneficiary, adjusted for demographic changes, exceeds the per person growth of potential GDP (the maximum sustainable output of the economy)—will account for half of the increase in spending on the nation’s major health care programs (Medicare, Medicaid, and subsidies for ACA Marketplace coverage), and the aging of the population will account for the other half.
How is Medicare Financed?
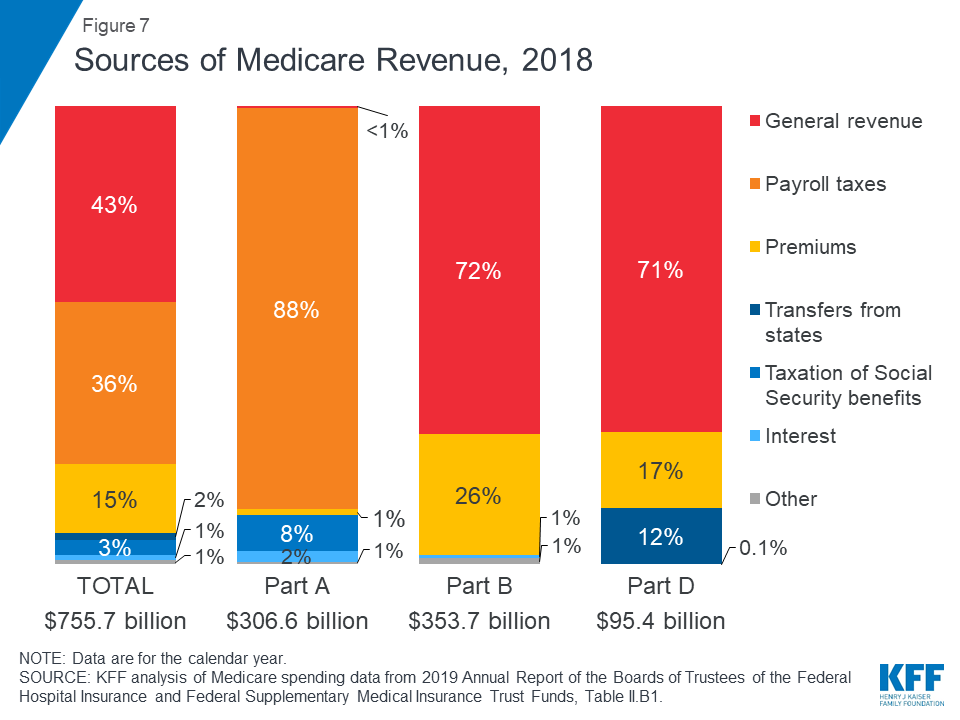
Medicare is funded primarily from general revenues (43 percent), payroll taxes (36 percent), and beneficiary premiums (15 percent) (Figure 7).
Figure 7: Sources of Medicare Revenue, 2018
Part A is financed primarily through a 2.9 percent tax on earnings paid by employers and employees (1.45 percent each) (accounting for 88 percent of Part A revenue). Higher-income taxpayers (more than $200,000/individual and $250,000/couple) pay a higher payroll tax on earnings (2.35 percent).
Part B is financed through general revenues (72 percent), beneficiary premiums (26 percent), and interest and other sources (2 percent). Beneficiaries with annual incomes over $85,000/individual or $170,000/couple pay a higher, income-related Part B premium reflecting a larger share of total Part B spending, ranging from 35 percent to 85 percent.
Part D is financed by general revenues (71 percent), beneficiary premiums (17 percent), and state payments for beneficiaries dually eligible for Medicare and Medicaid (12 percent). Higher-income enrollees pay a larger share of the cost of Part D coverage, as they do for Part B.
The Medicare Advantage program (Part C) is not separately financed. Medicare Advantage plans, such as HMOs and PPOs, cover Part A, Part B, and (typically) Part D benefits. Beneficiaries enrolled in Medicare Advantage plans pay the Part B premium, and may pay an additional premium if required by their plan; about half of Medicare Advantage enrollees pay no additional premium.
Assessing Medicare’s Financial Condition
Medicare’s financial condition can be assessed in different ways, including comparing various measures of Medicare spending—overall or per capita—to other spending measures, such as Medicare spending as a share of the federal budget or as a share of GDP, as discussed above, and estimating the solvency of the Medicare Hospital Insurance (Part A) trust fund.
Solvency of the Medicare Hospital Insurance Trust Fund
The solvency of the Medicare Hospital Insurance trust fund, out of which Part A benefits are paid, is one way of measuring Medicare’s financial status, though because it only focuses on the status of Part A, it does not present a complete picture of total program spending. The solvency of Medicare in this context is measured by the level of assets in the Part A trust fund. In years when annual income to the trust fund exceeds benefits spending, the asset level increases, and when annual spending exceeds income, the asset level decreases. When spending exceeds income and the assets are fully depleted, Medicare will not have sufficient funds to pay all Part A benefits.
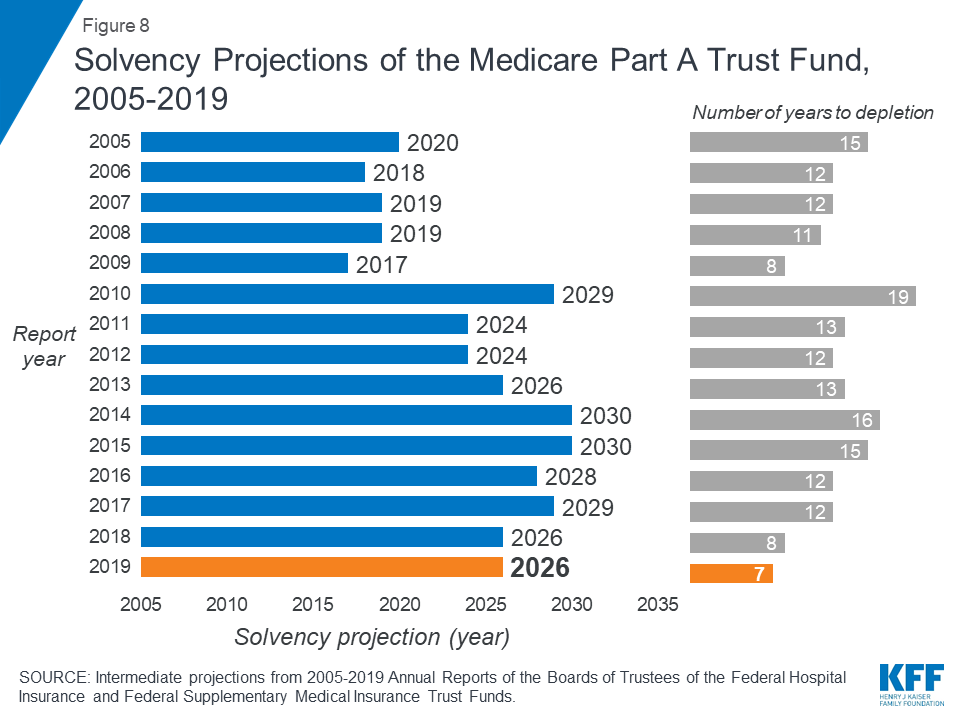
Each year, Medicare’s actuaries provide an estimate of the year when the asset level is projected to be fully depleted. In the 2019 Medicare Trustees report, the actuaries projected that the Part A trust fund will be depleted in 2026, the same year as their 2018 projection and three years earlier than their 2017 projection (Figure 8). The actuaries estimate that Medicare will be able to cover 89 percent of Part A costs from payroll tax revenue in 2026.
Figure 8: Figure 8: Solvency Projections of the Medicare Part A Trust Fund, 2005-2019
In the 2018 and 2019 Medicare Trustees reports, the actuaries attributed the earlier depletion date to several factors, including legislative changes enacted since the 2017 report that will reduce revenues to the Part A trust fund and increase Part A spending:
lower-than-expected revenues from payroll taxes in 2017 and 2018 due to lowered wages and lower levels of projected GDP;
lower revenue projections from taxation of Social Security benefits (which provided 8 percent of Part A revenues in 2018) as a result of the tax cut legislation enacted in December 2017;
higher-than-expected spending for Part A benefits and higher projected provider payment updates;
higher spending projections due repeal of the ACA’s individual mandate, which is expected to increase the number of people without health insurance, which will result in an increase in Medicare’s disproportionate share hospital (DSH) payments for uninsured patients; and
higher spending projections due to repeal of the Independent Payment Advisory Board, which would have helped to control Medicare spending if the growth rate exceeded certain target levels.
In general, Part A trust fund solvency is also affected by the level of growth in the economy, which affects Medicare’s revenue from payroll tax contributions, by overall health care spending trends, and by demographic trends—of note, an increasing number of beneficiaries, especially between 2010 and 2030 when the baby boom generation reaches Medicare eligibility age, and a declining ratio of workers per beneficiary making payroll tax contributions.
Part B and Part D do not have financing challenges similar to Part A, because both are funded by beneficiary premiums and general revenues that are set annually to match expected outlays. Expected future increases in spending under Part B and Part D, however, will require increases in general revenue funding and higher premiums paid by beneficiaries.
The Future Outlook
Although Medicare spending is on a slower upward trajectory now than in past decades, total and per capita annual growth rates are trending higher than their historically low levels of the past few years. The aging of the population, growth in Medicare enrollment due to the baby boom generation reaching the age of eligibility, and increases in per capita health care costs are leading to growth in overall Medicare spending. At the same time, recent legislative changes, including repeal of the ACA’s individual mandate and repealing IPAB, have worsened the short-term outlook for the Medicare Part A trust fund and have led to projections of higher Medicare spending in the future.
A number of changes to Medicare have been proposed in the past to address the fiscal challenges posed by the aging of the population and rising health care costs. Lately, policymakers have been focused more narrowly on policy options to control Medicare prescription drug spending, rather than on broader proposals to reduce the growth in Medicare spending. And there has been little discussion of revenue options that could be considered to help finance care for Medicare’s growing and aging population, including raising the Medicare payroll tax or increasing other existing taxes. Meanwhile, Medicare has featured prominently in the 2020 presidential campaign, with proposals from some Democratic candidates to expand on it as part of a Medicare-for-all plan, and ideas from others to allow people to buy into it.
The prospects for proposals that would affect Medicare’s financial outlook are unknown, but they will require careful deliberation over the effects on not only the program’s finances but also its growing number of beneficiaries.