This week, the House Energy and Commerce and Ways and Means Committees begins work on the reconciliation bill they hope to complete by Memorial Day. Healthcare cuts are expected to figure prominently in the committee’s work.
And in San Diego, America’s Physician Groups (APG) will host its spring meeting “Kickstarting Accountable Care: Innovations for an Urgent Future” featuring Presidential historian Dorris Kearns Goodwin and new CMS Innovation Center Director Abe Sutton. Its focus will be the immediate future of value-based programs in Trump Healthcare 2.0, especially accountable care organizations (ACOs) and alternative payment models (APMs).
Central to both efforts is the administration’s mandate to reduce federal spending which it deems achievable, in part, by replacing fee for services with value-based payments to providers from the government’s Medicare and Medicaid programs.
The CMS Center for Medicare and Medicaid Innovation (CMMI) is the government’s primary vehicle to test and implement alternative payment programs that reduce federal spending and improve the quality and effectiveness of services simultaneously.
Pledges to replace fee-for-service payments with value-based incentives are not new to Medicare. Twenty-five years ago, they were called “pay for performance” programs and, in 2010, included in the Affordable Care as alternative payment models overseen by CMMI.
But the effectiveness of APMs has been modest at best: of 50+ models attempted, only 6 proved effective in reducing Medicare spending while spending $5.4 billion on the programs. Few were adopted in Medicaid and only a handful by commercial payers and large self-insured employers. Critics argue the APMs were poorly structured, more costly to implement than potential shared savings payments and sometimes more focused on equity and DEI aims than actual savings.
The question is how the Mehmet Oz-Abe Sutten version of CMMI will approach its version of value-based care, given modest APM results historically and the administration’s focus on cost-cutting.
Context is key:
Recent efforts by the Trump Healthcare 2.0 team and its leadership appointments in CMS and CMMI point to a value-agenda will change significantly. Alternative payment models will be fewer and participation by provider groups will be mandated for several. Measures of quality and savings will be fewer, more easily measured and and standardized across more episodes of care. Financial risks and shared savings will be higher and regulatory compliance will be simplified in tandem with restructuring in HHS, CMS and CMMI to improve responsiveness and consistency across federal agencies and programs.
Sutton’s experience as the point for CMMI is significant. Like Adam Boehler, Brad Smith and other top Trump Healthcare 2.0 leaders, he brings prior experience in federal health agencies and operating insight from private equity-backed ventures (Honest Health, Privia, Evergreen Nephrology funded through Nashville-based Rubicon Founders). Sutton’s deals have focused on physician-driven risk-bearing arrangements with Medicare with funding from private investors.
The Trump Healthcare 2.0 team share a view that the healthcare system is unnecessarily expensive and wasteful, overly-regulated and under-performing. They see big hospitals and drug companies as complicit—more concerned about self-protection than consumer engagement and affordability.
They see flawed incentives as a root cause, and believe previous efforts by CMS and CMMI veered inappropriately toward DEI and equity rather than reducing health costs.
And they think physicians organized into risk bearing structures with shared incentives, point of care technologies and dependable data will reduce unnecessary utilization (spending) and improve care for patients (including access and affordability).
There’s will be a more aggressive approach to spending reduction and value-creation with Medicare as the focus: stronger alternative payment models and expansion of Medicare Advantage will book-end their collective efforts as Trump Healthcare 2.0 seeks cost-reduction in Medicare.
What’s ahead?
Trump Healthcare 2.0 value-based care is a take-no prisoners strategy in which private insurers in Medicare Advantage have a seat at their table alongside hospitals that sponsor ACOs and distribute the majority of shared savings to the practicing physicians. But the agenda will be set, and re-set by the administration and link-minded physician organizations like America’s Physician Groups and others that welcome financial risk-sharing with Medicare and beyond.
The results of the Trump Healthcare 2.0 value agenda will be unknown to voters in the November 2026 mid-term but apparent by the Presidential campaign in 2028. In the interim, surrogate measures for performance—like physician participation and projected savings–will be used to show progress and the administration will claim success. It will also spark criticism especially from providers who believe access to needed specialty care will be restricted, public and rural health advocates whose funding is threatened, teaching and clinical research organizations who facing DOGE cuts and regulatory uncertainty, patient’s right advocacy groups fearing lack of attention and private payers lacking scalable experience in Medicare Advantage and risk-based relationships with physicians.
Last week, the American Medical Association named Dr. John Whyte its next President replacing widely-respected 12-year CEO/EVP Jim Madara. When he assumes this office in July, he’ll inherit an association that has historically steered clear of major policy issues but the administration’s value-based care agenda will quickly require his attention.
Physicians including AMA members are restless:
At last fall’s House of Delegates (HOD), members passed a resolution calling for constraints on not-for-profit hospital’ tax exemptions due to misleading community benefits reporting and more consistency in charity care reporting by all hospitals.
The majority of practicing physicians are burned-out due to loss of clinical autonomy and income pressures—especially the 75% who are employees of hospitals and private-equity backed groups. And last week, the American College of Physicians went on record favoring “collective action” to remedy physician grievances. All impact the execution of the administration’s value-based agenda.
Arguably, the most important key to success for the Trump Healthcare 2.0 is its value agenda and physician support—especially the primary care physicians on whom the consumer engagement and appropriate utilization is based. It’s a tall order.
The Trump Healthcare 2.0 value agenda is focused on near-term spending reductions in Medicare. Savings in federal spending for Medicaid will come thru reconciliation efforts in Congress that will likely include work-requirements for enrollees, elimination of subsidies for low-income adults and drug formulary restrictions among others. And, at least for the time being, attention to those with private insurance will be on the back burner, though the administration favors insurance reforms adding flexible options for individuals and small groups.
The Trump Healthcare 2.0 value-agenda is disruptive, aggressive and opportunistic for physician organizations and their partners who embrace performance risk as a permanent replacement for fee for service healthcare. It’s a threat to those that don’t.
This week, the House Energy and Commerce and Ways and Means Committees begins work on the reconciliation bill they hope to complete by Memorial Day. Healthcare cuts are expected to figure prominently in the committee’s work.
And in San Diego, America’s Physician Groups (APG) will host its spring meeting “Kickstarting Accountable Care: Innovations for an Urgent Future” featuring Presidential historian Dorris Kearns Goodwin and new CMS Innovation Center Director Abe Sutton. Its focus will be the immediate future of value-based programs in Trump Healthcare 2.0, especially accountable care organizations (ACOs) and alternative payment models (APMs).
Central to both efforts is the administration’s mandate to reduce federal spending which it deems achievable, in part, by replacing fee for services with value-based payments to providers from the government’s Medicare and Medicaid programs. The CMS Center for Medicare and Medicaid Innovation (CMMI) is the government’s primary vehicle to test and implement alternative payment programs that reduce federal spending and improve the quality and effectiveness of services simultaneously.
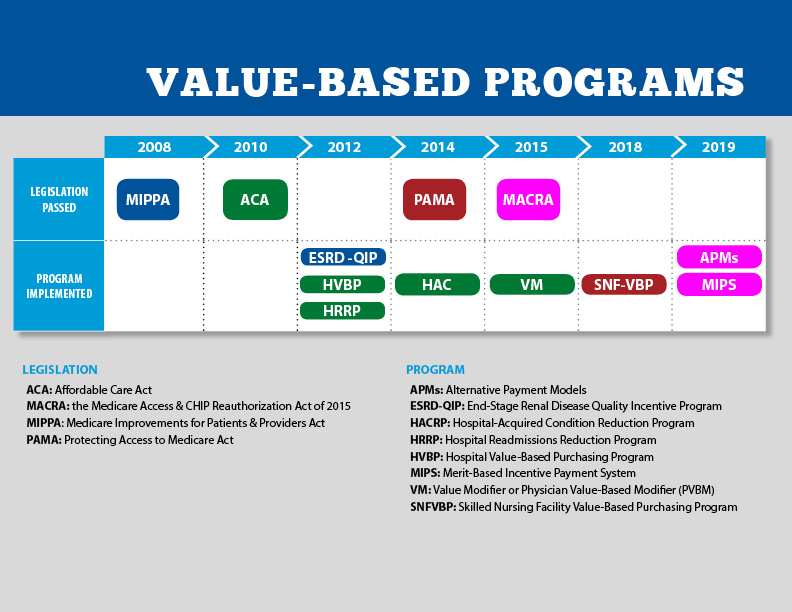
Pledges to replace fee-for-service payments with value-based incentives are not new to Medicare. Twenty-five years ago, they were called “pay for performance” programs and, in 2010, included in the Affordable Care as alternative payment models overseen by CMMI. But the effectiveness of APMs has been modest at best: of 50+ models attempted, only 6 proved effective in reducing Medicare spending while spending $5.4 billion on the programs. Few were adopted in Medicaid and only a handful by commercial payers and large self-insured employers. Critics argue the APMs were poorly structured, more costly to implement than potential shared savings payments and sometimes more focused on equity and DEI aims than actual savings.
The question is how the Mehmet Oz-Abe Sutten version of CMMI will approach its version of value-based care, given modest APM results historically and the administration’s focus on cost-cutting.
Context is key:
Recent efforts by the Trump Healthcare 2.0 team and its leadership appointments in CMS and CMMI point to a value-agenda will change significantly. Alternative payment models will be fewer and participation by provider groups will be mandated for several. Measures of quality and savings will be fewer, more easily measured and and standardized across more episodes of care. Financial risks and shared savings will be higher and regulatory compliance will be simplified in tandem with restructuring in HHS, CMS and CMMI to improve responsiveness and consistency across federal agencies and programs.
Sutton’s experience as the point for CMMI is significant. Like Adam Boehler, Brad Smith and other top Trump Healthcare 2.0 leaders, he brings prior experience in federal health agencies and operating insight from private equity-backed ventures (Honest Health, Privia, Evergreen Nephrology funded through Nashville-based Rubicon Founders). Sutton’s deals have focused on physician-driven risk-bearing arrangements with Medicare with funding from private investors.
The Trump Healthcare 2.0 team share a view that the healthcare system is unnecessarily expensive and wasteful, overly-regulated and under-performing. They see big hospitals and drug companies as complicit—more concerned about self-protection than consumer engagement and affordability. They see flawed incentives as a root cause, and believe previous efforts by CMS and CMMI veered inappropriately toward DEI and equity rather than reducing health costs. And they think physicians organized into risk bearing structures with shared incentives, point of care technologies and dependable data will reduce unnecessary utilization (spending) and improve care for patients (including access and affordability).
There’s will be a more aggressive approach to spending reduction and value-creation with Medicare as the focus: stronger alternative payment models and expansion of Medicare Advantage will book-end their collective efforts as Trump Healthcare 2.0 seeks cost-reduction in Medicare.
What’s ahead?
Trump Healthcare 2.0 value-based care is a take-no prisoners strategy in which private insurers in Medicare Advantage have a seat at their table alongside hospitals that sponsor ACOs and distribute the majority of shared savings to the practicing physicians. But the agenda will be set, and re-set by the administration and link-minded physician organizations like America’s Physician Groups and others that welcome financial risk-sharing with Medicare and beyond.
The results of the Trump Healthcare 2.0 value agenda will be unknown to voters in the November 2026 mid-term but apparent by the Presidential campaign in 2028. In the interim, surrogate measures for performance—like physician participation and projected savings–will be used to show progress and the administration will claim success. It will also spark criticism especially from providers who believe access to needed specialty care will be restricted, public and rural health advocates whose funding is threatened, teaching and clinical research organizations who facing DOGE cuts and regulatory uncertainty, patient’s right advocacy groups fearing lack of attention and private payers lacking scalable experience in Medicare Advantage and risk-based relationships with physicians.
Last week, the American Medical Association named Dr. John Whyte its next President replacing widely-respected 12-year CEO/EVP Jim Madara. When he assumes this office in July, he’ll inherit an association that has historically steered clear of major policy issues but the administration’s value-based care agenda will quickly require his attention.
Physicians including AMA members are restless: at last fall’s House of Delegates (HOD), members passed a resolution calling for constraints on not-for-profit hospital’ tax exemptions due to misleading community benefits reporting and more consistency in charity care reporting by all hospitals. The majority of practicing physicians are burned-out due to loss of clinical autonomy and income pressures—especially the 75% who are employees of hospitals and private-equity backed groups. And last week, the American College of Physicians went on record favoring “collective action” to remedy physician grievances. All impact the execution of the administration’s value-based agenda.
Arguably, the most important key to success for the Trump Healthcare 2.0 is its value agenda and physician support—especially the primary care physicians on whom the consumer engagement and appropriate utilization is based. It’s a tall order.
The Trump Healthcare 2.0 value agenda is focused on near-term spending reductions in Medicare. Savings in federal spending for Medicaid will come thru reconciliation efforts in Congress that will likely include work-requirements for enrollees, elimination of subsidies for low-income adults and drug formulary restrictions among others. And, at least for the time being, attention to those with private insurance will be on the back burner, though the administration favors insurance reforms adding flexible options for individuals and small groups.
The Trump Healthcare 2.0 value-agenda is disruptive, aggressive and opportunistic for physician organizations and their partners who embrace performance risk as a permanent replacement for fee for service healthcare. It’s a threat to those that don’t.
In January 2023, the Rockefeller Institute published a three-part blog series on trends to watch in healthcare in 2023. The series covered broad issues related to the healthcare workforce, economy, and health policy, and highlighted internal industry changes and trends in service delivery, quality, and equity.
Here, we provide a recap and mid-year update on those trends.
The Public Health Emergency:
In January, we anticipated the COVID-19 federal public health emergency (PHE) would end at some point during the year and its ending would impact the industry by rolling back flexibilities and programs that were temporarily put in place to combat the pandemic. The end of the PHE, while not a “trend” per se, held significant potential to alter the trajectory of trends in healthcare coverage, access, and care delivery that were occurring during the pandemic.
Mid-year Update: As predicted, the PHE was not renewed and ended on May 11, 2023. The most notable impact of the non-renewal of the PHE was the end of continuous Medicaid public health insurance coverage. The Kaiser Family Foundation’s Medicaid Enrollment Tracker shows that, as of July 5, 2023, 1,652,000 Medicaid enrollees were disenrolled by the District of Columbia and 28 states reporting data. For context, this means that 39% of people with a completed renewal were disenrolled in reporting states, though disenrollment rates varied significantly across those states from 16 percent in Virginia to 75 percent in South Carolina. The eligibility redetermination process that can lead to a potential disenrollment is being conducted differently in each state with some states moving quickly to make redeterminations and others doing the process more deliberately over the course of the year with a clear intent to avoid shedding people from the Medicaid program because of an inability to submit administrative paperwork.
The process for eligibility renewals will continue to play out over the course of the next year since states have until mid-2024 to update all Medicaid enrollees’ eligibility status. Also notable are some changes made under the purview of the PHE that persist despite the emergency’s conclusion. For example, access to COVID-19 vaccinations and certain COVID-19 treatments generally have not been affected. Some telehealth flexibilities that were allowed under the PHE are also staying in effect, at least until the end of 2024.
Healthcare Workforce Shortages:
Prior to the pandemic, larger demographic trends in society were already impacting the supply of the healthcare workforce. The number of people aging and needing healthcare services was growing while the number of people available to provide care was not keeping pace thus creating a long-term healthcare workforce shortage.
Mid-year Update:The workforce shortage continues. As outlined in a May 23rd Becker’s Hospital Review article, several sources point to a continued shortage. They include a report that says the US could see a deficit of 200,000 to 450,000 registered nurses by 2025. Within the next five years, another report also projects a shortage of more than 3.2 million lower-wage healthcare workers, such as medical assistants, home health aides, and nursing assistants. As a result, some healthcare providers are becoming more creative in their efforts to counteract the workforce shortage: creating alumni networks from which to recruit or providing other benefits to their workforce, such as housing or educational assistance. Policymakers can help counteract the negative impacts of the workforce shortage through a variety of strategies. With the shortage expected to continue, it will be important to enact additional policies that bolster the workforce.
Price Inflation:
As we noted, price inflation was significant in 2022 but was not unique to the health sector.Inflation was particularly exacerbated by the re-opening of the economy after the pandemic, the continued war in Ukraine, and supply chain challenges.
Mid-year Update: Prices for many consumer goods and services increased faster than usual, with overall inflation reaching a four-decade high in mid-2022. The Bureau of Labor Statistics (BLS) reported inflation rates have slowed, with overall prices growing by 6 percent in February 2023 compared to the previous year. Interestingly, prices for medical care increased only 2.3 percent. Similarly, BLS reported that the average price of health care in the United States increased by 0.7 percent in the 12 months ending May 2023, following a previous increase of 1.1 percent. The slower price growth in healthcare compared to other sectors of the economy is highly unusual,[i] and while inflation is not easily influenced by state-level policymakers’ actions alone, the trend is still worth monitoring to better understand the impacts on healthcare access and quality. As of early July, the latest predictions from PwC are that healthcare costs will rise 7% in 2024.
Declining Margins at Hospitals:
Previous analysis by the consulting firm Kaufman Hall predicted that more than half of all hospitals would have negative margins at the end of 2022. As we noted, this was due to such factors as higher-than-normal expenses for staff, supplies, and pharmaceuticals and lower revenues.
Mid-year Update: The latest report from Kaufman Hall offers data that shows a reversal in this trend for the first part of 2023. May was the third consecutive month in which hospital margins were positive after operating in the red for most of 2022. The return to normal is largely driven by revenues that are more in line with pre-pandemic levels. With revenues returning to more normal levels, expenses will be particularly important to watch for the remainder of 2023. If hospital expenses continue to outweigh revenues, policymakers may need to evaluate the financial health of providers and the potential impact that may have on access to services for patients.
Private Equity in Healthcare:
We predicted that private equity (PE) would continue to grow in healthcare, pointing to a PwC consulting report that indicated that PE companies still had plenty of “dry powder,” or money, to invest in 2023.
Mid-year Update:There has been a slowdown in private equity deals over the last year. But it is notable that there were still 200 private equity deals in healthcare in the first quarter of 2023, according to PitchBook’s healthcare services report released in May 2023. While lower than the year before, this is still considered active when compared to pre-pandemic PE dealmaking. Because of the waning of the pandemic and stability returning to the healthcare sector, it is more likely that PE deals stabilize in 2023. And some industry predictions indicate that dealmaking will bounce back further in the second half of 2023. As noted in our previous blog, it will be important to monitor the proliferation of PE in healthcare and determine its impact on healthcare markets, care delivery, innovation, and quality.
Consolidations:
Like many other industries, consolidations of all sorts have been happening in healthcare. The consolidations are both vertical—combining two or more stages of production normally operated by separate companies into one company, such as when hospitals or insurers employ physicians and/or acquire physician practices or other entities like pharmacies—and horizontal—combining organizations that provide the same or similar services, such as hospitals acquiring hospitals.
Mid-year Update: Consolidations of all sorts of healthcare entities continued in 2023 with some of the biggest potential consolidations yet. Those include the proposed merger of two major bi-coastal health system providers: Geisinger, based in Pennsylvania, and Kaiser, based in California. Although the deal must still go through regulatory approval, if completed, the two systems will create a nonprofit that will look to add five or six more systems nationally over the next five years. Other notable consolidations include the finalization of tech-giant Amazon’s purchase of One Medical, a primary care network. And Optum, one of the largest conglomerates that is a subsidiary of United Health Group, increased its net revenue growth by 25% to $54.1 billion in the first quarter of 2023, primarily due to more patients visiting OptumHealth clinics and growth in OptumRx pharmacy scripts processed. Optum’s growth is likely to continue in 2023 as they expect to add another 10,000 physicians. Case in point, in February of this year, Optum paid an undisclosed sum for Crystal Run Healthcare, a network of nearly 400 providers in New York. A goal of consolidation has been better coordination of patient care for improved outcomes and value. Results have been mixed and it is therefore an important trend for policymakers and researchers to monitor and to ensure the impacts are positive.
Alternate Payment Models:
Alternate payment models (APMs) in healthcare have been expanding especially since enactment of the Patient Protection and Affordable Care Act in 2010. They are primarily being developed by the Center for Medicare and Medicaid Innovation (CMMI) which has driven payment policy (including APMs) in the two big government healthcare programs: Medicaid and Medicare. There have been several iterations of APMs—over 50 models—but the one common theme is that all of them generally seek to reward better care.
Mid-year Update: Since the start of 2023, the most notable expansion of the trend toward more alternate payment models was CMMI’s introduction of a new primary care-focused APM called Making Care Primary. In addition to this model, it is expected that the Centers for Medicaid and Medicare Services (CMS), which oversees the operation of these two large public health insurance programs, will introduce more new payment models in 2023, including one that allows states to manage the total cost of care in a given region. This may take various forms, including something akin to Maryland’s global budget, which is used statewide. Since the total cost of care model has yet to be officially revealed, this trend and the emergence of any new developments is worth watching in the second half of 2023. Policymakers can learn from these various payment models and use them to inform the plans implemented in their own state or region in order to improve healthcare.
Attention to Health Equity:
A notable aspect of the pandemic was the disparate impact it had on people of color and other marginalized groups. In response, policymakers and providers began paying more attention to the underlying cause of these disparities. In 2021, President Joe Biden signed an executive order to focus federal resources and attention on reducing health disparities.
Mid-year Update: Increased attention to health equity in healthcare has continued. Ernst and Young, an international consulting group, released its first-ever report on the state of health equity in the United States, which involved a survey of over 500 providers to begin tracking their methods for, and progress in, addressing health disparities. More recently, in June 2023, The Joint Commission on the Accreditation of Healthcare Organizations (JCAHO) announced that it will be adding a certification program for healthcare organizations specifically targeted towards improving health equity. While attention to equity has grown, what will be interesting to watch in the second half of 2023 is the degree to which such efforts are having an impact on actually reducing disparities. Understanding the impacts of various interventions can help policymakers expand efforts that are effective.
Digital TeleHealth Delivery Expansion:
The use of digital health expanded dramatically from 2020 to 2022 as social distancing practices were adopted and telehealth options became more widely available. As noted in our blog series, digital health “includes mobile health (mHealth), health information technology (IT), wearable devices, telehealth and telemedicine, and personalized medicine.” It also includes, “mobile medical apps and software that support the clinical decisions doctors make every day to do artificial intelligence and machine learning.”
Mid-year Update: At the end of 2022 and the start of 2023, the ability to infuse capital to drive the expansion of digital health seemed tenuous, in part due to the collapse of Silicon Valley Bank (SVB). As noted by the publication Pitchbook and CB Insights, venture capital funding in the digital health space totaled $7.5 billion in 2022, a 57 percent year-over-year drop. Although the fast pace of investment in digital health may have slowed since its explosion during the pandemic, the expansion of digital health continues. Our January blog suggested that areas such as behavioral health, care at home, and maternal health were areas to watch. In 2023, digital access is expanding in other areas, such as in-home urgent primary care to allow for the treatment of complex injuries and illnesses with the goal of reducing emergency department visits. And other important digital health deals are still occurring: health tech startup Florence picked up Zipnosis from Bright Health to expand its virtual care capabilities. And with the launch of consumer-facing tech products, such as Chat GPT and Apple Vision Pro in the first half of 2023, additional opportunities for applying such technologies in healthcare may fuel further expansion of digital health. Policies that are developed in the future may want to support the growth of such innovation, while also being mindful to monitor the potential impacts on care.
Expansion of Non-Traditional Providers:
In January, we noted an emergence of companies in healthcare whose genesis was something other than healthcare. The blog pointed to examples of how companies such as Walgreens, CVS, and Amazon were expanding their offerings in healthcare.
Mid-year Update:Non-traditional entities continue to expand in the healthcare space. Notable examples include the recent acquisitions and expansions made by CVS. One of these expansions is being done through its affiliation with the insurance company, Aetna. Through Aetna, CVS has entered the insurance exchange market in four more states in 2023, in addition to the 12 states in which it already operates. CVS also closed a deal in the first half of 2023 to acquire Oak Street Health for over $10 billion. And, in March 2023, CVS announced it had officially acquired Signify Health, a digital telehealth company that enables more care to occur in-home. As noted earlier, Amazon officially completed its deal to acquire OneMedical and United Health Group is working on expanding its use of value-based care through a partnership with Walmart. Monitoring the impact of these emerging companies in healthcare will be important for policymakers that have historically only focused on more traditional providers, such as hospitals. These non-traditional entrants, in many cases, are large organizations with substantial resources and their impact may be just as significant if not greater than traditional providers.
Conclusion
These trends merit close attention in the second half of 2023. As healthcare takes on new shapes, the implications for those in the sector and all who depend on it will be huge. In addition, there are important implications for state and federal policymakers who will need to consider how these trends impact access, affordability, and quality of health care, so they can determine whether and how government might help to accelerate beneficial innovations, invest in promising trends, prevent or reverse harmful trends, and monitor the impacts on consumers.
The Biden administration is trying to jump start a Medicare program that pays health providers based on patient outcomes rather than by how many services they perform.
Why it matters: The alternative payment effort was created through the Affordable Care Act, but participation has plateaued since 2018 amid waning interest from providers.
Driving the news: The Biden administration finalized an overhaul of the initiative, known as the Medicare Shared Savings Program, on Tuesday. Changes include offering groups of providers in rural and other underserved areas upfront payments to help them start out in the program.
The rule includes other provisions to make it less financial risky for provider groups to join, and makes it easier for participants to earn money back from the government year after year — a central perk of joining the program.
Zoom out: Medicare traditionally pays on a “fee-for-service” basis pegged to the number of patients seen and volume of procedures performed.
But one of the main funding sources for Medicare is set to run dry in 2028 if the federal government doesn’t make changes. Advocates say the solution at least partially lies in value-based care programs, like the Shared Savings Program.
Under the program, doctors, hospitals and other providers join form groups known as accountable care organizations. ACOs take responsibility for the care of a set of traditional Medicare patients.
If ACOs reduce total care costs for their members, they can get back a portion of that savings from the government. ACOs at more advanced stages of the program must pay the government back if total patient spending crosses a threshold.
By the numbers: ACOs have saved the federal government more than $17 billion since 2012, according to the National Association of Accountable Care Organizations.
In 2022, 483 ACOs participated in the program and took care of more than 11 million Medicare enrollees. But that’s down from 517 ACOs participating in 2020.
CMS set a goal last year to bring all 63 million-plus Medicare beneficiaries into a value-based care model by 2030. ACOs are a key player in achieving the goal.
Go deeper: Providers and value-based care advocates are also pushing Congress to extend a 5% pay bump for providers that participate in advanced alternative payment models, including some tracks of the Medicare Shared Savings Program. The bonus expires Dec. 31.
“If the bonus is not continued, it will soften or dampen the momentum toward alternative payment models, because it would create this mentality, or the view, that we’re not serious about that transformation,” said Mara McDermott, vice president at McDermott+Consulting and executive director of the Value Based Care Coalition.
Losing the bonus would also make it harder to recruit new providers into alternative payment models, she added.
The American Medical Association and five other health care groups launched a separate coalition Tuesday to rally around an extension of the 5% bonus.
“Patients and the healthcare system in the United States quite literally cannot afford to return to the days before Medicare incentivized healthcare providers for generating good results,” Clif Gaus, CEO of the National Association of ACOs, said in a news release about the coalition.
Also notable: The rule finalized Tuesday outlines physician payment rates for 2023. Interventional radiologists and vascular surgeons will see the largest Medicare cuts among physician specialties next year, though the final cuts are slightly lower than what CMS proposed in July.
Congress could stave off the cuts when they come back to Washington later this month.
“The Medicare payment schedule released today puts Congress on notice that a nearly 4.5 percent across-the-board reduction in payment rates is an ominous reality unless lawmakers act before Jan. 1,” American Medical Association President Jack Resneck said in a statement.
CMS finalized a slew of other policy proposals Tuesday, including provisions to reduce barriers to behavioral health care.
On July 7, 2022, the Centers for Medicare & Medicaid Services (CMS) released the 2023 Medicare Physician Fee Schedule (MPFS) proposed rule, which includes payment provisions and policy changes to the Quality Payment Program (QPP) and Alternative Payment Model (APM) participation options and requirements for 2023.
MPFS Key Proposals and Additional Potential Medicare Reductions:
For 2023, CMS proposes a Conversion Factor (CF) of $33.0775 which is a decrease of $1.53 or -4.42% from the 2022 conversion factor of 34.6062.
This significant reduction in the CF accounts for the expiration of the 3.00% increase in PFS payments for CY 2022 as required by the Protecting Medicare and American Farmers from Sequester Cuts Act, in addition to the statutorily required budget neutrality adjustment to account for changes in Relative Value Units.
The separately calculated Anesthesia CF is proposed at 20.7191, a -3.91% decrease from the 2022 conversion factor of $21.5623.
Key Takeaways: CMS estimates an impact to allowed charges from policy changes in the rule as outlined below. These impacts are due in part due changes in the RVUs and the second year of the transition to clinical labor pricing updates.
(Please note: These estimates do not include the impact on payments from the expiration of the congressionally mandated 3.00% boost to the 2022 CF.)
Anesthesiology: -1%
Diagnostic Radiology: -3%
Interventional Radiology: -4%
Emergency Medicine: +1%
Critical Care: +1%
Nuclear Medicine: -3%
Pathology: -1%
Radiation Oncology/Therapy Centers: -1%
Internal Medicine: +3%
Independent Laboratory -1%
Additional Potential Medicare Reductions:
In addition to the proposed cut to the CF, the second of two sequestration cuts was implemented on July 1, 2022, at -1%, bringing the total sequestration cut to -2% which will continue without Congressional intervention.
Also, the lack of full funding of the American Rescue Plan meant that the Medicare program would contribute 4% under the “PAYGO” (Pay as You Go) rules and that cut will come back into the Medicare fee schedule in 2023. In total, hospital-based physicians face in the approximate range of -10% in 2023 without Congressional intervention.
Appropriate Use Criteria (AUC): CMS did not address the appropriate use criteria (AUC)/clinical decision support (CDS) mandate for advanced diagnostic imaging services in this rule. CMS posted an update on its website indicating that the current educational and operations testing period will continue beyond January 1, 2023, even if the COVID-19 public health emergency (PHE) ends in 2022. The notice states that the agency is unable to forecast when the payment penalty phase of the program will begin. Read more at CMS.gov.
Additional highlights of the MPFS Proposed Rule include: Evaluations and Management (E/M) Services: As part of the ongoing updates to E/M visits and the related coding guidelines that are intended to reduce administrative burden, the AMA CPT Editorial Panel approved revised coding and updated guidelines for Other E/M visits, effective January 1, 2023.
Like the approach CMS finalized in the CY 2021 MPFS final rule for office/outpatient E/M visit coding and documentation, CMS is proposing to adopt most changes in coding and documentation for Other E/M visits including: hospital inpatient, hospital observation, emergency department, nursing facility, home or residence services, and cognitive impairment assessment, effective January 1, 2023. This revised coding and documentation framework would include CPT code definition changes (revisions to the Other E/M code descriptors), and for the first time would mean that AMA CPT and CMS would follow the same coding guidelines, including:
• New descriptor times (where relevant). • Revised interpretive guidelines for levels of medical decision making. • Choice of medical decision making or time to select code level (except for services such as emergency department visits (time has never been a component of ED E/M services except critical care) and cognitive impairment assessment, which are not timed services). • Eliminated use of history and exam to determine code level (instead there would be a requirement for a medically appropriate history and exam).
Split (or Shared) Visits (Where services are performed by advance practice clinicians.) CMS had previously finalized in the 2022 MPFS final rule a new January 1, 2023 billing policy for instances in which a physician delivers an E/M service along with an advanced practice clinician (APC). Recall that E/M services billed under an APC reimburse at 85% of the MPFS unless there is a documented shared service by the supervising physician.
• The key determinant for deciding if there was a shared service is if the physician provided key elements of the history, exam, or medical decision making ─ OR half of the total time spent treating the patient. • There were significant concerns that in hospital-based settings, the rule (set for implementation on January 1, 2023) would have required only time as the determinative element, and that the majority of APC services would then be reimbursed at 85% of the fee schedule. After significant advocacy by multiple stakeholders, CMS has delayed the policy that would have based the determination of the billing practitioner solely on time. This policy is proposed for delay until January 1, 2024 while CMS collects additional input.
Expand Telehealth Coverage: • CMS is proposing making several services that are temporarily available as telehealth services for the PHE available through CY 2023 on a Category III basis, which will allow more time for collection of data that could support their eventual inclusion as permanent additions to the Medicare telehealth services list. • CMS is also proposing to extend the duration of time that services are temporarily included on the telehealth services list during the PHE, but are not included on a Category I, II, or III basis for a period of 151 days following the end of the PHE, in alignment with the Consolidated Appropriations Act, 2022 (CAA, 2022).
Highlights of the Quality Payment Program (QPP): CMS stated they are limiting proposals for traditional MIPS and focusing on further refining implementation of MIPS Value Pathways (MVPs). 2023 Proposed Performance Threshold and Performance Category Weights: The performance threshold for the 2023 performance year is proposed to be 75 points, same as 2022. • Beginning with 2023, CMS will no longer offer an exceptional performance adjustment. • The category weights for the 2023 performance year are proposed to remain the same as the 2022 weights: o Quality – 30%, o Cost – 30% o Promoting interoperability – 25% o Improvement Activities – 15%
Data Completeness Requirements: • For 2023, CMS is proposing quality measure submissions should continue to account for at least 70% of total exam volume – same as 2022.
• CMS proposed to increase this threshold to 75% beginning with the 2024 and 2025 performance years.
Quality Category – Measure Scoring System • Beginning with 2023 CMS will change the scoring range for benchmarked measures to 1 to 10 points, doing away with the 3-point floor. • Score existing non-benchmarked measures at 0 points even if data completeness is met • New measures will continue to be scored at a minimum of 7 points for their first year and a minimum of 5 points in their second year. • CMS is maintaining the small practice bonus of 6 points that is included in the Quality • performance category score. • CMS also continues to award small practices 3 points for submitted quality measures that do not meet case minimum requirements or do not have a benchmark.
MIPS Value Pathways (MVPs) CMS is proposing 5 new MVPs and revising the 7 previously established MVPs that would be available beginning with the 2023 performance year. • Advancing Cancer Care • Optimal Care for Kidney Health • Optimal Care for Patients with Episodic Neurological Conditions • Supportive Care for Neurodegenerative Conditions • Promoting Wellness
Advanced Alternative Payment Models For payment years 2019 through 2024, Qualifying APM Participants (QPs) receive a 5 percent APM Incentive Payment. After performance year 2022, which correlates with payment year 2024, there is no further statutory authority for a 5 percent APM Incentive Payment for eligible clinicians who become QPs for a year.
CMS is concerned that the statutory incentive structure under the QPP beginning in the 2023 performance year. corresponding 2025 payment year, could lead to a drop in Advanced APM participation, and a corresponding increase in MIPS participation. As a result, CMS concluded that it would forego action for the 2023 performance period and 2025 payment year. They instead are seeking public input in identifying potential options for the 2024 performance period and 2026 payment year of the QPP.
A commentary piece in Health Affairs argues that CMS’s value-based payment (VBP) initiatives have not reached their full potential because they fail to take into account conflicting market dynamics.
The authors argue that VBP models won’t take hold unless CMS both increases the “carrots”, or positive incentives, that market dominant providers receive to support true care transformation, and sharpens the “sticks” by requiring participation in accountable care organization (ACO) models, decreasing the attractiveness of fee-for-service (FFS) payments, and banning anti-competitive commercial deals that discourage steering referrals toward lower-cost providers.
The Gist: To date, CMS’s VBP efforts have largely fallen short of their two primary objectives: transforming care at scale across the country, and generating meaningful savings for the federal government.
With more and more seniors choosing Medicare Advantage (MA) each year, the federal government clearly views MA as the primary vehicle to control Medicare cost growth in the future—although savings will ultimately hinge on CMS cutting payments to insurers in the future.
Over time, continuing to foster the growth of MA may prove more successful than overcoming the myriad complications of FFS-based VBP programs.
While the ongoing pandemic has impacted all Americans, Covid has been most detrimental to the elderly and people with disabilities, many of whom depend on long-term services and supports (LTSS). This has placed greater emphasis on alternative care models that allow elderly Americans with LTSS needs to live at home, where a vast majority of this population prefers to receive care. Today, more than 800,000 people are on waitlists to receive home and community-based services. This transition of care to the home is a theme that has become prevalent during Covid and warrants attention going forward.
Additionally, value-based care has emerged as a fixture of the healthcare landscape. More than a trend, this secular theme has brought with it a proliferation of new companies. While value-based care has different meanings depending on application, the core concept is that all stakeholders win. Members receive better care, payers see cost savings and providers are less encumbered with administrative work, allowing them to be more engaged with members. Value-based care underscores the concept that the best outcomes are achieved when all stakeholders are aligned.
One of these models that inherently encompasses value-based care AND offers an alternative LTSS model that is home and community-based is the Program of All-Inclusive Care for the Elderly (“PACE”). PACE is a fully integrated, highly coordinated care model that provides comprehensive medical and social services to frail, medically complex, elderly individuals, most of whom are dually eligible for Medicare and Medicaid benefits. PACE addresses the social determinants of health – transportation, meals, and social isolation, to name a few. 95% of PACE participants live safely in the community. PACE is a fully capitated model, which allows providers to deliver all services participants need, rather than limit them to those reimbursable under Medicare and Medicaid fee-for-service plans.
PACE produces tangible outcomes for all stakeholders:
Members experience reduced hospital admissions, decreased rehospitalizations, reduced ER visits, fewer nursing home admissions and better preventive care;
States pay PACE programs 13% less than the cost of other Medicaid services; Seniors receive better quality outcomes and can remain living in their communities; and importantly 97.5% of family caregivers would recommend PACE to someone in a similar situation.
The PACE model is roughly 50 years old, and in recent years enrollment has grown at a healthy 9% CAGR. Yet, while there are approximately 58,000 PACE participants, there are ~2 million Americans that could qualify, representing a penetration rate of just 3%. This is low. There are many reasons for this: regulation and policy challenges, limited access to the program, lack of awareness of the program by seniors, and capital-intensity to develop.
In Cain Brothers’ view, as we look to emerge from this pandemic, PACE is well positioned for an acceleration. There are a number of factors we have been watching that support this:
The current administration is pushing to expand home and community-based services. In April 2021, Senator Bob Casey (D-PA), Chairman of the Special Committee on Aging, introduced the PACE Plus Act that would strengthen and expand access to the PACE program;
The existing PACE landscape remains very fragmented and many players would benefit from scale and innovation;
Over the last few years, more private investment has come into the sector, which should help to fuel growth and expansion; and
More state Medicaid programs are planning for or are in the process of (most recently, DC and Illinois) developing and expanding PACE programs creating an opportunity for new entrants.
How might the PACE landscape change over the next few years? We could see consolidation of current players, new entrants, or partnerships between not-for-profits and for-profits. Whatever the form, PACE clearly benefits all stakeholders. The pandemic has cast a light on this value proposition and carved a path for adoption to meaningfully accelerate.
40% of primary care clinicians worry that the field won’t exist in five years as many in the healthcare workforce experience burnout and plan to leave the field.
Clinician burnout, lay-offs, and other healthcare workforce challenges coming out of the COVID-19 pandemic are creating issues for primary care, according to a new survey.
About 40 percent of over 700 primary care clinicians recently surveyed by the Larry A. Green Center, Primary Care Collaborative (PCC), and 3rd Conversation worry that primary care won’t exist in five years’ time. Meanwhile, about a fifth say they expect to leave primary care within the next three years.
“Primary care is the front door to the healthcare system for most Americans, and the door is coming off its hinges,” Christine Bechtel, co-founder of 3rd Conversation, a community of patients and clinicians, said in a press release. “The fact that 40 [percent] of clinicians are worried about the future of primary care is of deep concern, and it’s time for new public policies that value primary care for the common good that it is.”
The threat to primary care comes as practices ramp up vaccination efforts. The survey found that more than half of respondents (52 percent) report receiving enough or more than enough vaccines for their patients, and 31 percent are partnering with local organizations or government to prioritize people for vaccination.
Stress levels at primary care practices are also decreasing compared to the height of the pandemic, according to survey results. However, over one in three, or 36 percent, of respondents say they are experiencing hardships, such as feeling constantly lethargic, having trouble finding joy in anything, and/or struggling to maintain clear thinking.
Clinician fatigue could spell trouble for the primary care workforce and the field itself, researchers indicated.
“The administration has now recognized the key role primary care is able to play in reaching vaccination goals,” Rebecca Etz, PhD, co-director of The Larry A. Green Center, said in the release. “While the pressure is now on primary care to convert the most vaccine-hesitant, little has been done to support primary care to date. Policymakers need to bear witness to the quiet heroism of primary care – a workforce that suffered five times more COVID-related deaths than any other medical discipline.”
Many primary care clinicians are hoping the federal government steps in to change policy and bolster primary care and the healthcare workforce. The government can start with how primary care is paid, respondents agreed.
About 46 percent of clinicians responding to the survey said policy should change how primary care is financed so that the field is not in direct competition with specialty care. The same percentage of clinicians also said policy to change how primary care is paid by shifting reimbursement from fee-for-service.
Over half of clinicians (56 percent) also agreed that policy should protect primary care as a common good and make it available to all regardless of ability to pay.
Alternative payment models helped providers during the COVID-19 pandemic, research from healthcare improvement company Premier, Inc. showed. Their study found that organizations in alternative payment models were more likely to leverage care management, remote patient monitoring, and population health data during the pandemic compared to organizations that relied on fee-for-service revenue.
“Many of the practices, especially in primary care, have been extremely cash strapped and have been struggling for many years,” Sanjay Doddamani, MD, toldRevCycleIntelligence last year.
“This has been a big moment for us to act in accelerating our performance-based incentive payments to our primary care doctors. We moved up our schedule of payments so that they could at least have some continued flow of funds,” added the chief physician executive and COO at Southwestern Health Resources, a clinically integrated network based in Texas.
Value-based contracting could be the key to primary care’s existence in the future, that is, if practices get on board with alternative payment models. A majority of respondents to the latest Value-Based Care Assessment from Insights said over 75 percent of their organization’s revenue is from fee-for-service contracts. This was especially true for respondents working in physician practices, of which 64 percent relied almost entirely on fee-for-service payments.
Two influential advisory groups sent recommendations to Congress calling for a revamp of how health plans are paid in the lucrative Medicare Advantage program, culling how many models CMS tests and curbing high-cost drug approvals.
By many measures, the MA program has been thriving. Enrollment and participation has continued to grow, and in 2021, MA plans’ bids to provide the Medicare benefit declined to a record low: Just 87% of comparable fee-for-service spending in their markets.
But despite that relative efficiency, MA contracting isn’t saving Medicare money — actually, in the 35 years Medicare managed care has been active, it’s never resulted in net savings for the cash-strapped program, James Mathews, executive director of the Medicare Payment Advisory Commission, told reporters in a Tuesday briefing.
MedPAC estimates Medicare actually spends 4% more per capita for beneficiaries in MA plans than those in FFS under the existing benchmark policy.
To save money, Medicare could change how the benchmark, the maximum payment amount for plans, is adjusted for geographic variation, MedPAC said.
Under current policy, Medicare pays MA plans more if they cover an area with lower FFS spending, despite most plans bidding below FFS in these areas. At the same time, plans in areas where FFS spending is higher bid at a lower level relative to their benchmark, and wind up getting higher rebates — the difference between the bid and the benchmark — as a result.
“Because the rebate dollars must be used to provide extra benefits, large rebates result in plans offering a disproportionate level of extra benefits,” MedPAC wrote in its annual report to Congress. “Moreover, as MA rebates increase, a smaller share of those rebates is used for cost-sharing and premium reductions — benefits that have more transparent value and provide an affordable alternative to Medigap coverage.”
The group recommended rebalancing the MA benchmark policy to use a relatively equal blend of per-capita FFS spending in a local area and standardized national FFS spending, which would reduce variation in local benchmarks, and use a rebate of at least 75%. Currently, a plan’s rebate depends on its star rating, and ranges from 65% to 70%.
MedPAC also suggested a discount rate of at least 2% to reduce local and national blended spending amounts.
The group’s simulations suggest the changes would have minimal impact on plan participation or MA enrollees, but could lead to savings in Medicare of about 2 percentage points, relative to current policy.
Finding savings in Medicare, even small ones, is integral for the program’s future, policy experts say. The Congressional Budget Office expects the trust fund that finances Medicare’s hospital benefit will become insolvent by 2024, as — despite perennial warnings from watchdogs and budget hawks — lawmakers have kicked the can on the insurance program’s snowballing deficit for years.
Fewer and more targeted alternative payment models
MedPAC also recommended CMS streamline its portfolio of alternative payment models, implementing a smaller and more targeted suite of the temporary demonstrations designed to work together.
CMS is already undergoing a review of the models, meant to inject more value into healthcare payments, following calls from legislators for more oversight in the program. The agency doesn’t have the most stellar track record: Of the 54 models its Center for Medicare and Medicaid Innovation has trialed since it was launched a decade ago, just four have been permanently encoded in Medicare.
New CMMI head Elizabeth Fowler said earlier this month the agency will likely enact more mandatory models to force the shift toward value, as the ongoing review has resulted in more conscious choices about where it should invest.
In its report, MedPAC pointed out many of CMMI’s models generated gross savings for Medicare, before performance bonuses to providers were shelled out. That suggests the models have the power to change provider practice patterns, but their effects are tricky to measure. Many providers are in multiple models at once, and the same beneficiaries can be shared across models, too.
Additionally, some models set up conflicting incentives. Mathews gave the example of accountable care organizations participating in one model to reduce spending on behalf of an assigned population relative to a benchmark, but its provider participants could also be in certain bundled models with incentives to keep the cost of care per episode low — but not reduce the overall number of episodes themselves.
“The risk of these kinds of inconsistent incentives would be minimized again if the models were developed in a manner where they would work together at the outset,” Mathews said. MedPAC doesn’t have guidance on a specific target number of alternative models, but said it should be a smaller and more strategic number.
Curbing high-cost drugs in Medicaid
Another advisory board, on the Medicaid safety-net insurance program, also released its annual report on Tuesday, recommending Congress mitigate the effect of pricey specialty drugs on state Medicaid programs.
High-cost specialty drugs are increasingly driving Medicaid spending and creating financial pressure on states. The Medicaid and CHIP Payment and Access Commission (MACPAC) didn’t recommend Congress change the requirement that Medicaid cover the drugs, but recommended legislators look into increasing the minimum rebate percentage on drugs approved by the Food and Drug Administration through the accelerated approval pathway, until the clinical benefit of the drugs is verified.
The accelerated approval pathway, which can be used for a drug for a serious or life-threatening illness that provides a therapeutic advantage over existing treatments, allows drugs to come to market more quickly. States have aired concerns about paying high list prices for such drugs when they don’t have a verified clinical benefit.
Several advisors to the FDA have resigned over the decision, as it’s unclear if aducanumab actually has a clinical benefit. What aducanumab does have is an estimated price tag of $56,000 a year, which could place severe stress on taxpayer-funded insurance programs like Medicare and Medicaid if widely prescribed.
MEDPAC also recommended an increase in the additional inflationary rebate on drugs that receive approval from the FDA under the accelerated approval pathway if the manufacturer hasn’t completed the postmarketing confirmatory trial after a specified number of years. Once a drug receives traditional approval, the inflationary rebate would revert back to the standard amounts.
The recommendations would only apply to the price Medicaid pays for the drug and doesn’t change the program’s obligation to cover it.
Several factors will shape the financial performance of physician- and hospital-led organizations under total cost of care payment models.
Introduction
Broad consensus has long existed among public- and private-sector leaders in US healthcare that improvements in healthcare affordability will require, among other changes, a shift away from fee-for-service (FFS) payments to alternative payment models that reward quality and efficiency. The alternative payment model that has gained broadest adoption over the past ten years is the accountable care organization (ACO), in which physicians and/or hospitals assume responsibility for the total cost of care for a population of patients.
Launched by the Centers for Medicare & Medicaid Services (CMS) Innovation Center in 2012, Pioneer ACO was the first such model design to generate savings for Medicare. In this incarnation, Medicare set a benchmark for total cost of care per attributed ACO beneficiary: If total cost of care was kept below the benchmark, ACOs were eligible to share in the implied savings, as long as they also met established targets for quality of care. If total cost of care exceeded the benchmark, ACOs were required to repay the government for a portion of total cost of care above the benchmark.
Payment models similar to the one adopted by Pioneer ACOs also have been extended to other Medicare ACO programs, with important technical differences in estimates for savings and rules for the distribution of savings or losses as well as some models offering gain sharing without potential for penalties for costs exceeding the benchmark. State Medicaid programs as well as private payers (across Commercial, Medicare Advantage, and Medicaid Managed Care) also have adopted ACO-like models with similar goals and payment model structures. Of the roughly 33 million lives covered by an ACO in 2018, more than 50 percent were commercially insured and approximately 10 percent were Medicaid lives.2
On the whole, ACOs in the Medicare Shared Savings Program (MSSP) have delivered high-quality care, with an average composite score of 93.4 percent for quality metrics. However, cost savings achieved by the program have been limited: ACOs that entered MSSP during the period from January 1, 2012 to December 31, 2014, were estimated to have reduced cumulative Medicare FFS spending by $704M by 2015; after bonuses were accounted for, net savings to the Medicare program were estimated to be $144M.3 Put another way, in aggregate, savings from Medicare ACOs in 2015 represented only 0.02 percent of total Medicare spending. The savings achieved were largely concentrated among physician-led ACOs (rather than hospital-led ACOs). In fact, after accounting for bonuses, hospital-led ACOs actually had higher total Medicare spending by $112M on average over three years.4
While savings from MSSP have been relatively limited, in aggregate, numerous examples exist of ACOs that have achieved meaningful savings—in some cases in excess of 5 percent of total cost of care—with significant rewards to both themselves as well as sponsoring payers (for example, Millennium, Palm Beach, BCBSMA AQC).567 The wide disparity of performance among ACOs (and across Medicare, Medicaid, and Commercial ACO programs) raises the question of whether certain provider organizations are better suited than others to succeed under total cost of care arrangements, and whether success is dictated more by ACO model design or by structural characteristics of participating providers.
In the pages that follow, we examine these questions in two ways. First, we analyze “the math of ACOs” by isolating four factors that contribute to overall ACO profitability: bonus payments, “demand destruction,” market share gains, and operating expenses. Following these factors, we illustrate the math of ACOs through modeling of the performance of five different archetypes: physician-led ACOs; hospital-led ACOs with low ACO penetration and low leakage reduction; hospital-led ACOs with high ACO penetration; hospital-led ACOs with high leakage reduction; and hospital-led ACOs with high penetration and leakage reduction.
The Math of ACOs
In the pages that follow, we break down “the math of ACOs” into several key parameters, each of which hospital and physician group leaders could consider evaluating when deciding whether to participate in an ACO arrangement with one or more payers. Specifically, we measure the total economic value to ACO-participating providers as the sum of four factors: bonus payments, less “demand destruction,” plus market share gains, less operating costs for the ACO (Exhibit 1).
In the discussion that follows, we examine each of these factors and understand their importance to the overall profitability of ACOs, using both academic research as well as McKinsey’s experience advising and supporting payers and providers participating in ACO models.
1. Bonus payments
The premise of ACOs rests on the opportunity for payers and participating providers to share in cost savings arising from curbing unnecessary utilization and more efficient population health management, thus aligning incentives to control total cost of care. Because ACOs are designed to reduce utilization, the bonus—or share of estimated savings received by an ACO—is one factor that significantly influences ACO profitability and has garnered the greatest attention both in academic research and in private sector negotiations and deliberations over ACO participation. Bonus payments made to ACOs are themselves based on several key design elements:
The baseline and benchmark for total costs, against which savings are estimated8 ;
The shared savings rate and minimum savings/loss rates;
Risk corridors, based on caps on gains/losses and/or “haircuts” to benchmarks; and,
Frequency of rebasing, with implications for benchmark and shared savings.
1a. Baseline and benchmark
Most ACO models are grounded in a historical baseline for total cost of care, typically on the population attributed to providers participating in the ACO. Most ACO models apply an annual trend rate to the historical baseline, in order to develop a benchmark for total cost of care for the performance period. This benchmark is then used as the point of reference to which actual costs are compared for purposes of determining the bonus to be paid.
Historical baselines may be based either on one year or averaged over multiple years in order to mitigate the potential for a single-year fluctuation in total cost of care that could create an artificially high or low point of comparison in the future. Trend factors may be based on historically observed growth rates in per capita costs, or forward-looking projections, which may depart from historical trends due to changes in policy, fee schedules, or anticipated differences between past and future population health. Trend factors may be based on national projections, more market-specific projections, or even ACO-specific projections. For these and other reasons, a pre-determined benchmark may not be a good estimate of what total cost of care would have been in the absence of the ACO. As a result, estimated savings, and hence bonuses, may not reflect the true savings generated by ACOs if compared to a rigorous assessment of what otherwise would have occurred.
Recent research suggests that an ACO’s benchmark should be set using trend data from providers in similar geographic areas and/or with similar populations instead of using a national market average trend factor.9 It has been observed in Medicare (and other) populations that regions (and therefore possibly ACOs) that start at a lower-than-average cost base tend to have a higher-than-average growth trend. For example, Medicare FFS spending in low-cost regions grew at a rate 1.2 percentage points faster than the national average (2.8 percent and 1.6 percent from 2013 to 2017 compound annual growth rate, respectively). This finding is particularly relevant in low-cost rural communities, where healthcare spending grows faster than the national average.10 Based on this research, some ACO models, such as MSSP and the Next Generation Medicare ACO model, have developed benchmarks based on blending ACO-specific baselines with market-wide baselines. This approach is intended to account for the differences in “status quo” trend, which sponsoring payers may project in the absence of ACO arrangements or associated improvements in care patterns. Some model architects have advocated for this provider-market blended approach to benchmark development because they believe such an approach balances the need to reward providers who improve their own performance with a principle tenet of this model: That ACOs within a market should be held accountable to the same targets (at least in the long term).
The shared savings rate is the percentage of any estimated savings (compared with benchmark) that is paid to the ACO, subject to meeting any requirements for quality performance. For example, an ACO with a savings rate of 50 percent that outperforms its benchmark by 3 percent would keep 1.5 percent of benchmark spend. Under the array of Medicare ACO models, the shared savings rate percentage ranges anywhere from 40 percent to 100 percent.11
In some ACO models, particularly one-sided gain sharing models that do not introduce downside risk, payers impose a minimum savings rate (MSR), which is the savings threshold for an ACO to receive a payout, typically 2 percent, but can be higher or lower.12 For example, assume ACO Alpha has a savings rate of 60 percent and MSR of 1.5 percent. If Alpha overperforms the benchmark by 1 percent, there would be no bonus payout, because the total savings do not meet or exceed the MSR. If, however, Alpha overperforms the benchmark by 3 percent, Alpha would receive a bonus of 1.8 percent of benchmark (60 percent of 3 percent). An MSR is common in one-sided risk agreements to protect the payer from paying out the ACO if modest savings are a result of random variations. ACOs in two-sided risk arrangements may often choose whether to have an MSR.
Both factors impact the payout an ACO receives. Between 2012 and 2018, average earned shared savings for MSSP ACOs were between $1.0M and $1.6M per ACO (between $10 and $100 per beneficiary).13 However, while nearly two out of three MSSP ACOs in 2018 were under benchmark, only about half of them (37 percent of all MSSP ACOs) received a payout due to the MSR.14
1c. Risk corridors
In certain arrangements, payers include clauses that limit an ACO’s gains or losses to protect against extreme situations. Caps depend on the risk-sharing agreement (for example, one-sided or two-sided) as well as the shared savings/loss rate. For example, MSSP Track 1 ACOs (one-sided risk sharing) cap shared savings at the ACO’s share of 10 percent variance to the benchmark, while Track 3 ACOs (two-sided risk sharing) cap shared savings at the ACO’s share of 20 percent variance to the benchmark and cap shared losses at 15 percent variance to the benchmark.15 In contrast with these Medicare models, many Commercial and Medicaid ACO models have applied narrower risk corridors, with common ranges of 3 to 5 percent. In our experience, payers have elected to offer narrower risk corridors. Their choice is based on their desire to mitigate risk as well as the interest of some payers (and state Medicaid programs) to share in extraordinary savings that may be attributable in part to policy changes or other interventions undertaken by the payers themselves, whether in coordination with ACOs or independent of their efforts.
Payers also may vary the level of shared savings (and/or risk), between that which applies to the first dollar of savings (versus benchmark) compared with more significant savings. For example, by applying a 1 percent adjustment or “haircut” to the benchmark, a payer might keep 100 percent of the first 1 percent of savings and share any incremental savings with the ACO at a negotiated shared savings rate. Depending on what higher shared savings rate may be offered in trade for the “haircut,” such a structure has the potential to increase the incentive for ACOs to significantly outperform the benchmark. For example, an ACO that beats the benchmark by 4 percentage points and earns 100 percent of savings after 1 percentage point would net 75 percent of total estimated savings. However, under the same risk model, if the ACO were to beat the benchmark by 2 percentage points, they would only earn 50 percent of total savings. Such a structure could therefore be either more favorable or less favorable than 60 percent shared savings without a “haircut,” depending on the ACO’s anticipated performance.
1d. Frequency of rebasing
In most ACO models (including those adopted by CMS for the Medicare FFS program), the ACO’s benchmark is reset for each performance period based (at least in part) on the ACO’s performance in the immediate prior year. This approach is commonly referred to as “rebasing.” The main criticism of this approach toward ACO model design—which is also evident in capitation rate setting for Managed Care Organizations—is that ACOs become “victims of their own success”: Improvements made by the ACO in one year lead to a benchmark that is even harder to beat in the following year. The corollary is also true: An ACO with “excessive” costs in Year 1 may be setting themselves up for significant shared savings in Year 2 simply by bringing their performance back to “normal” levels.
Even in situations where ACOs show steady improvements in management of total cost of care over several years, the “ratchet” effect of rebasing can have significant implications for the share of estimated savings that flow to the ACO. Exhibit 2 illustrates the shared savings that would be captured by an ACO, if it were to mitigate trend by 2 percentage points consistently for 5 years (assumes linear growth), under a model that provides 50 percent shared savings against a benchmark that is set with annual rebasing. In this scenario, although the ACO would earn 50 percent of the savings estimated in any one year (against benchmark), the ACO would derive only 16 percent of total savings achieved relative to a “status quo” trend.
Exhibit 2
Some ACO model designs (including MSSP) have mitigated this “ratchet” effect, to some extent, by using multi-year baselines, whereby the benchmark for a given performance year is based not on the ACO’s baseline performance in the immediate prior year but over multiple prior years. This approach smooths out the effect of one-year fluctuations in performance on the benchmark for subsequent years; by implication, improvements made by an ACO in Year 1 and sustained in Year 2 create shared savings in both years. Under a three-year baseline, weighted toward the most recent year 60/30/10 percent (as applies to new contracts under the MSSP), the ACO in Exhibit 2 would capture 22 percent of total estimated savings over 5 years. If the model were instead to adopt an evenly weighted three-year baseline, that same ACO would capture 28 percent over 5 years.
In select cases, particularly in the Commercial market, payers and ACOs have agreed to multi-year prospective benchmarks. Under this approach, the benchmark for performance Years 1 to 5 (for example) are set prospectively in Year 0; the benchmarks for Years 2 and 3, for example, are not impacted by the ACO’s performance in Year 1. If this approach were to be applied to the ACO depicted in Exhibit 2, they would earn fully 50 percent of the total savings, assuming that the prospectively established 5-year benchmark was set at the “status quo” trend line. While prospective multi-year benchmarks may be more favorable to ACOs, they also increase the sensitivity of ACO performance to both the original baseline as well as the reasonableness of the prospectively applied trend rate.
Key takeaways
While in many cases healthcare organizations are highly focused on the percent of shared savings they will receive (shared savings rate), in our experience, the financial sustainability of ACO arrangements may be equally or more greatly affected by several other design parameters outlined here, among them: the inclusion of an MSR or a “haircut” to benchmark, either of which may dampen the incentive to perform; benchmark definitions including the use of provider-specific, market-specific, and/or national baseline and trend factors; and the frequency of rebasing, as implied by the use of a single-year or multi-year baseline, or the adoption of prospectively determined multi-year benchmarks.
2. Demand destruction
Although shared savings arrangements are meant to align providers’ incentives with curbing unnecessary utilization, the calculation of bonus payments based on avoided claims costs (as described in Section 1) does not account for the foregone provider revenue (and margins) attached to reductions in patient volume. The economic impact of this reduction in patient volume, sometimes referred to as “demand destruction,” is described in this section, which we address in two parts:
Foregone economic contribution based on reduced utilization in the ACO population; and,
Spillover effects from reduced utilization in the non-ACO population, based on clinical and operational changes that “spillover” from the ACO population to the non-ACO population.
2a. Foregone economic contribution
Claims paid to hospital systems for inpatient, outpatient, and post-acute facility utilization typically comprise 40 to 70 percent of total cost of care, with hospital systems that own a greater share of outpatient diagnostic lab and/or imaging and/or skilled nursing beds falling at the upper end of this range. These same categories of facility utilization may comprise 60 to 80 percent of reductions in utilization arising from improvements in population health management by an ACO. Given the high fixed costs (and correspondingly high gross margins) associated with inpatient, outpatient, and post-acute facilities, foregone facility volume could come at an opportunity cost of 30 to 70 percent of foregone revenue—that opportunity cost being the gross contribution margin associated with incremental patient volume, calculated as revenue less variable costs: Commercially insured ACO populations are more likely to fall into the upper end of this range and Medicaid populations into the lower end. This is the reason savings rates tend to be higher in the Commercial market, to offset the larger (negative) financial impact of “demand destruction.”
For example, a hospital-led ACO that mitigates total cost of care by 3 percent (or $300 based on a benchmark of $10,000 per capita) might forego $180 to $240 of revenue per patient (assuming 60 to 80 percent of savings derived from hospital services), which may represent $90 to $120 in foregone economic contribution, assuming 50 percent gross margins. As this example shows, this foregone economic contribution may represent a significant offset to any bonus paid under shared savings arrangements, unless the shared savings percentage is significantly greater than the gross margin percentage for foregone patient revenue.
For some hospitals that are capacity constrained, the lost patient volume may be replaced (that is, backfilled) with additional patient volume that may be more or less profitable depending on the payer (for example, an ACO that backfills with more profitable Commercial patients). However, the vast majority of hospitals are not traditionally capacity constrained and therefore must look to other methods (for example, growing market share) to be financially sustainable.
In contrast, physician-led ACOs have comparatively little need to consider the financial impact of “demand destruction,” given that they never benefitted from hospitalizations and thus do not lose profits from forgone care. Furthermore, primary care practices may actually experience an increase, rather than decrease, in patient revenue, based on more effective population health management. Even for multi-specialty physician practices that sponsor ACO formation, any reductions in patient volume arising from the ACO may have only modest impact on practice profitability due to narrow contribution margins attached to incremental patient volume. Physician-led ACOs may need to be concerned with “demand destruction” only to the extent that a disproportionate share of savings is derived from reductions in practice-owned diagnostics or other high-margin services; however, the savings derived from such sources are typically smaller than reductions in utilization for emergency department, inpatient, and post-acute facility utilization.
2b. Spillover effects
Though ACOs are not explicitly incentivized to reduce total cost of care of their non-ACO populations (including FFS), organizations often see increased efficiency across their full patient population after becoming an ACO. For example, research over the last decade has found reductions in spend for non-ACO lives between 1 and 3 percent (Exhibit 3).
Exhibit 3
The impact of spillover effects on an ACO’s profitability depends on the proportion of ACO and non-ACO lives that comprise a provider’s patient panel. Further, impact also depends on the ACO’s ability to implement differentiated processes for ACO and non-ACO lives to limit the spillover of the efficiencies. Although conventional wisdom implies that physicians will not discriminate their clinical practice patterns based on the type of payer (or payment), nonetheless many examples exist of hospitals and other providers with the ability to differentiate processes based on payer or payment type. For example, many hospitals deploy greater resources to discharge planning or initiate the process earlier for patients reimbursed under a Diagnosis Related Group (case rate) than for those reimbursed on a per diem or percent of charges model. Moreover, ACOs and other risk-bearing entities routinely direct care management activities disproportionately or exclusively toward patients for whom they have greater financial accountability for quality and/or efficiency. For physician-led ACOs, differentiating resource deployment between ACO- and non-ACO populations may be necessary to achieve a return on investment for new care management or other population health management activities. For hospital sponsors of ACOs that continue to derive the majority of their revenue from FFS populations outside the ACO, differentiating population health management efforts across ACO and FFS populations are of paramount importance to overall financial sustainability. To the extent that hospital-led ACOs are unable to do so, they may find total cost of care financial arrangements to be financially sustainable only if extended to the substantial majority of their patient populations in order to reduce the severity of any spillover effects.
Key takeaways
The adverse impact of “demand destruction” is what most distinguishes the math of hospital-led ACOs from that of physician-led ACOs. The structure of ACO-sponsoring hospitals—whether they own post-acute assets, for example—further shapes the severity of demand destruction, which then provides a point of reference for determining what shared savings percentage may be necessary to overcome the impact of demand destruction. Though in the long term, hospitals may be able to right size capacity, in the near term when deciding to become an ACO, there is often limited ability to alter the fixed-cost base. Finally, the extent of “spillover effects” from the ACO to the non-ACO population further impacts the financial sustainability of hospital-led ACOs. Hospital-led ACOs can seek to minimize the impact through 1) differentiating processes between the two populations, and/or 2) transitioning the substantial majority of their patient population into ACO arrangements.
3. Market share gains
Providers can further improve profitability through market share gains, specifically:
Reduced system leakage through improved alignment of referring physicians across both ACO and non-ACO patients; and,
Improved network status as an ACO.
3a. Reduced system leakage
ACOs can grow market share by coordinating patients within the system (that is, reduce leakage) to better manage total cost of care and quality. This coordination is often accomplished by improving the provider’s alignment with the referring physician; for example, ACOs can establish a comprehensive governance structure and process around network integrity, standardize the referral process between physicians and practices, and improve physician relationships within, and with awareness of, the network. Furthermore, ACOs can develop a process to ensure that a patient schedules follow-up appointments before leaving the physician’s office, optimizing the scheduling system and call center.
Stark Laws (anti-kickback regulations) have historically prevented systems from giving physicians financial incentives to reduce leakage. While maintaining high-quality standards, ACOs are given a waiver to this law and therefore are allowed to pursue initiatives that improve network integrity to better coordinate care for patients. In our experience, hospitals generally experience 30 to 50 percent leakage (Exhibit 4), but ACOs can improve leakage by 10 to 30 percent.
Exhibit 4
3b. Improved network status
In some instances for Commercial payers, an ACO may receive preferential status within a network by entering into a total cost of care arrangement with a payer. As a result, the ACO would see greater utilization, which will improve profitability. For example, in 2012, the Cooley Dickinson Hospital (CDH) and Cooley Dickinson Physician Hospital Organization, a health system in western Massachusetts with 66 primary care providers and 160 specialists, joined Blue Cross Blue Shield of Massachusetts’ (BCBSMA) Alternative Quality Contract (AQC), which established a per-patient global budget to cover all services and expenses for its Commercial population. As a result of joining the AQC, reducing the prices charged for services, and providing high quality of care, CDH was “designated as a high-value option in the Western Mass. Region,” which meant BCBSMA members with certain plans “[paid] less out-of-pocket when they [sought] care” at CDH.16 Other payers have also established similar mutually beneficial offerings to providers who assume more accountability for care.1718 An ACO can benefit from these arrangements up until most or all other provider systems in the same market join.
Key takeaways
These factors to improve market share (at lower cost and better quality) can help an ACO compensate for any lost profits from “demand destruction” (foregone profits and spillover effects) and increased operating costs. The opportunity from this factor, which requires initiatives that focus on reducing leakage, can be the difference between a net-neutral hospital-led ACO and a significantly profitable ACO. An example initiative would be performance management systems that analyze physician referral patterns.
4. Operating costs
Finally, profitability is impacted by operating costs or any additional expenses associated with running an ACO. These costs generally are lower for physician-led ACOs than for hospital-led ACOs (and also depend on buy-versus-build decisions). In our experience, operating costs to run an ACO vary widely depending on the provider’s operating model, cost structure (for example, existing personnel, IT capabilities), and ACO patient population (for example, number and percent of ACO lives). However, we will focus on three specific types of costs:
Care management costs, often variable, or a marginal expense for every life;
Data and analytics operating costs, which can vary widely depending on whether the ACO builds or buys this capability; and
Additional administrative costs, which are fixed or independent of the number of lives.
4a. Care management costs
In our experience, care management costs to operate an ACO range from 0.5 to 2.0 percent of total cost of care for a given ACO population. These care management costs include ensuring patients with chronic conditions are continuously managing those conditions and coordinating with physician teams to improve efficacy and efficiency of care. A core lever of success involves reducing use of unnecessary care. ACOs that spend closer to 2 percent and/or those whose efforts focus on expanding care coordination for high-risk patients struggle to achieve enough economic contribution to break even. This is because care coordination (devoting more resources to testing and treating patients with chronic disease) often does not have a positive return on investment.19 ACOs that do this effectively and ultimately spend less on care management (around 0.5 percent of the total cost of care) tend to create value primarily through curbing unnecessary utilization and steering patients toward more efficient facilities rather than managing chronic conditions. This value creation is particularly true for Commercial ACO contracts, where there is greater price variation across providers compared with Medicare and Medicaid contracts, where pricing is standardized.
4b. Data and analytics operating costs
Data and analytics operating costs are critical to supporting ACO effectiveness. For example, high-performing ACOs prioritize data interoperability across physicians and hospitals and constantly analyze electronic health records and claims data to identify opportunities to better manage patient care and reduce system leakage. ACOs can either build or license data and analytics tools, a decision that often depends on the number of ACO lives. In our experience, an ACO that decides to build its own data and analytics solutions in-house will on average invest around $24M for upfront development, amortized over 8 years for $3M per year, plus $6M in annual costs (for example, using data scientists and analysts to generate insights from the data), for a total of $9M per year. Alternatively, ACOs can license analytics software on a per-patient basis, typically costing 0.5 to 1.5 percent of the total cost of care. Thus, we find the breakeven point at around 100,000 covered ACO lives; therefore, it often makes financial sense for ACOs with more than 100,000 lives to build in-house.
4c. Additional administrative costs
Organizations must also invest in personnel to operate an ACO, typically including an executive director, head of real estate, head of care management, and lawyers and actuaries. The ACO leadership team’s responsibilities often include setting the ACO’s strategy (for example, target markets, lines of business, services offered, through which physicians and hospitals) and developing, managing, and communicating with the physician network to support continuity of care.
Key takeaways
Operating costs to run an ACO are significant. Ability to find ways to invest in fixed costs that are more transformational in nature may result in lower near-term profitability but can provide a greater return on investment in the long term both for the ACO and the rest of the system. The decision to make these investments is dependent on the number of lives covered by an individual ACO.
ACO Archetypes
Drawing on the analysis outlined above, we conducted scenario modeling of “the math of ACOs” using five different ACO archetypes, which vary in structure and performance under a common set of rules. These five archetypes include:
Typical physician-led ACO
Hospital-led ACO with low ACO penetration and low leakage reduction
Hospital-led ACO with high ACO penetration
Hospital-led ACO with high leakage reduction
Hospital-led ACO with high leakage reduction and high ACO penetration
Subsequently, taking an ACO’s structure as a given, we describe for each ACO archetype the key model design parameters and other strategic and operational choices that ACOs might make to maximize their performance.
Comparision of archetypes based on scenario modeling
Summarizing the four factors, the profitability of each archetype reveals certain insights (Exhibit 5).