
Cartoon – Modern Health Plan Renewal
https://mailchi.mp/d953ea288786/newsletter031821-4639518?e=ad91541e82

Medical debt can be a crushing burden for families, and it is a major problem in the United States. The nonprofit RIP Medical Debt says it’s wiped out debt for 2.7 million patients since 2014, totalling more than $4.5 billion. One of the most famous health policy studies ever conducted — the Oregon Health Insurance Experiment — found that having Medicaid coverage reduced a person’s likelihood of having an unpaid medical bill sent to collection by 25%. Now a study published last month in JAMA offers new evidence on the relationship between Medicaid and medical debt, and the scale of the country’s medical debt problem.
Using a subset of credit reports from one major U.S. credit agency for every year between 2009 and 2020, researchers Raymond Kluender, Neale Mahoney, Francis Wong and Wesley Yin looked at the total amount of medical debt and new medical debt each year. They found that while both measures of medical debt have decreased almost every year since 2014, nearly 1 in 5 Americans were under collections for medical debt as of early 2020. They also found that since 2014, medical debt has been the largest source of debt for Americans, surpassing all other types of debt — credit cards, personal loans, utilities and phone bills — combined. And the medical debt was not evenly distributed around the country. Approximately, 1 in 4 individuals in the South were under collection for medical debt in 2020, but only 1 in 10 in the Northeast.
To assess the impact of Medicaid coverage on medical debt, Kluender and colleagues compared the total amount of new debt accrued by people living in states that expanded Medicaid and those that have not between 2009 and 2020, allowing them to confirm that any trends they identified didn’t pre-date Medicaid expansion in 2014. They found that between 2013 and 2020 the average amount of new medical debt decreased 34 percentage points more in states that expanded in 2014 compared to non-expansion states, and the drops were most prominent in the lowest income zip codes. The analysis can’t prove a causal relationship between medical debt and Medicaid expansion, but interestingly, the authors found no statistically significant difference in nonmedical debt between expansion and non-expansion states. This lack of an effect on nonmedical debt supports the association between Medicaid and reductions in medical debt.
The article does have limitations: It doesn’t include debts paid on a credit card or through payment plans; it doesn’t reflect the impact of COVID-19; and it can’t account for unobservable changes in policy or circumstance that might have coincided with Medicaid expansion and impacted medical debt. But it does add evidence to support the value of Medicaid coverage — a particularly timely finding, with more than 11 million people joining Medicaid since the start of the pandemic and Democrats in Congress looking to cover the more than 2 million people in the so-called coverage gap in the 12 non-expansion states.

Collection agencies held $140 billion in unpaid medical debt in 2020, according to a study published July 20 in JAMA.
Researchers examined a nationally representative panel of consumer credit reports between January 2009 and June 2020. Below are four other notable findings from their report.


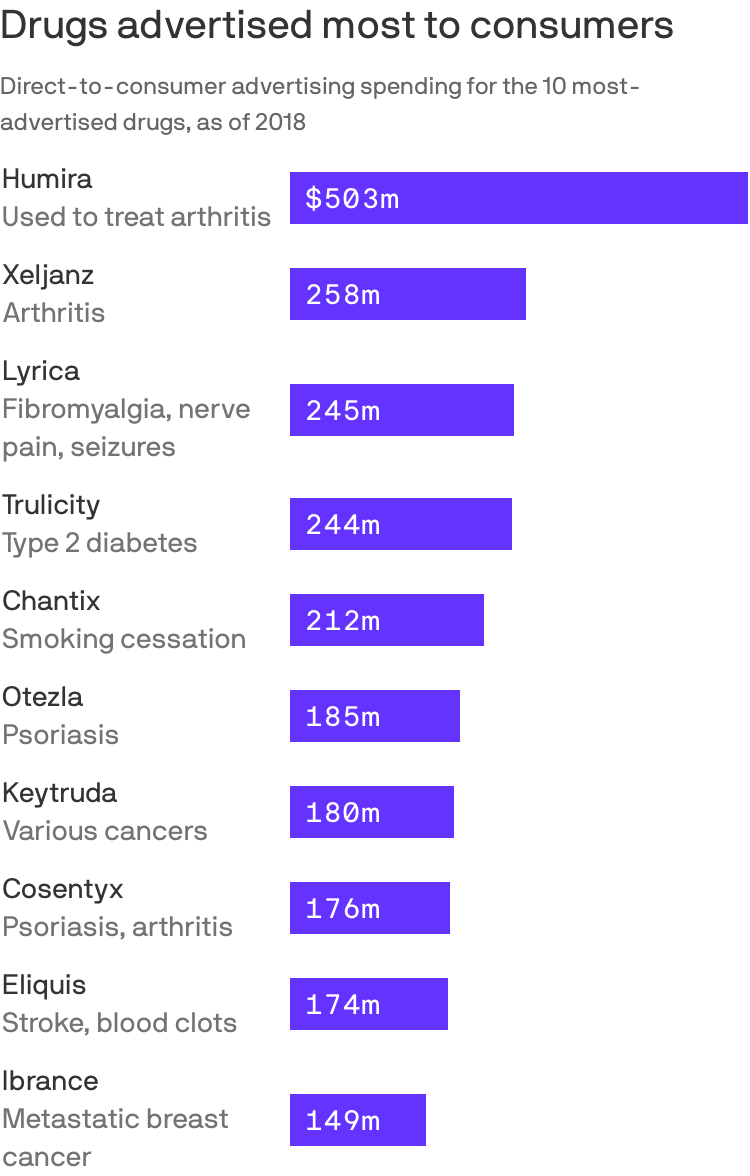
Prescription drugs with some of the highest Medicare spending also had the highest level of direct-to-consumer advertising, a recently-released GAO report found.
By the numbers: The GAO found the Medicare program and its beneficiaries spent nearly $324 billion on prescription drugs advertised to beneficiaries and other consumers between 2016 and 2018.
This amount is more than half (58%) of total Medicare Parts B and D spending on drugs during that time, the most recent data available.