https://www.ranker.com/list/maps-mash-v1/mel-judson?format=slideshow&slide=1
Category Archives: National Strategy
Coronavirus cases could reach 150,000 a day this fall, widely followed Morgan Stanley analyst says

KEY POINTS
- Morgan Stanley’s biotechnology analyst, Matthew Harrison, said 150,000 daily new U.S. coronavirus cases are possible in the fall without better control of the virus.
- The analyst has gained a wide following on Wall Street for his success in predicting the course of the pandemic and government responses.
- Harrison previously projected a “second wave” in the fall with daily new cases between 40,000 and 50,000 nationwide.
- However, the recent hot spots — Arizona, Texas, Florida and California — have shown a high rate of infection, which led the analyst to adjust to a more pessimistic view on the pandemic.

The spread of the coronavirus could be elevated this fall with as many as 150,000 daily cases in the U.S., according to Morgan Stanley’s biotechnology analyst, Matthew Harrison.
“We update our scenarios to account for the higher sustained infection rate,” Harrison said in a note Thursday. “Our bull [most optimistic] case reflects similar virus control to Europe while our base [most likely] case assumes a near-term plateau followed by increased spread in the fall. [About] 150,000 daily new cases are possible without better control of the virus.”
Harrison previously projected a “second wave” in the autumn with daily new cases totaling between 40,000 and 50,000 nationwide. However, the recent emergence of hot spots — Arizona, Texas, Florida and California — has reflected a high rate of infection, which led the analyst to adjust to a more pessimistic view on the pandemic.
The analyst has gained a wide following on Wall Street for his success in predicting the course of the pandemic and government responses. For example, in April, Harrison warned that the reopening of the U.S. economy would be a slow and tedious process.
“Our assumption of a growing reproduction number, and consequently increasing daily cases, throughout the rest of the year is based on the fact that traditionally the spread of viruses is elevated in the fall compared to the summer primarily due to more people in enclosed spaces,” Harrison said.
A recent resurgence in new cases has forced a number of states to roll back their reopening plans, which weighed on the stock market that rallied massively in the second quarter on hopes for a fast economic recovery.
Texas and Florida hit grim records earlier this week for daily coronavirus deaths based on a seven-day moving average.The virus has infected an average of 66,805 people per day in the U.S. over the past seven days, up more than 7% compared with a week ago, according to a CNBC analysis of data compiled by Johns Hopkins University.
On Wednesday, California reported a record spike in daily infections and passed New York as the U.S. state with the most confirmed infections since the pandemic began.
To be sure, Harrison said his projection doesn’t take into account any pharmacological intervention such as vaccines or strict lockdown measures that could potentially dampen the infection rate.
There has been a slew of positive news on the vaccine front this week. The U.S. agreed to pay drugmaker Pfizer and German partner BioNTech nearly $2 billion for 100 million coronavirus vaccines if their candidate proves both safe and effective.
Meanwhile, another vaccine candidate from Oxford University and AstraZeneca showed a positive immune response in an early trial. Earlier this week, British pharmaceutical company Synairgen claimed that its new respiratory coronavirus treatment has reduced the number of hospitalized Covid-19 patients needing intensive care in a clinical trial.
Goldman Sachs biotech analyst Salveen Richter said the Covid-19 vaccine market will be similar to the flu vaccine market, which requires an annual or periodic vaccination. The analyst also cited data showing the global vaccine market will grow to at least $40 billion in 2023 from $35 billion in 2018.
Fauci on coronavirus: ‘I don’t really see us eradicating it’
Anthony Fauci, the nation’s top infectious diseases expert, said Wednesday he doesn’t think COVID-19 will ever be fully eradicated but noted it can be controlled.
“I don’t see this disappearing the way SARS 1 did,” Fauci said during a livestreamed event hosted by the TB Alliance, a nonprofit focused on finding better tuberculosis treatments.
The SARS outbreak that started in 2003 lasted several months and mostly affected Asian countries before eventually vanishing. But in the process the disease sickened more than 8,000 people in 29 countries and claimed 774 lives.
Because COVID-19 is more contagious, it has had a far greater impact, with more than 15 million cases worldwide, including 618,000 deaths.
“It is so efficient in its ability to transmit from human to human that I think we ultimately will get control of it. I don’t really see us eradicating it,” Fauci said.
President Trump has repeatedly said the virus will eventually disappear, even though that is rare for most infectious diseases.
Fauci, who is a member of the White House coronavirus task force, recently responded to Trump’s characterization of him as “a little bit of an alarmist” on the pandemic by saying he prefers to think of himself as “a realist.”
During Wednesday’s interview, Fauci described ways that the U.S. can get the coronavirus under control.
“I think with a good combination of good public health measures, a degree of global herd immunity and a good vaccine, which I do hope and feel cautiously optimistic we will get, I think when you put all three of those together we will get very good control of this. Whether it’s this year or next year, I’m not certain,” he added.
“We’ll bring it down to such a low level that we will not be in the position we are right now for an extended period of time.”
New unemployment insurance claims rise for the first time since March

Some 1.4 million workers filed for unemployment last week, the first increase in months, as the pandemic continues to weigh on the labor market
“What you’re seeing is that, as the economy slows, the pace of claims picks back up — which really puts at risk the monthly jobs report over the next few months,” said Joseph Brusuelas, the chief economist at RSM. “The July numbers are going to be tenuous, but it’s August that I’m worried about.”
The number of workers continually claiming unemployment insurance went down, however, a statistic that lags by a week, to 16.1 million workers for the week ending July 11, from 17.4 million for the week ending July 4.
In addition to the 1.4 million seeking unemployment nationwide last week, another 980,000 new Pandemic Unemployment Assistance claims were filed, the benefits offered to self-employed and gig workers.
The numbers come as millions of unemployed workers are about to exhaust stimulus payments from two federal benefits programs whose expiration economists have warned could have dire effects on the economy.
Brusuelas said the numbers are a sign that the burst of economic activity that marked the country’s reopening has waned, and that shrinking consumer demand remained a significant risk for businesses and the workers they employ across the country.
“We are going to see a much slower pace of growth the reset of the year,” he said. “While we still are retaining our call for a swoosh-shaped recovery, one has to acknowledge a w-shaped recovery is possible.”
The extra $600 a week in unemployment benefits that the federal government has offered to supplement more modest state unemployment benefits will end this week, as lawmakers wrangle over legislation that could extend it.
Including the new benefits available to gig workers and the self-employed, more than 53 million applications have been filed for some form of unemployment insurance during the pandemic.
Coronavirus numbers confusing you? Here’s how to make sense of them
Turn on the TV news, or look at a news website, and you’ll see charts, graphics, and dashboards that supposedly indicate the latest with COVID-19 – statistics revealing the number of tests, cases, hospitalizations and deaths, along with where they happened and whether they are rising or falling.
Different stories are told depending on the dashboard. But one thing is certain: These indicators lag behind the actions we take, or don’t take, on COVID-19. As researchers who focus on public health, we can tell you that a fully accurate, real-time snapshot of the progress of the virus isn’t possible.
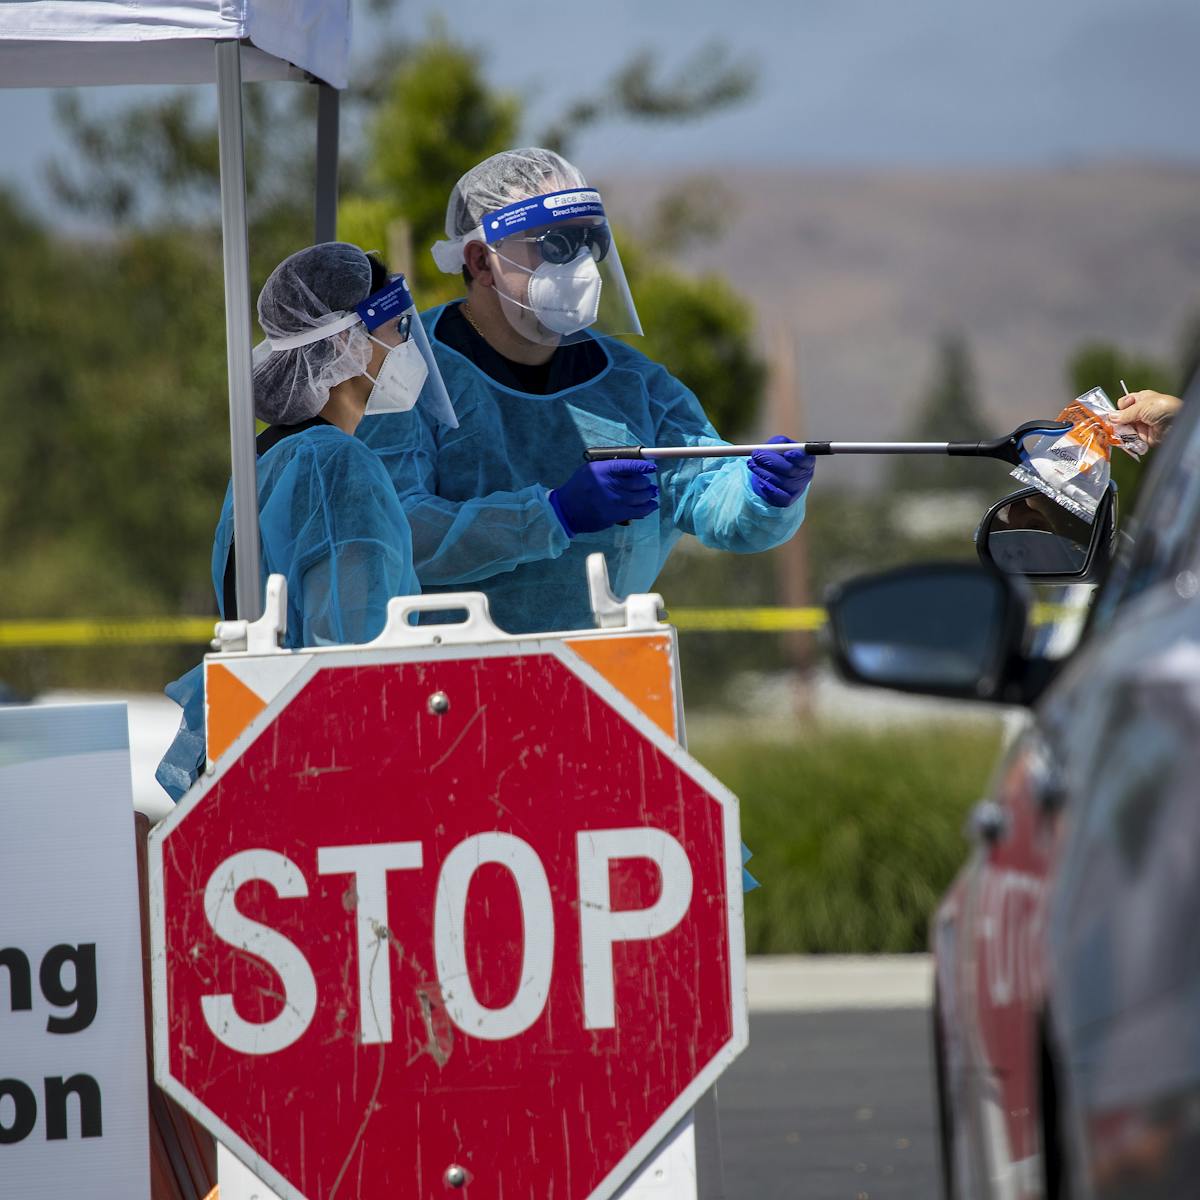
Some don’t get tested
There are many reasons for this. Here’s one: diagnostic testing data are incomplete. Someone infected with COVID-19 must first come in contact with the virus either through the air or (less likely) environmental surfaces. Symptoms show between two and 14 days later. But at least 40% of those infected will never manifest symptoms, or show such mild ones they don’t even suspect they have COVID-19. So they may never get tested, which means they won’t show up in the total number of tests, or the total number of cases.
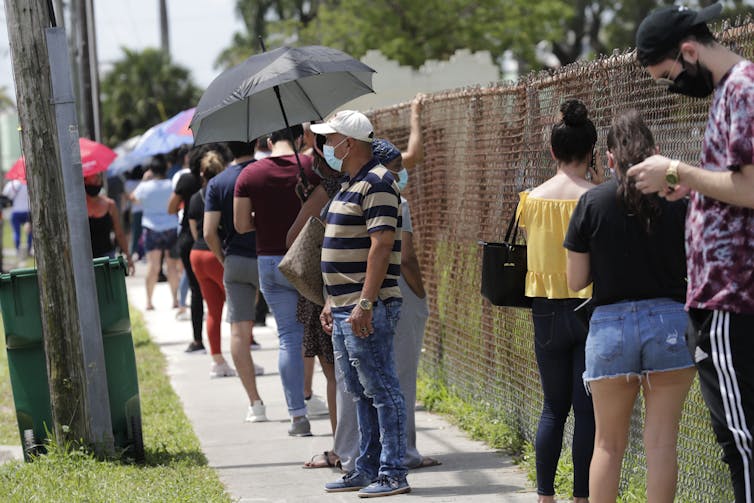
Another example: because of the lack of testing availability – a widespread problem in the U.S. since the start of the pandemic – not everyone who should be tested gets a test.
And another: the tests themselves are not perfect. Up to one-third who get a negative result may actually be infected. This happens because they are tested before they have a viral load sufficient enough for detection. Or maybe the sampling is not adequate. Or perhaps the test itself simply failed.
Case numbers don’t tell the full story
This is why problems arise when we use case numbers to determine disease levels in a community. Case counts actually reflect what was happening in a community weeks earlier. Four weeks, for instance, could elapse between the time a person is exposed to the virus and when they are reported as a case. Even the best testing results often take a week to report to public health authorities, and longer to appear on dashboards. Some testing results, seriously delayed, may take ten days or more.
Other factors impact the metrics. Laboratory results, often released in batches, may introduce artificial variation in case numbers. Someone who tested two days ago, then got a result back immediately, might be added on the same day as someone who was sick two weeks ago, but whose test results were delayed. To smooth out these variations, it helps to look at a rolling seven-day case average.
Hospitalization is a clearer metric for assessing the level of community disease. Those who are seriously ill, in most cases, will be hospitalized whether previously tested or not. Data suggests roughly one in five infected persons are hospitalized. Individuals seem to do okay for the first week, with more life-threatening symptoms showing in the second. That means hospitalizations represent exposures that happened three or four weeks earlier.
Again, a seven-day rolling average evens out artificial variations. There is one caveat for this: Though hospitalization is a useful metric, only about 20% of infected people need it. That means hospitalization numbers alone underestimate the number of people infected and what age groups they represent.
States vary on cause of death
The death numbers are not a reliable indicator either. In some states, to count as a COVID-19 death, the deceased must have had a test reporting positive. In other states, probable cases are reported.
As clinicians learn how to better treat COVID-19, fatality rates are dropping. Deaths, the longest lagging indicator, reflect people who were infected six or eight weeks earlier. When comparing one region to another, deaths are best expressed as rates – a ratio of deaths to population.
Another issue: News reports do not always clearly distinguish between diagnostic testing, which shows if you currently have COVID-19, and antibody testing, which shows if you had it in the past, and now harbor antibodies that can fight it. So far, however, antibody testing has not provided a useful picture of who has been infected and who has not. Once that happens, it could provide researchers and clinicians with some indicators on how widely the virus has spread.
Though the dashboards are ubiquitous on television, none of these frequently used indicators they feature is perfect. Still, taken together, they provide a reasonable approximation of COVID-19 transmission in communities. But as authorities make decisions, they should take into account the numbers are weeks old.
What does this mean to you? Understanding these limitations may help you understand your risk. We are still in the midst of a pandemic that is not under control. Being educated will help all of us from becoming a part of tomorrow’s lagging indicators.
Former Fed Chairs Bernanke and Yellen testified on COVID-19 and response to economic crisis
In many respects this recession is unique. Most recessions result from developments inside the economy, but an external shock—the public health crisis—caused this one. To avoid getting sick, people have curtailed working, shopping, and attending school. Whatever the cause, the coronavirus recession, like all recessions, is imposing heavy costs. Many workers have lost jobs and income, and many business owners’ financial survival is at risk. The economy’s extraordinarily rapid decline earlier this year—as well as the sharp but incomplete rebound following the first steps toward reopening—reflect this recession’s unusual source. In addition, the sectors suffering most differ from past recessions. The heaviest blows have fallen on service industries that involve close personal contact (including retail trade, leisure and hospitality, and transportation) rather than, as is more typical, on the housing, capital investment, and durable goods sectors. Lower-paid workers, as well as women and minorities, are over-represented in the most-affected sectors, and thus have borne a disproportionate share of the job and income losses. And, the virus has affected almost every country, with potentially devastating consequences for trade and international investment.
Because this recession is unprecedented in so many ways, forecasting the recovery is difficult. The course of the pandemic itself is by far the most important factor. As long as people fear catching a potentially deadly illness from other people, they will be cautious about resuming normal activities, even after state and local governments lift lockdowns. Thus, controlling the spread of the virus must be the first priority for restoring more-normal levels of economic activity—but, more importantly, for saving possibly tens of thousands of lives. Members of Congress, local leaders, and other policymakers need to do all they can to support testing and contact tracing, medical research, and sufficient hospital capacity, and they must work to ensure that businesses, schools, and public transportation have what they need to operate safely. Both authors of this testimony are serving on state re-opening commissions, which has provided us insight into the substantial challenges to safe re-opening.
If the pandemic comes under better control, economic recovery should follow. However, the pace of the recovery could be slow and uneven, for several reasons. First, in the face of ongoing uncertainty, households and businesses may remain cautious for a time. They may increase saving and reduce spending, hiring, and capital investment. The longer the recession lasts, the greater the damage it will inflict on household and business balance sheets and the longer it will take to repair the damage. Second, the depth of the recession may leave scars—business closures and the deterioration of unemployed workers’ skills—that will affect growth for several years. Third, depending on the course of the virus, some restructuring of the economy may be needed. For example, people and resources will need to be redeployed out of the sectors most damaged by the pandemic, and business operations will need to be reorganized to protect workers and customers. All of that will take time and money. Fiscal and monetary policies must aim to speed the recovery and minimize the recession’s lasting effects.
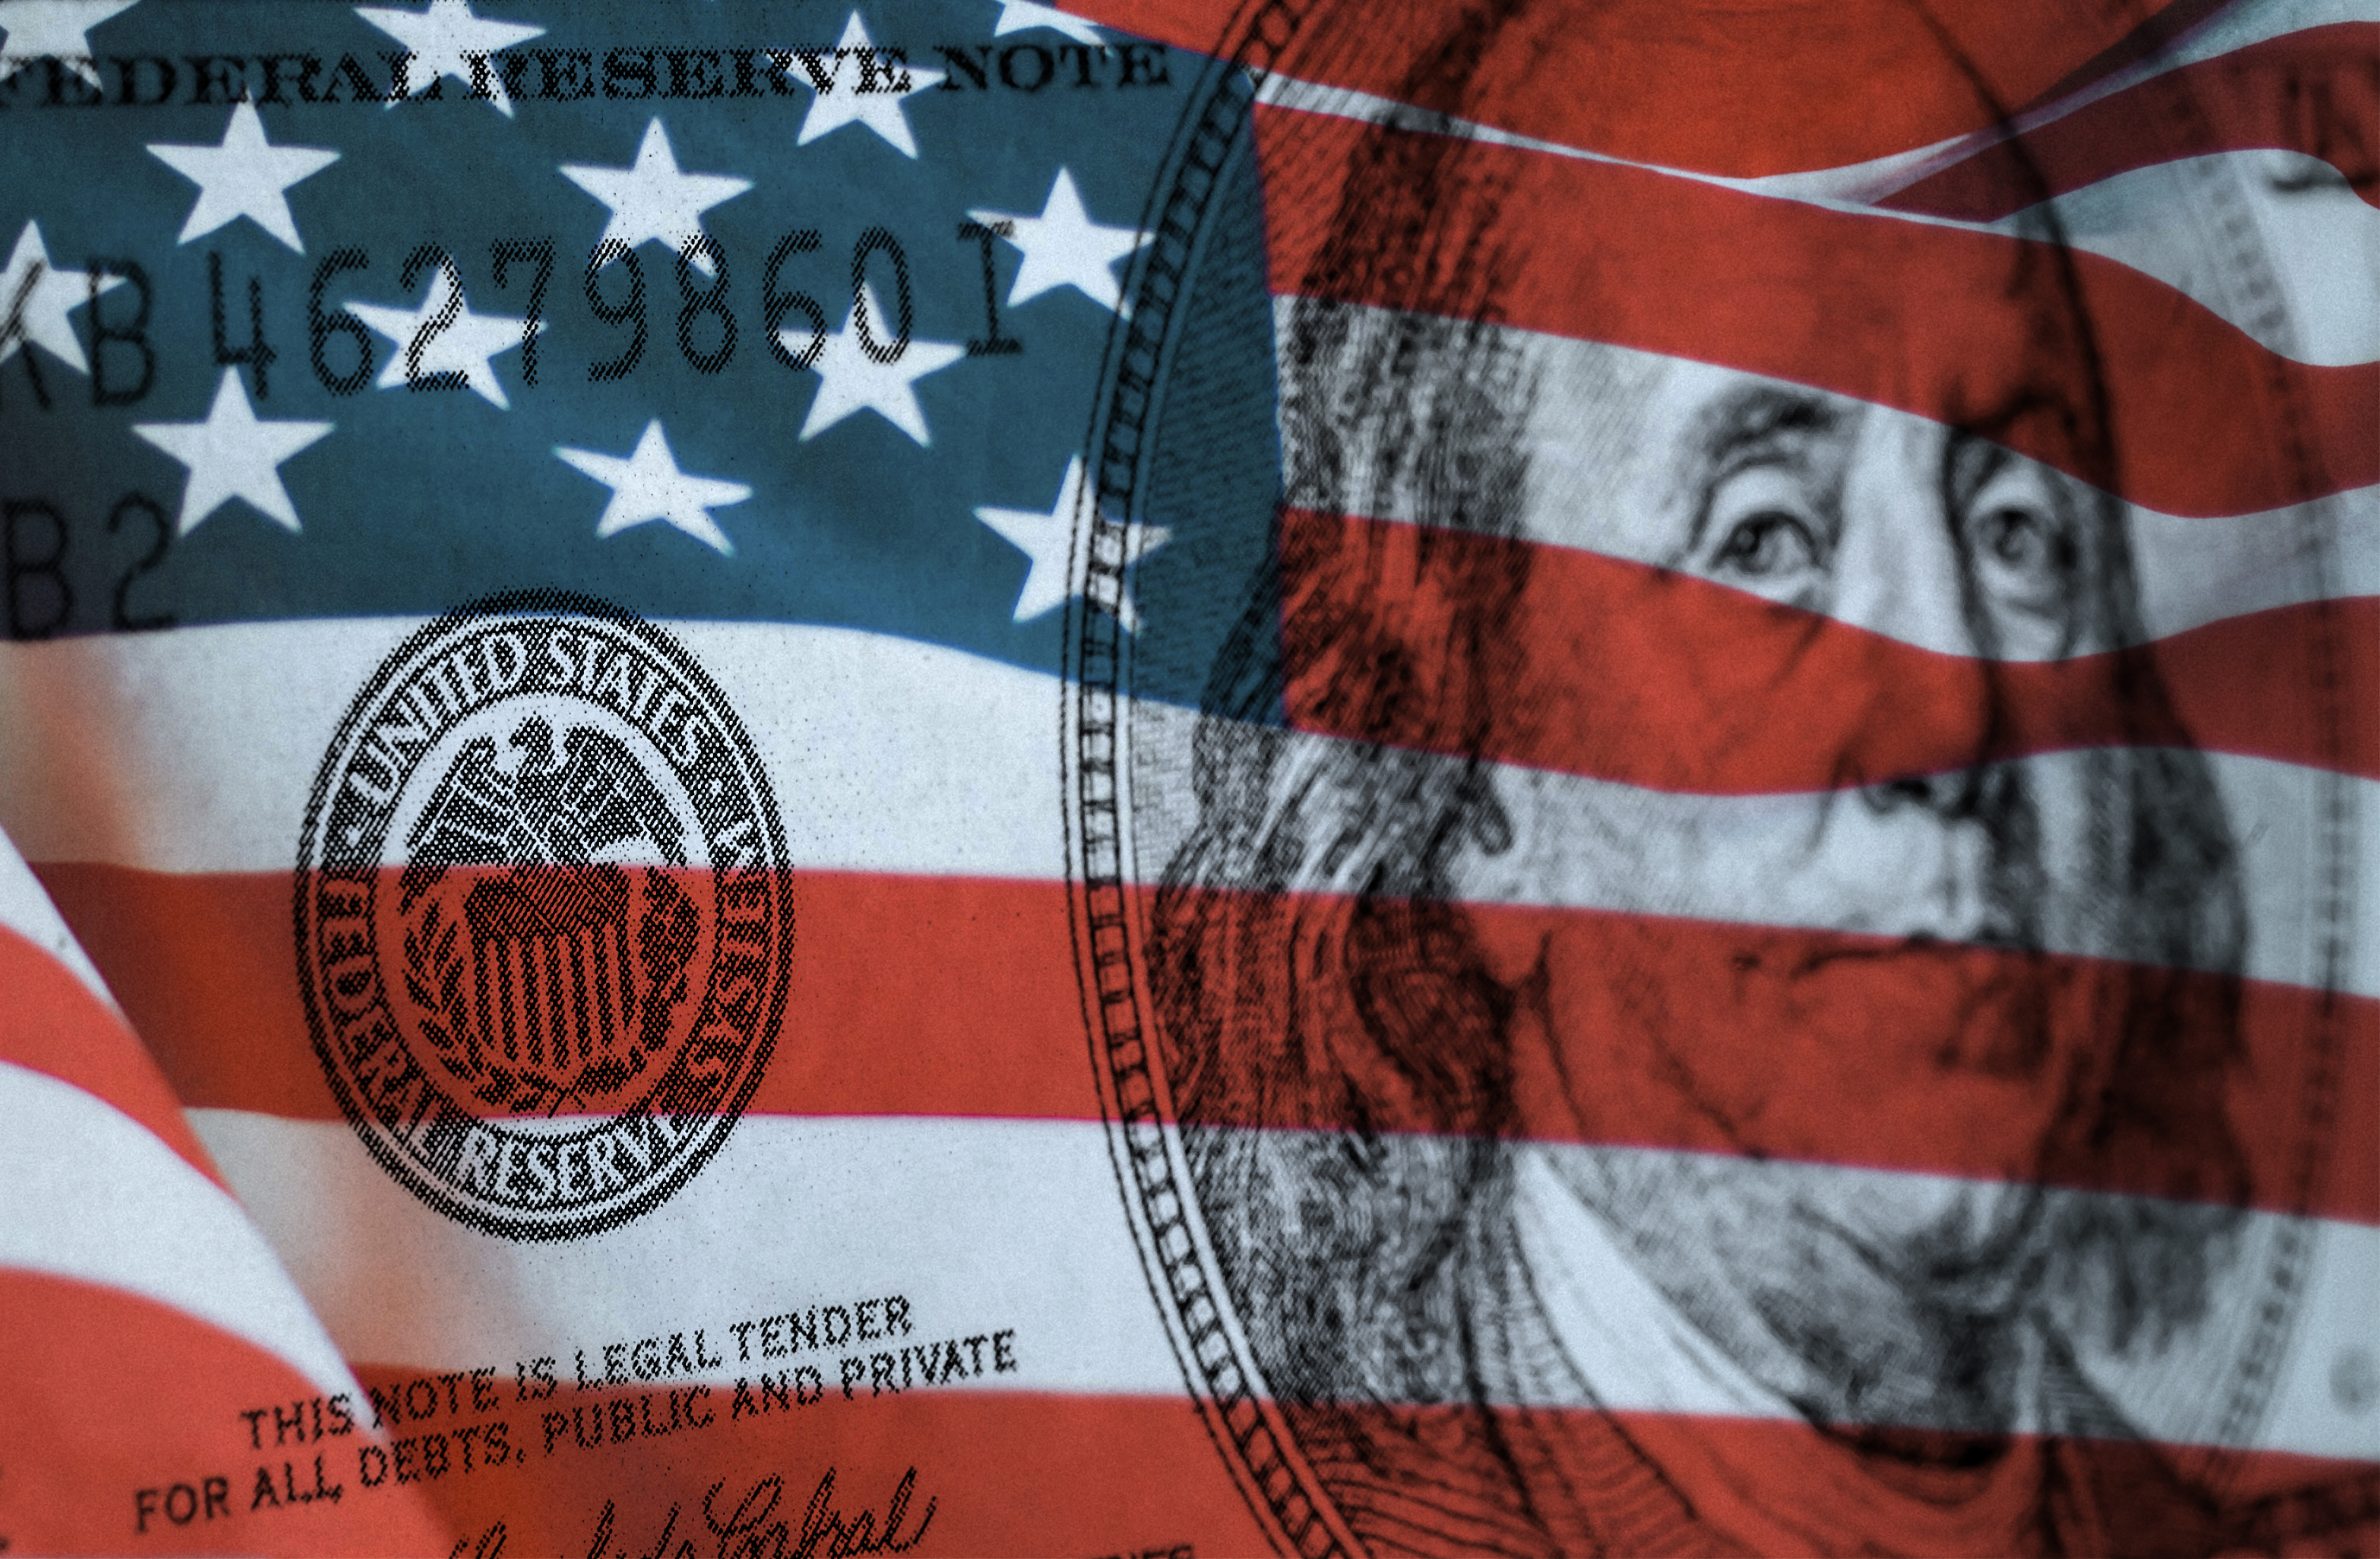
ACTIONS BY THE FEDERAL RESERVE
The Federal Reserve has moved swiftly and forcefully in this crisis. It eased monetary policy in March by lowering the federal funds rate, the overnight interest rate on loans between banks, nearly to zero and indicating that it plans to keep rates low for several years. Low interest rates probably had limited economic benefits in the spring. Lockdowns prevented people from spending or working more. However, we expect low rates will spur spending in sectors like housing as the economy reopens. And the Fed may well do more in coming months as re-opening proceeds and as the outlook for inflation, jobs, and growth becomes somewhat clearer. In particular, to maintain downward pressure on longer-term interest rates, the Federal Open Market Committee (FOMC) likely will provide forward guidance about the economic conditions it would need to see before it considers raising its overnight target rate. And it likely will clarify its plans for further securities purchases (quantitative easing). It is possible, though not certain, that the FOMC will also implement yield-curve control by targeting medium-term interest rates. It could, for example, target two-year rates by announcing its willingness to buy two-year Treasury notes at a fixed yield. The completion of the Fed’s internal review of its tools and framework in coming months will help guide these decisions.
The Fed also has been active beyond monetary policy.
First, the Fed has served as market maker of last resort by acting to stabilize critical financial markets when capital or other regulatory constraints have interfered with normal market-making or arbitrage. The Fed has served this role for repurchase agreements (repos) since September, when intermittent liquidity shortages led to spikes in repo rates. Banks did not provide liquidity to offset these spikes, as they normally would, citing balance sheet limits and other constraints. Because repo markets are critical to the functioning of broader financial and credit markets, as well as for the transmission of monetary policy, the Fed has restored more-normal function in repo markets by conducting large-scale repo operations and by steadily increasing the quantity of reserves in the banking system.
An even larger shock occurred in March, when uncertainty about the pandemic led hedge funds and others to scramble to raise cash by selling longer-term securities. The upsurge in the supply of longer-term securities, including Treasuries, was more than dealers and other market-makers could handle. Key financial markets, including for Treasury securities, experienced substantial volatility. To stabilize these markets, which like the repo market play a critical role in our financial system, the Fed purchased large quantities of Treasuries and mortgage-backed securities, again serving as market maker of last resort. It also set up a new repo facility to allow foreign official institutions to borrow dollars, using their Treasury reserves as collateral, thus avoiding the need to sell those Treasuries. Although risk and liquidity premiums in these key markets have returned closer to normal, at some point the Fed and the Treasury will need to review why the market-making facilities in place before the pandemic hit did not work more efficiently.
Second, the Fed has served as lender of last resort to the financial system, a classic function of central banks. Banks and other financial intermediaries typically borrow short and lend long—that is, they rely heavily on short-term funding to finance long-term loans and investments. If they lose their short-term funding—because their funders lose confidence or for other reasons—they can be forced to sell their assets in fire sales, restrict credit to customers, and, in extreme cases, become insolvent. Central banks can short-circuit that dangerous dynamic by lending to financial institutions against good collateral, replacing the lost liquidity. In the 2007-2009 crisis, which centered on the financial system and included a global financial panic, the Fed as lender of last resort took many actions to provide liquidity to financial institutions, with the goal of stabilizing the system and preserving the flow of credit to the economy.
Fortunately, the financial system is in much better shape today than in was during the financial crisis. Banks in particular are strong, with much higher levels of capital and liquidity. The Fed nevertheless has once again taken steps to ensure that the financial system has sufficient liquidity. Largely replicating our playbook from the crisis era, the Fed has eased terms on the discount window (which provides short-term loans to banks); re-established the Primary Dealer Credit Facility (which lends to broker-dealers); and established a facility that lends indirectly to money market mutual funds, ensuring that the funds can meet depositor withdrawals. In a novel step, the Fed also created a facility that lends to banks, without recourse, against Payroll Protection Program loans, ensuring that banks have sufficient funds to make those loans.
Under the heading of lender of last resort to the financial system, establishing currency swap lines with fourteen foreign central banks was one of the most important actions the Fed took in the 2007-2009 crisis. The Fed has revived this program. Currency swap lines allow foreign central banks (who assume all the credit risk) to lend dollars to banks in their jurisdictions. The broad availability of dollar liquidity is essential because most global banks do substantial borrowing and lending in dollars, including lending within the United States. The swap lines sustain the flow of dollar credit and reduce volatility in dollar-based markets, to the benefit of the U.S. economy.
Third, the Federal Reserve, with the support of the Congress and the Treasury, has also served during the current crisis as a lender of last resort to the non-financial sector, backstopping key credit markets facing the prospect of severe disruption from the pandemic. To take on this role, the Fed invoked its emergency lending powers under Section 13(3) of the Federal Reserve Act. Since those powers require that the Fed’s lending be well secured, it has had to rely on funds appropriated by the Congress and allocated by the Treasury to cover possible losses. Using these authorities, the Fed revived financial crisis-era facilities to stabilize commercial paper and asset-backed securities markets. Going beyond the financial crisis playbook, the Fed has also added new facilities to lend to corporations and state and local governments and to buy outstanding corporate bonds.
These programs have not extended much credit, so far, but that does not mean they have not succeeded. By establishing the programs, the Fed gave private investors the confidence to re-engage by reassuring them that the government would not allow these critical markets to become dysfunctional. Indeed, the corporate and municipal bond markets largely stabilized after the announcements, before any loans were made. Of course, if these markets seize up again, the Fed’s programs can extend credit.
The Fed also established the Main Street Lending Program to lend (through banks) to medium-sized companies. It is too soon, however, to judge its performance. This program is very different from anything the Fed has attempted before and poses difficult technical challenges. Although the Fed took many public comments while setting up the program, and made substantial changes, questions remain about how many banks and borrowers will participate. The Fed and Treasury may have to further ease terms for borrowers and increase incentives for banks for this program to have the desired effect. Or, the Fed and Treasury could add a new facility, along the lines of funding-for-lending programs run by the Bank of England and the European Central Bank, that simply subsidize banks for making additional loans to qualifying borrowers (for example, businesses below a certain size). That approach leaves the underwriting decision completely with the banks, while the size of the subsidy can be adjusted as needed to achieve the desired level of lending.
Finally, the Fed has also taken actions as a bank regulator—for example, encouraging banks to work with borrowers hobbled by the pandemic. It decided recently, based on stress test results, to bar stock buybacks by banks and to limit—but not eliminate—their dividends. Based on our experience in the global financial crisis, we think the Fed may find it needs to go further. Although banks are currently strong, it is possible the pandemic will so damage the economy that credit losses mount rapidly. For a successful recovery, the banking system must remain strong and able to lend.
Is there more the Fed could do? As we noted, the Fed likely will provide more clarity about its monetary policy plans, and it may need to adjust the terms or borrower eligibility requirements of its various lending facilities. Broadly speaking, though, the Fed’s response has been forceful, forward-looking, and comprehensive. But, as Chair Powell often notes, the Fed’s authorities allow it to lend, not spend. Some households and firms will need subsidies or grants, rather than loans, and spending is, of course, the province of the Congress.
WHAT FISCAL POLICY MIGHT DO
The fiscal response to the pandemic has thus far been quite effective. Enhanced unemployment insurance and the Paycheck Protection Program have helped unemployed workers and their families, together with many businesses, survive the spring shutdowns. The fiscal support for the Fed’s lending programs likely will help preserve credit availability, possibly with only a portion of the allocated funds being spent.
However, some programs authorized by the Congress are ending, and new actions are necessary. Our recommendations for further fiscal action are:
First, Congress should develop a comprehensive plan to support medical research; increase testing, contact tracing and hospital capacity; make available critical supplies; and support state and local efforts to safely open businesses, schools, and public transportation.
Nothing is more important for restoring economic growth than improving public health. Investments in this area are likely to pay off many times over.

How deadly is COVID-19? A biostatistician explores the question
The latest statistics, as of July 10, show COVID-19-related deaths in U.S. are just under 1,000 per day nationally, which is down from a peak average of about 2,000 deaths per day in April. However, cases are once again rising very substantially, which is worrisome as it may indicate that substantial increases in COVID-19 deaths could follow. How do these numbers compare to deaths of other causes? Ron Fricker, statistician and disease surveillance expert from Virginia Tech, explains how to understand the magnitude of deaths from COVID-19.
As a disease surveillance expert, what are some of the tools you have to understand the deaths caused by a disease?
Disease surveillance is the process by which we try to understand the incidence and prevalence of diseases across the country, often with the particular goal of looking for increases in disease incidence. The challenge is separating signal from noise, by which I mean trying to discern an increase in disease incidence (the signal) from the day-to-day fluctuations in that disease (the noise). The hope is to identify any increase as quickly as possible so that medical and public health professionals can intervene and try to mitigate the disease’s effects on the population.
A critical tool in this effort is data. Often disease data is collected and aggregated by local and state public health departments and the Centers for Disease Control and Prevention from data that is reported by doctors and medical facilities. Surveillance systems then use this data and a variety of algorithms to attempt to find a signal amidst the noise.
Early on, many people pointed out that the flu has tens of thousands of deaths a year, and so COVID-19 didn’t seem so bad. What’s wrong with that comparison?
The CDC estimates the average number of flu-related deaths since 2010-11 is around 36,000 per year. This varies from a low of 12,000 deaths in 2011-12 to a high of 61,000 deaths in 2017-18. Thus, the number of COVID-19 deaths to date is three to four times greater than the annual average number of flu-related deaths over the past decade; it is 10 times larger when compared to the 2010-11 flu season but only about twice as large compared to 2017-18.
To make this a fair comparison, note that seasonal influenza mostly occurs over a few months, usually in late fall or early winter. So, the time periods are roughly comparable, with most of the COVID-19-related deaths occurring since late March. However, COVID-19 does not appear to be seasonal, and fatalities are a lagging measure because the time from infection to death is weeks if not months in duration, so the multiples in the previous paragraph will be greater by the end of the year.
Furthermore, while death rates have been coming down from a peak of more than 2,700 on April 21, 2020, the United States is now averaging just under 1,000 deaths per day as of July 10, and given the dramatic increase in cases of late, we should expect the fatality rate to further rise. For example, the University of Washington’s IHME model currently predicts slightly more than 208,000 COVID-19-related deaths by November 1.
So, by any comparison, the COVID-19 death rate is significantly higher than the seasonal influenza death rate.
What are some comparisons that could provide some context in understanding the scale of deaths caused by COVID-19?
As of this writing, more than 130,000 people have died of COVID-19, and that total could grow to 200,000 or more by fall. Those numbers are so big, they’re hard to grasp.
Michigan Stadium in Ann Arbor is the largest football stadium in the United States. It holds 107,420 people, so no football stadium in the country is large enough to hold everyone who has died from COVID-19 thus far. By the time bowl season comes along, assuming we have a football season this year, the number of COVID-19 fatalities will likely exceed the capacity of the Rose and Cotton bowl stadiums combined.
The state of Wyoming has a population of slightly less than 600,000 people, so it’s the equivalent of one out of every five people in that state dying in the last four months. By this fall, the COVID-19 death total will be the equivalent of fully one-third of the people in Wyoming dying.
The populations of Grand Rapids, Michigan; Huntsville, Alabama; and Salt Lake City, Utah are each just over 200,000 people. Imagine if everyone in one of those cities died over the course of six months. That’s what COVID-19 may look like by fall.
How do COVID-19 deaths compare to chronic diseases like cancer or heart disease?
Today, COVID-19 ranks as the sixth leading cause of death in the United States, following heart disease, cancer, accidents, lower chronic respiratory diseases and stroke. Heart disease is the leading cause, with just over 647,000 Americans dying from it each year. Alzheimer’s disease, formerly the sixth largest cause of death, kills just over 121,000 people per year. If the University of Washington IHME model’s current prediction of COVID-19-related deaths comes to pass, COVID-19 will be the third leading cause of death in the United States by the end of the year.
The American Cancer Society estimates that in 2020 there will be an estimated 1.8 million new cancer cases diagnosed and 606,520 cancer deaths in the United States. Lung cancer is estimated to kill about 135,000 people in the US in 2020, so the number of COVID-19 deaths is currently equivalent and will exceed it soon. Of course, it is important to note that the COVID-19 deaths have occurred in about the past four months while the number of lung cancer deaths is for a year. So, COVID-19 deaths are occurring at roughly three times the rate of lung cancer deaths.
What are some historical comparisons that you think are useful in understanding the scale of deaths from COVID-19?
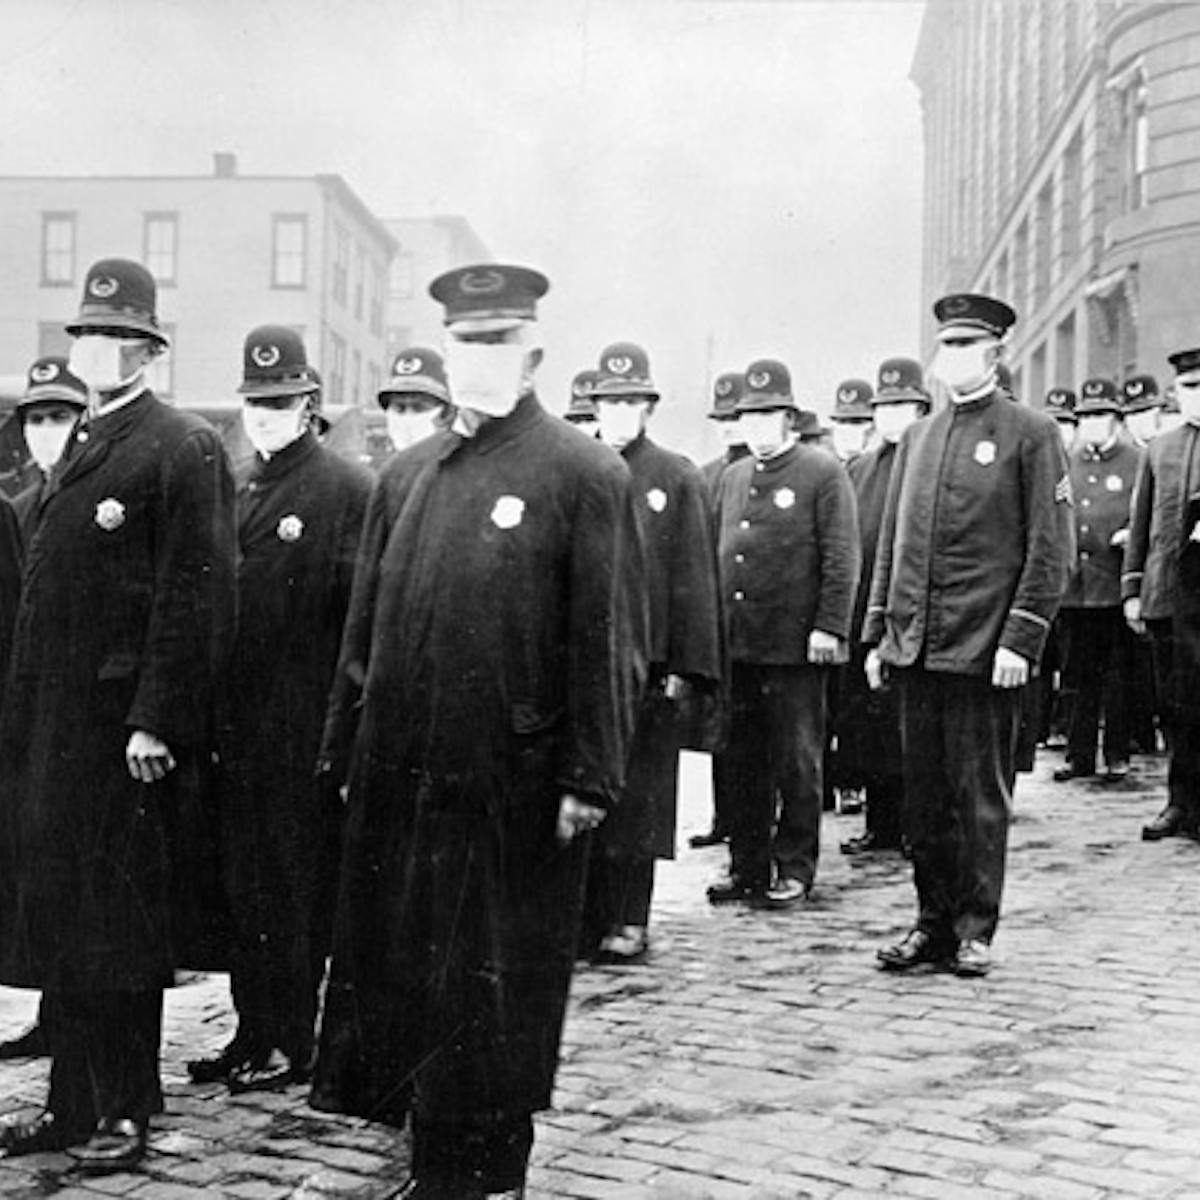
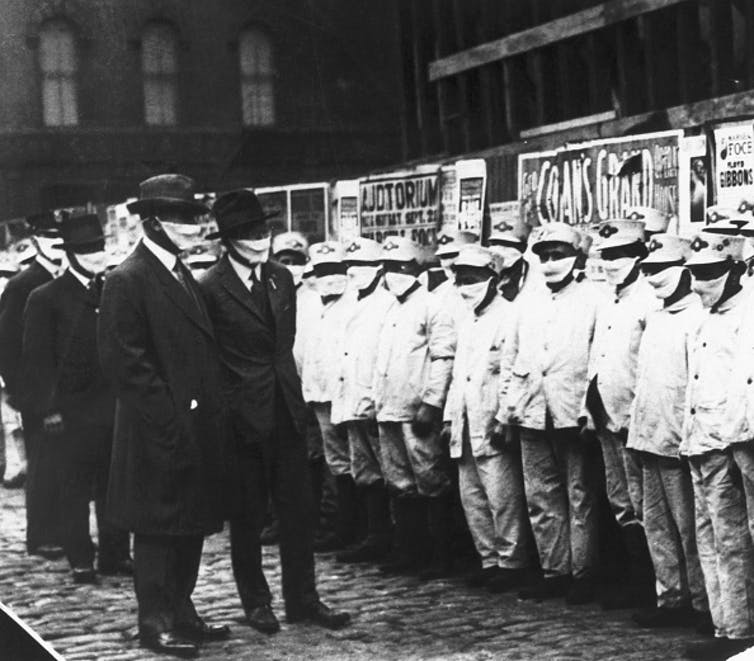
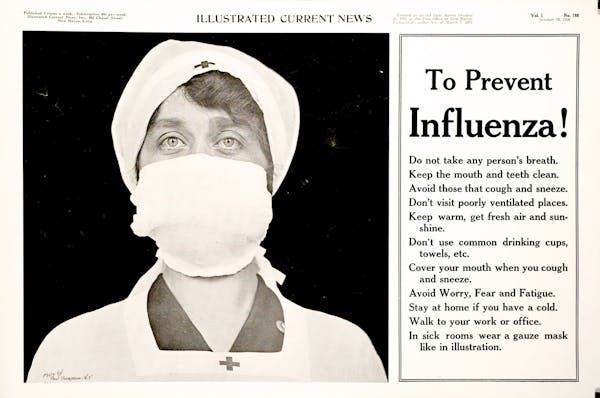
The 1918 influenza pandemic was similar in some ways to the current pandemic and different in other ways. One key difference is the age distribution of deaths, where COVID-19 is concentrated among older adults while the the 1918 pandemic affected all ages. In my state of Virginia, only 8% of the people who died in the 1918 pandemic were more than 50 years old, compared to more than 97% for COVID-19.
The CDC estimates that the 1918 pandemic resulted in about 675,000 deaths in the United States, so slightly more than five times the current number of COVID-19 deaths. In October of 1918, the worst month for the influenza pandemic, about 195,000 people died – well more than all who have died so far from COVID-19.
As with any historical comparison, there are important qualifiers. In this case, the influenza pandemic started in early 1918 and continued well into 1919, whereas COVID-19 deaths are for about one-third of a year (March through June). However, today the United States’ population is about three times the size of the population in 1918. These two factors roughly “cancel out,” and so it is reasonable to think about the 1918 epidemic being about five times worse than COVID-19, at least thus far.
In comparison to past wars, the U.S. has now had more deaths from COVID-19 than all the combat-related deaths in all the wars since the Korean War, including the Vietnam War and Operations Desert Shield and Desert Storm. In World War II there were 291,557 combat casualties. So the number of people who have died from COVID-19 thus far is about 45% of the WWII combat casualties. By the fall, it could be more than 70%.
Finally, note that the number of confirmed and probable deaths from COVID-19 in New York City (23,247 on July 10, 2020) is more than eight times the number who died in the 9/11 attack (2,753).