Prioritizing outcomes in healthcare is long overdue and now within reach following Oracle’s acquisition of Cerner. To achieve more seamless, coordinated care, technology must play a greater role in reframing solutions for health and well-being around the world.
Combining Cerner’s clinical capabilities with Oracle’s enterprise platform, analytics, and automation expertise will change health and wellness in a way that simply hasn’t been possible before. We’ll provide secure and reliable solutions that deliver health insights and experiences to dramatically change how health is managed by patients, providers, and payors. The industry has never been riper for change.
Designing for people
Healthcare is innately personal; however, the industry often loses sight of the human side of health as delivering and understanding care has become increasingly disconnected and complex. Research reveals that doctors spend nearly twice as much time on administrative work as they do engaging with patients. If we replaced clinicians’ time spent performing administrative tasks with patient interactions, imagine how dramatically we could improve quality of care. Technology-induced administrative burden contributes to burnout, which has, in part, resulted in a workforce shortage and overshadowed the true benefits of healthcare technology. Clinicians didn’t enter medicine to spend half of their time conducting routine tasks and completing required documentation; they chose their profession to practice at the top of their license. We’re working to make this a reality, providing a toolset that supports clinical decision making and prioritizes the user experience.
For care delivery organizations, we’ll develop new cloud-enabled capabilities allowing providers to access the information they need, where and when they need it, on an interface that is easy to use. This will significantly reduce the time and effort required to find a patient’s information, even if the information is scattered across different providers or care settings. We’ll help people access and manage their own health information from wherever they are, so that they have a stronger voice in their care and can conduct more meaningful conversations with their providers. When successful, these improvements ultimately increase the value of healthcare and have the additional benefit of contributing data to population health insights.
Collaborative, interoperable care
In a complex and inefficient healthcare industry, interoperability is critical; but, it hasn’t been widely adopted between organizations. From the patient perspective, data silos limit patients’ empowerment and involvement in their health and well-being. It is vitally important that medical records are portable. Regardless of where someone receives care, their records should be accessible and unified. From a clinical perspective, interoperability ensures clinicians can properly review a patient’s entire medical history within their workflow and provide appropriate, contextual treatment.
A recent survey shows a staggering 97% of healthcare executives have called for increased healthcare data interoperability, the lack of which inhibits digital transformation and innovation within organizations and throughout the broader industry. Oracle is committed to open APIs to ensure any authorized user can consume health data and insights. We know a closed system will not create connectivity and unification across the many existing players and systems. Creating more solutions without an open ecosystem commitment would only contribute to the problems we see today with fractured and siloed systems.
Oracle will harness the power of data to create a collaborative ecosystem where people, patients, providers, and payors can securely access clinical, operational, and financial data on the cloud. These efforts will break down data silos and provide open systems that talk to—and connect with—one another to generate actionable, scalable, and global insights previously unavailable. Industry fragmentation impacts both patients and providers, but Oracle has the power to aggregate data into a single source of truth to achieve better outcomes.
Improved efficiency across the system
While enhanced clinical systems will improve experiences bedside and lead to better public health outcomes, back-office operations must also be improved to drive true efficiency, reduce costs, and make the business of healthcare more predictable. Oracle’s Fusion application suite can create this bridge between the bedside and the back-office, enhancing employee experience (better retention, less administration), streamlining the supply chain (reduced shrinkage, better inventory management), and giving the executive a better understanding of the issues impacting their business (greater predictability and cost control).
Secure healthcare data
Unfortunately, we know that retail, finance, and health data are the most targeted in security breaches. Patient privacy and the security of health data, when left unaddressed, threaten what the information of health exchange is solely meant to protect: patient safety. It’s time to raise health data security to an unprecedented level of investment and focus.
Oracle is an industry leader in securely storing, processing, and analyzing large volumes of cloud-based data. We’ll continue to apply the same security-obsessed focus to healthcare as we do to all industries, allowing people, patients, providers, and payors to safely access insights that improve care and advance decision-making. Oracle has been trusted with some of the world’s most sensitive and regulated data for more than 44 years. For the financial services industry specifically, Oracle already serves customers in more than 140 countries and manages risk for 24 of the world’s 28 systemically important financial institutions (SIFIs).
Meeting the moment
While we already knew this industry was ready for change, the pandemic amplified and accelerated the world’s readiness to see that change. We aim to meet this moment leveraging the technology and expertise that have revolutionized other industries, as well as applying new innovations to transform these systems of record into systems of intelligence.
Combining our existing healthcare industry solutions—from clinical trials to health insurance payor solutions to public health analysis systems—with our acquisition of Cerner, we believe Oracle has a uniquely positioned opportunity to offer new solutions to a broken healthcare system. We plan to support the entire lifecycle of healthcare, going beyond traditional health IT to integrate our infrastructure, platform, and applications capabilities for a more fully connected operational, administrative, and clinical system.
We are fully committed to the partnerships that will be instrumental to this journey. The technology and the world are ready for transformation. This is just the beginning.
An argument for humility in the face of pandemic forecasting unknown unknowns.
“Are we battling an unprecedented pandemic or panicking at a computer generated mirage?” I asked at the beginning of the COVID-19 pandemic on March 18, 2020. Back then the Imperial College London epidemiological model’s baseline scenario projected that with no changes in individual behaviors and no public health interventions, more than 80 percent of Americans would eventually be infected with novel coronavirus and about 2.2 million would die of the disease. This implies that 0.8 percent of those infected would die of the disease. This is about 8-times worse than the mortality rate from seasonal flu outbreaks.
Spooked by these dire projections, President Donald Trump issued on March 16 his Coronavirus Guidelines for America that urged Americans to “listen to and follow the directions of STATE AND LOCAL AUTHORITIES.” Among other things, Trump’s guidelines pressed people to “work or engage in schooling FROM HOME whenever possible” and “AVOID SOCIAL GATHERINGS in groups of more than 10 people.” The guidelines exhorted Americans to “AVOID DISCRETIONARY TRAVEL, shopping trips and social visits,” and that “in states with evidence of community transmission, bars, restaurants, food courts, gyms, and other indoor and outdoor venues where people congregate should be closed.”
Let’s take a moment to recognize just how blindly through the early stages of the pandemic we—definitely including our public health officials—were all flying at the time. The guidelines advised people to frequently wash their hands, disinfect surfaces, and avoid touching their faces. Basically, these were the sort of precautions typically recommended for influenza outbreaks. On July 9, 2020, an open letter from 239 researchers begged the World Health Organization and other public health authorities to recognize that COVID-19 was chiefly spread by airborne transmission rather than via droplets deposited on surfaces. The U.S. Centers for Disease Control and Prevention (CDC) didn’t update its guidance on COVID-19 airborne transmission until May 2021. And it turns out that touching surfaces is not a major mode of transmission for COVID-19.
The president’s guidelines also advised, “IF YOU FEEL SICK, stay home. Do not go to work.” This sensible advice, however, missed the fact that a huge proportion of COVID-19 viral transmission occurred from people without symptoms. That is, people who feel fine can still be infected and, unsuspectingly, pass along their virus to others. For example, one January 2021 study estimated that “59% of all transmission came from asymptomatic transmission, comprising 35% from presymptomatic individuals and 24% from individuals who never develop symptoms.”
The Imperial College London’s alarming projections did not go uncontested. A group of researchers led by Stanford University medical professor Jay Bhattacharya believed that COVID-19 infections were much more widespread than the reported cases indicated. If the Imperial College London’s hypothesis were true, Bhattacharya and his fellow researchers argued, that would mean that the mortality rate and projected deaths from the coronavirus would be much lower, making the pandemic much less menacing.
The researchers’ strategy was to blood test people in Santa Clara and Los Angeles Counties in California to see how many had already developed antibodies in response to coronavirus infections. Using those data, they then extrapolated what proportion of county residents had already been exposed to and recovered from the virus.
Bhattacharya and his colleagues preliminarily estimated that between 48,000 and 81,000 people had already been infected in Santa Clara County by early April, which would mean that COVID-19 infections were “50-85-fold more than the number of confirmed cases.” Based on these data the researchers calculated that toward the end of April “a hundred deaths out of 48,000-81,000 infections corresponds to an infection fatality rate of 0.12-0.2%.” As I optimistically reported at the time, that would imply that COVID-19’s lethality was not much different than for seasonal influenza.
Bhattacharya and his colleagues conducted a similar antibody survey in Los Angeles County. That study similarly asserted that COVID-19 infections were much more widespread than reported cases. The study estimated 2.8 to 5.6 percent of the residents of Los Angeles County had been infected by early April. That translates to approximately 221,000 to 442,000 adults in the county who have had the infection. “That estimate is 28 to 55 times higher than the 7,994 confirmed cases of COVID-19 reported to the county by the time of the study in early April,” noted the accompanying press release. “The number of COVID-related deaths in the county has now surpassed 600.” These estimates would imply a relatively low infection fatality rate of between 0.14 and 0.27 percent.
Unfortunately, from the vantage of 14 months, those hopeful results have not been borne out. Santa Clara County public health officials report that there have been 119,712 diagnosed cases of COVID-19 so far. If infections were really being underreported by 50-fold, that would suggest that roughly 6 million Santa Clara residents would by now have been infected by the coronavirus. The population of the county is just under 2 million. Alternatively, extrapolating a 50-fold undercount would imply that when 40,000 diagnosed cases were reported on July 11, 2020, all 2 million people living in Santa Clara County had been infected by that date.
Los Angeles County reports 1,247,742 diagnosed COVID-19 cases cumulatively. Again, if infections were really being underreported 28-fold, that would imply that roughly 35 million Angelenos out of a population of just over 10 million would have been infected with the virus by now. Again turning the 28-fold estimate on its head, that would imply that all 10 million Angelenos would have been infected when 360,000 cases had been diagnosed on November 21, 2020.
COVID-19 cases are, of course, being undercounted. Data scientist Youyang Gu has been consistently more accurate than many of the other researchers parsing COVID-19 pandemic trends. Gu estimates that over the course of the pandemic, U.S. COVID-19 infections have roughly been 4-fold greater than diagnosed cases. Applying that factor to the number of reported COVID-19 cases would yield an estimate of 480,000 and 5,000,000 total infections in Santa Clara and Los Angeles respectively. If those are ballpark accurate, that would mean that the COVID-19 infection fatality rate in Santa Clara is 0.46 percent and is 0.49 percent in Los Angeles. Again, applying a 4-fold multiplier to take account of undercounted infections, those are both just about where the U.S. infection fatality rate of 0.45 percent is now.
The upshot is that, so far, we have ended up about half-way between the best case and worst case scenarios sketched out at the beginning of the pandemic.
We rarely see the impact of policies reflected in data in real time. The COVID-19 pandemic changed that. In the present moment, a range of government, private, and academic sources catalogue household-level health and economic information to enable rapid policy analysis and response. To continue promoting periodic findings, identifying vulnerable populations, and maintaining a focus on public health, frequent national data collection needs to be improved and expanded permanently.
Knowledge accumulates over time, facilitating new advancements and advocacy. While mRNA biotechnology was not usable decades ago, years of public research helped unlock highly effective COVID-19 vaccines. The same can be true for advancing effective socioeconomic policies. More national, standardized data like the Census Bureau’s Household Pulse Survey will accelerate progress. At the same time, there are significant issues with national data sources. For instance, COVID-19 data reported by the CDC faced notable quality issues and inconsistencies between states.
Policymakers can’t address problems that they don’t know exist. Researchers can’t identify problems and solutions without adequate data. We can better study how policies impact population health and inform legislative action with greater federal funding dedicated to wide-ranging, systematized population surveys.
Broader data collection enables more findings and policy development
Evidence-based research is at the core of effective policy action. Surveillance data indicates what problems families face, who is most affected, and which interventions can best promote health and economic well-being. These collections can inform policy responses by reporting information on the demographics disproportionately affected by socioeconomic disruptions. Race and ethnicity, age, gender, sexual orientation, household composition, and work occupation all provide valuable details on who has been left behind by past and present legislative choices.
Since March 2020, COVID-19 cases and deaths, changes in employment, and food and housing security have been tracked periodically with detailed demographic information through surveys like the Both cumulative statistical compilations and representative surveillance polling have been instrumental to analyses. Our team has recorded over 200 state-level policies in the COVID-19 US State Policy (CUSP) database to further research and journalistic investigations. We have learned a number of policy lessons, from the health protections of eviction moratoria to the food security benefits of social insurance expansions. Not to be forgotten is the importance of documented evidence to these insights.
Without this comprehensive tracking, it would be difficult to determine the number of evictions occurring despite active moratoria, what factors contribute to elevated risk of COVID-19, and the value of pandemic unemployment insurance programs in states. The wider number of direct and indirect health outcomes measured have bolstered our understanding of the suffering experienced by different demographic groups. These issues are receiving legislative attention, in no small part due to the broad statistical collection and subsequent analytical research on these topics.
Insufficient data results in inadequate understanding of policy issues
The more high-quality data there is, the better. With the state-level policies present in CUSP, our team and other research groups quantified the impact of larger unemployment insurance benefit sizes, greater minimum wages, mask mandates, and eviction freezes. These analyses have been utilized by state and federal officials. None would have been possible without increased data collection.
However, our policy investigations are constrained by the data availability and quality on state and federal government websites, which may be improved with stimulus funds allocated to modernize our public health data infrastructure. Some of the most consequential decision-making right now relates to vaccine distribution and administration, but it is difficult to disaggregate state-level statistics. Many states lack demographic information on vaccine recipients as well as those that have contracted or died from COVID-19. Even though racial disparities are present in COVID-19 cases, hospitalizations, and deaths nationally, we can’t always determine the extent of these inequities locally. These present issues are a microcosm of pre-existing problems.
Data shortcomings present for years, in areas like occupational safety, are finally being spotlighted due to the pandemic. Minimal national and state workplace health data translated to insufficient COVID-19 surveillance in workplace settings. Studies that show essential workers are facing elevated risk of COVID-19 are often limited in scope to individual states or cities, largely due to the lack of usable and accessible data. More investment is needed going forward beyond the pandemic to better document a Otherwise there will continue to be serious blind spots in the ability to evaluate policy decisions, enforce better workplace standards, and hold leaders accountable for choices.
These are problems with a simple solution: collect more information. Now is not the time to eliminate valuable community surveys and aggregate compilations, but to expand on them. More comprehensive data will provide a spotlight on current and future legislative choices and improve the understanding of policies in new ways. It is our hope that are built upon and become the new norm.
Disclosure: Funding received from Robert Wood Johnson Foundation was used to develop the COVID-19 US State Policy Database.
HCA Healthcare, the nation’s largest for-profit hospital chain, which operates 185 hospitals and more than 2,000 care sites across 20 states, announced a landmark deal with search giant Google this week, aimed at extracting and analyzing data from more than 32M annual patient encounters.
The multiyear partnership will involve data scientists from both companies working together to develop care algorithms and clinical alerts to improve outcomes and efficiency. Data from HCA’s electronic health records will be integrated with Google’s cloud computing service, and the companies have pledged to adhere to strict limitations to protect individual patient privacy—a key concern raised by regulators after Google announced a similar partnership with another national health system, Ascension, at the end of 2019.
Despite those assurances, some experts pointed to this week’s announcement as further evidence that existing privacy protections are insufficient in the face of the deepening relationships between tech companies, like Google and Microsoft, and healthcare providers, who manage the sensitive health information of millions of patients.
We’d agree—we’re overdue for a major rethink of how patient privacy is handled. The healthcare industry spent much of the last decade “wiring” the health system, converting from paper records to electronic ones, and building vast storehouses of clinical data along the way. We’ve now reached a new phase, and the primary task ahead is to harness all of that data to actually improve care. That will require extensive data sharing, such as a recently announced initiative among several major health systems, and will also entail tapping the expertise of “big data” companies from beyond healthcare—the very same companies whose business practices have sometimes raised privacy concerns in the broader social context. But health information is different—more personal and more sensitive—than data about shopping preferences and viewing habits, requiring more rigorous regulation.
As more big data deals are inked in healthcare, the question of patient privacy will become increasingly pressing.
Optum, a subsidiary of UnitedHealth, provides data analytics and infrastructure, a pharmacy benefit manager called OptumRx, a bank providing patient loans called Optum Bank, and more.
It’s not often that the American Hospital Association—known for fun lobbying tricks like hiring consultants to create studies showing the benefits of hospital mergers—directly goes after another consolidation in the industry.
But when the AHA caught wind of UnitedHealth Group subsidiary Optum’s plans, announced in January 2021, to acquire data analytics firm Change Healthcare, they offered up some fiery language in a letter to the Justice Department. “The acquisition … will concentrate an immense volume of competitively sensitive data in the hands of the most powerful health insurance company in the United States, with substantial clinical provider and health insurance assets, and ultimately removes a neutral intermediary.”
If permitted to go through, Optum’s acquisition of Change would fundamentally alter both the health data landscape and the balance of power in American health care. UnitedHealth, the largest health care corporation in the U.S., would have access to all of its competitors’ business secrets. It would be able to self-preference its own doctors. It would be able to discriminate, racially and geographically, against different groups seeking insurance. None of this will improve public health; all of it will improve the profits of Optum and its corporate parent.
Despite the high stakes, Optum has been successful in keeping this acquisition out of the public eye.Part of this PR success is because few health care players want to openly oppose an entity as large and powerful as UnitedHealth. But perhaps an even larger part is that few fully understand what this acquisition will mean for doctors, patients, and the health care system at large.
If regulators allow the acquisition to take place, Optum will suddenly have access to some of the most secret data in health care.
UnitedHealth is the largest health care entity in the U.S., using several metrics. United Healthcare (the insurance arm) is the largest health insurer in the United States, with over 70 million members, 6,500 hospitals, and 1.4 million physicians and other providers. Optum, a separate subsidiary, provides data analytics and infrastructure, a pharmacy benefit manager called OptumRx, a bank providing patient loans called Optum Bank, and more. Through Optum, UnitedHealth also controls more than 50,000 affiliated physicians, the largest collection of physicians in the country.
While UnitedHealth as a whole has earned a reputation for throwing its weight around the industry, Optum has emerged in recent years as UnitedHealth’s aggressive acquisition arm. Acquisitions of entities as varied as DaVita’s dialysis physicians, MedExpress urgent care, and Advisory Board Company’s consultants have already changed the health care landscape. As Optum gobbles up competitors, customers, and suppliers, it has turned into UnitedHealth’s cash cow, bringing in more than 50 percent of the entity’s annual revenue.
On a recent podcast, Chas Roades and Dr. Lisa Bielamowicz of Gist Healthcare described Optum in a way that sounds eerily similar to a single-payer health care system. “If you think about what Optum is assembling, they are pulling together now the nation’s largest employers of docs, owners of one of the country’s largest ambulatory surgery center chains, the nation’s largest operator of urgent care clinics,” said Bielamowicz. With 98 million customers in 2020, OptumHealth, just one branch of Optum’s services, had eyes on roughly 30 percent of the U.S. population. Optum is, Roades noted, “increasingly the thing that ate American health care.”
Optum has not been shy about its desire to eventually assemble all aspects of a single-payer system under its own roof. “The reason it’s been so hard to make health care and the health-care system work better in the United States is because it’s rare to have patients, providers—especially doctors—payers, and data, all brought together under an organization,” OptumHealth CEO Wyatt Decker told Bloomberg. “That’s the rare combination that we offer. That’s truly a differentiator in the marketplace.” The CEO of UnitedHealth, Andrew Witty, has also expressed the corporation’s goal of “wir[ing] together” all of UnitedHealth’s assets.
Controlling Change Healthcare would get UnitedHealth one step closer to creating their private single-payer system. That’s why UnitedHealth is offering up $13 billion, a 41 percent premium on the public valuation of Change. But here’s why that premium may be worth every penny.
Change Healthcare is Optum’s leading competitor in pre-payment claims integrity; functionally, a middleman service that allows insurers to process provider claims (the receipts from each patient visit) and address any mistakes. To clarify what that looks like in practice, imagine a patient goes to an in-network doctor for an appointment. The doctor performs necessary procedures and uses standardized codes to denote each when filing a claim for reimbursement from the patient’s insurance coverage. The insurer then hires a reviewing service—this is where Change comes in—to check these codes for accuracy. If errors are found in the coded claims, such as accidental duplications or more deliberate up-coding (when a doctor intentionally makes a patient seem sicker than they are), Change will flag them, saving the insurer money.
The most obvious potential outcome of the merger is that the flow of data will allow Optum/UnitedHealth to preference their own entities and physicians above others.
To accurately review the coded claims, Change’s technicians have access to all of their clients’ coverage information, provider claims data, and the negotiated rates that each insurer pays.
Change also provides other services, including handling the actual payments from insurers to physicians, reimbursing for services rendered. In this role, Change has access to all of the data that flows between physicians and insurers and between pharmacies and insurers—both of which give insurers leverage when negotiating contracts. Insurers often send additional suggestions to Change as well; essentially their commercial secrets on how the insurer is uniquely saving money. Acquiring Change could allow Optum to see all of this.
Change’s scale (and its independence from payers) has been a selling point; just in the last few months of 2020, the corporation signed multiple contracts with the largest payers in the country.
Optum is not an independent entity; as mentioned above, it’s owned by the largest insurer in the U.S. So, when insurers are choosing between the only two claims editors that can perform at scale and in real time, there is a clear incentive to use Change, the independent reviewer, over Optum, a direct competitor.
If regulators allow the acquisition to take place, Optum will suddenly have access to some of the most secret data in health care. In other words, if the acquisition proceeds and Change is owned by UnitedHealth, the largest health care corporation in the U.S. will own the ability to peek into the book of business for every insurer in the country.
Although UnitedHealth and Optum claim to be separate entities with firewalls that safeguard against anti-competitive information sharing, the porosity of the firewall is an open question. As the AHA pointed out in their letter to the DOJ, “[UnitedHealth] has never demonstrated that the firewalls are sufficiently robust to prevent sensitive and strategic information sharing.”
In some cases, this “firewall” would mean asking Optum employees to forget their work for UnitedHealth’s competitors when they turn to work on implementing changes for UnitedHealth. It is unlikely to work. And that is almost certainly Optum’s intention.
The most obvious potential outcome of the merger is that the flow of data will allow Optum/UnitedHealth to preference their own entities and physicians above others. This means that doctors (and someday, perhaps, hospitals) owned by the corporation will get better rates, funded by increased premiums on patients. Optum drugs might seem cheaper, Optum care better covered. Meanwhile, health care costs will continue to rise as UnitedHealth fuels executive salaries and stock buybacks.
UnitedHealth has already been accused of self-preferencing. A large group of anesthesiologists filed suit in two states last week, accusing the company of using perks to steer surgeons into using service providers within its networks.
Even if UnitedHealth doesn’t purposely use data to discriminate, the corporation has been unable to correct for racially biased data in the past.
Beyond this obvious risk, the data alterations caused by the Change acquisition could worsen existing discrimination and medical racism. Prior to the acquisition, Change launched a geo-demographic analytics unit. Now, UnitedHealth will have access to that data, even as it sells insurance to different demographic categories and geographic areas.
Even if UnitedHealth doesn’t purposely use data to discriminate, the corporation has been unable to correct for racially biased data in the past, and there’s no reason to expect it to do so in the future. A study published in 2019 found that Optum used a racially biased algorithm that could have led to undertreating Black patients. This is a problem for all algorithms. As data scientist Cathy O’Neil told 52 Insights, “if you have a historically biased data set and you trained a new algorithm to use that data set, it would just pick up the patterns.” But Optum’s size and centrality in American health care would give any racially biased algorithms an outsized impact. And antitrust lawyer Maurice Stucke noted in an interview that using racially biased data could be financially lucrative. “With this data, you can get people to buy things they wouldn’t otherwise purchase at the highest price they are willing to pay … when there are often fewer options in their community, the poor are often charged a higher price.”
The fragmentation of American health care has kept Big Data from being fully harnessed as it is in other industries, like online commerce. But Optum’s acquisition of Change heralds the end of that status quo and the emergence of a new “Big Tech” of health care. With the Change data, Optum/UnitedHealth will own the data, providers, and the network through which people receive care. It’s not a stretch to see an analogy to Amazon, and how that corporation uses data from its platform to undercut third parties while keeping all its consumers in a panopticon of data.
The next step is up to the Department of Justice, which has jurisdiction over the acquisition (through an informal agreement, the DOJ monitors health insurance and other industries, while the FTC handles hospital mergers, pharmaceuticals, and more). The longer the review takes, the more likely it is that the public starts to realize that, as Dartmouth health policy professor Dr. Elliott Fisher said, “the harms are likely to outweigh the benefits.”
There are signs that the DOJ knows that to approve this acquisition is to approve a new era of vertical integration. In a document filed on March 24, Change informed the SEC that the DOJ had requested more information and extended its initial 30-day review period. But the stakes are high. If the acquisition is approved, we face a future in which UnitedHealth/Optum is undoubtedly “the thing that ate American health care.”
In mid-November, as the United States set records for newly diagnosed COVID-19 cases day after day, the hospital situation in one hard-hit state, Wisconsin, looked concerning but not yet urgent by one crucial measure. The main pandemic data tracking system run by the Department of Health and Human Services (HHS), dubbed HHS Protect, reported that on 16 November, 71% of the state’s hospital beds were filled. Wisconsin officials who rely on the data to support and advise their increasingly strained hospitals might have concluded they had some margin left.
Yet a different federal COVID-19 data system painted a much more dire picture for the same day, reporting 91% of Wisconsin’s hospital beds were filled. That day was no outlier. A Science examination of HHS Protect and confidential federal documents found the HHS data for three important values in Wisconsin hospitals—beds filled, intensive care unit (ICU) beds filled, and inpatients with COVID-19—often diverge dramatically from those collected by the other federal source, from state-supplied data, and from the apparent reality on the ground.
“Our hospitals are struggling,” says Jeffrey Pothof, a physician and chief quality officer for the health system of the University of Wisconsin (UW), Madison. During recent weeks, patients filled the system’s COVID-19 ward and ICU. The university’s main hospital converted other ICUs to treat the pandemic disease and may soon have to turn away patients referred to the hospital for specialized care. Inpatient beds—including those in ICUs—are nearly full across the state. “That’s the reality staring us down,” Pothof says, adding: The HHS Protect numbers “are not real.”
HHS Protect’s problems are a national issue, an internal analysis completed this month by the Centers for Disease Control and Prevention (CDC) shows. That analysis, other federal reports, and emails obtained by Science suggest HHS Protect’s data do not correspond with alternative hospital data sources in many states (see tables, below). “The HHS Protect data are poor quality, inconsistent with state reports, and the analysis is slipshod,” says one CDC source who had read the agency’s analysis and requested anonymity because of fear of retaliation from the Trump administration. “And the pressure on hospitals [from COVID-19] is through the roof.”
Both federal and state officials use HHS Protect’s data to assess the burden of disease across the country and allocate scarce resources, from limited stocks of COVID-19 medicines to personal protective equipment (PPE). Untrustworthy numbers could lead to supply and support problems in the months ahead, as U.S. cases continue to rise during an expected winter surge, according to current and former CDC officials. HHS Protect leaders vigorously defend the system and blame some disparities on inconsistent state and federal definitions of COVID-19 hospitalization. “We have made drastic improvements in the consistency of our data … even from September to now,” says one senior HHS official. (Three officials from the department spoke with Science on the condition that they not be named.)
CDC had a long-running, if imperfect, hospital data tracking system in place when the pandemic started, but the Trump administration and White House Coronavirus Task Force Coordinator Deborah Birx angered many in the agency when they shifted much of the responsibility for COVID-19 hospital data in July to private contractors.TeleTracking Technologies Inc., a small Pittsburgh-based company, now collects most of the data, while Palantir, based in Denver, helps manage the database. At the time, hundreds of public health organizations and experts warned the change could gravely disrupt the government’s ability to understand the pandemic and mount a response.
The feared data chaos now seems a reality, evident when recent HHS Protect figures are compared with public information from states or data documented by another hospital tracking system run by the HHS Office of the Assistant Secretary for Preparedness and Response (ASPR). ASPR manages the Strategic National Stockpile of medicines, PPE—in perilously short supply in many areas—and other pandemic necessities. ASPR collects data nationwide, although it is more limited than what HHS Protect compiles, to help states and hospitals respond to the pandemic.
In Alabama, HHS Protect figures differ by 15% to 30% from daily state COVID-19 inpatient totals. Karen Landers, assistant state health officer, said nearly all of the state’s hospitals report data to HHS via the Alabama Department of Public Health. Although reporting delays sometimes prevent the systems from syncing precisely, Landers says, she cannot account for the sharp differences.
Many state health officials contacted by Science were reluctant to directly criticize HHS Protect or attribute supply or support problems to its data. Landers notes that Alabama relies on its own collected data, rather than HHS Protect’s, for its COVID-19 response. “We are very confident in our data,” she says, because the state reporting system was developed over several years and required little adjustment to add COVID-19. HHS, she adds, has generally been responsive to state requests for medicines and supplies, although Alabama has not always gotten all the PPE it has requested.
Other states, however, say they do rely on HHS Protect. A spokesperson for the Wisconsin Department of Health Services wrote in a response to questions, “When making decisions at the state level we use the HHS Protect data,” but declined to comment about its accuracy. HHS informed Wisconsin officials it distributes scarce supplies based on need indicated by HHS Protect data, the spokesperson wrote.
Pothof says UW’s hospital system has its own sophisticated data dashboard that draws on state, local, and internal sources to plan and cooperate on pandemic response with other hospitals. But small hospitals in Wisconsin—now experiencing shortages of some medicines, PPE, and other supplies—are more dependent on federal support largely based on HHS Protect data. Help might not arrive, Pothof says, if the data show “things look better than they are.”
If the HHS Protect data are suspect, “that’s a very large problem,” says Nancy Cox, former director of CDC’s influenza division and now an affiliated retiree of the agency. If HHS officials use bad data, they will not distribute medicines and supplies equitably, Cox notes, adding: “Undercounting in the hardest hit states means a lower level of care and will result in more severe infections and ultimately in more deaths.”
Birx and the other managers of HHS Protect “really had no idea what they were doing,” says Tom Frieden, CDC director under former President Barack Obama. (Birx declined to comment for this article.) Frieden cautions that ASPR data might also be erroneous—pointing to the need for an authoritative and clear federal source of hospital data. The original CDC system, called the National Healthcare Safety Network (NHSN), should be improved, he said, but it handles nursing home COVID-19 data skillfully and could do the same with hospitals. NHSN is “not just a computer program. It’s a public health program” built over 15 years and based on relationships with individual health facilities, Frieden says. (CDC insiders say HHS officials recently interfered with publication of an analysis showing that NHSN performed well early in the pandemic [see sidebar, below]).
An HHS official says HHS Protect’s data are complex and the department can’t verify any findings in the reports reviewed by Science without conducting its own analysis, which it did not do. But the official says HHS Protect has improved dramatically in the past 2 months and provides consistent and reliable results.
As for the difference between state and HHS Protect data, an HHS official contends state numbers “are always going to be lower” by up to 20%. That’s because hospitals could lose Medicare funding if they do not report to HHS, the official says, but face no penalty for failing to report to the state. So rather than expect identical numbers, HHS looks for state and federal data to reflect the same trajectory—which they do in all cases for COVID-19 inpatient data, according to another confidential CDC analysis of HHS Protect, covering all 50 states.
Yet the same analysis found 27 states recently alternated between showing more or fewer COVID-19 inpatients than HHS Protect—not always just fewer, as HHS says should be the case. Thirty states also showed differences between state and HHS Protect figures that were frequently well above the 20% threshold cited by HHS, and HHS Protect data fluctuated erratically in 21 states (see chart, below).
“Hospital capacity metrics can and should be a national bellwether,” the CDC data expert says. “One important question raised by the discordant data reported by HHS Protect and the states is whether HHS Protect is systematically checking data validity.” HHS has not provided its methodology for HHS Protect data estimates for review by independent experts. But an HHS official says a team of data troubleshooters, including CDC and ASPR field staff, work to resolve anomalies and respond to spikes in cases in a state or hospital.
Out of sync
Tracking hospital inpatients who have COVID-19 has become a crucial measure of the pandemic’s severity. Department of Health and Human Services (HHS) data from the HHS Protect system often diverge sharply from state-supplied data. This chart, drawn from a data analysis from the Centers for Disease Control and Prevention, summarizes some of the similarities and differences for COVID-19 inpatient totals over the past 2 months.
Along with improving trust in its data, HHS Protect needs to make it more accessible, CDC data scientists say. The publicly accessible HHS Protect data are far less complete than the figures in its password-protected database. This effectively hides from public view key pandemic information, such as local supplies of protective equipment.
The site also does not provide graphics highlighting patterns and trends. This might explain, in part, why most media organizations—as well as President-elect Joe Biden’s transition team—instead have relied on state or county websites that vary widely in completeness and quality, or on aggregations such as The Atlantic magazine’s COVID Tracking Project, which collects, organizes, and standardizes state data. (In comparing state and federal data, CDC also used the COVID Tracking Project.)
Frieden and other public health specialists call reliable, clear federal data essential for an effective pandemic response. “The big picture is that we’re coming up to 100,000 hospitalizations within the next few weeks. Hospital systems all over the country are going to be stressed,” Frieden says. “There’s not going to be any cavalry coming over the hill from somewhere else in the country, because most of the country is going to be overwhelmed. We’re heading into a very hard time with not very accurate information systems. And the government basically undermined the existing system.”
Since the beginning of the coronavirus pandemic, Florida has blocked, obscured, delayed, and at times hidden the COVID-19 data used in making big decisions such as reopening schools and businesses.
And with scientists warning Thanksgiving gatherings could cause an explosion of infections, the shortcomings in the state’s viral reporting have yet to be fixed.
While the state has put out an enormous amount of information, some of its actions have raised concerns among researchers that state officials are being less than transparent.
It started even before the pandemic became a daily concern for millions of residents. Nearly 175 patients tested positive for the disease in January and February, evidence the Florida Department of Health collected but never acknowledged or explained. The state fired its nationally praised chief data manager, she says in a whistleblower lawsuit, after she refused to manipulate data to support premature reopening. The state said she was fired for not following orders.
The health department used to publish coronavirus statistics twice a day before changing to once a day, consistently meeting an 11 a.m. daily deadline for releasing new information that scientists, the media and the public could use to follow the pandemic’s latest twists.
But in the past month the department has routinely and inexplicably failed to meet its own deadline by as much as six hours. On one day in October, it published no update at all.
News outlets were forced to sue the state before it would publish information identifying the number of infections and deaths at individual nursing homes.
Throughout it all, the state has kept up with the rapidly spreading virus by publishing daily updates of the numbers of cases, deaths and hospitalizations.
“Florida makes a lot of data available that is a lot of use in tracking the pandemic,” University of South Florida epidemiologist Jason Salemi said. “They’re one of the only states, if not the only state, that releases daily case line data (showing age, sex and county for each infected person).”
Dr. Terry Adirim, chairwoman of Florida Atlantic University’s Department of Integrated Biomedical Science, agreed, to a point.
“The good side is they do have daily spreadsheets,” Adirim said. “However, it’s the data that they want to put out.”
The state leaves out crucial information that could help the public better understand who the virus is hurting and where it is spreading, Adirim said.
The department, under state Surgeon General Dr. Scott Rivkees, oversees 53? health agencies covering Florida’s 67 counties, such as the one in Palm Beach County headed by Dr. Alina Alonso.
Rivkees was appointed in April 2019. He reports to Gov. Ron DeSantis, a Republican who has supported President Donald Trump’s approach to fighting the coronavirus and pressured local officials to reopen schools and businesses despite a series of spikes indicating rapid spread of the disease.
At several points, the DeSantis administration muzzled local health directors, such as when it told them not to advise school boards on reopening campuses.
DOH Knew Virus Here Since January
The health department’s own coronavirus reports indicated that the pathogen had been infecting Floridians since January, yet health officials never informed the public about it and they did not publicly acknowledge it even after The Palm Beach Post first reported it in May.
In fact, the night before The Post broke the story, the department inexplicably removed from public view the state’s dataset that provided the evidence. Mixed among listings of thousands of cases was evidence that up to 171 people ages 4 to 91 had tested positive for COVID-19 in the months before officials announced in March the disease’s presence in the state.
Were the media reports on the meaning of those 171 cases in error? The state has never said.
No Testing Stats Initially
When positive tests were finally acknowledged in March, all tests had to be confirmed by federal health officials. But Florida health officials refused to even acknowledge how many people in each county had been tested.
State health officials and DeSantis claimed they had to withhold the information to protect patient privacy, but they provided no evidence that stating the number of people tested would reveal personal information.
At the same time, the director of the Hillsborough County branch of the state health department publicly revealed that information to Hillsborough County commissioners.
And during March the state published on a website that wasn’t promoted to the public the ages and genders of those who had been confirmed to be carrying the disease, along with the counties where they claimed residence.
Firing Coronavirus Data Chief
In May, with the media asking about data that revealed the earlier onset of the disease, internal emails show that a department manager ordered the state’s coronavirus data chief to yank the information off the web, even though it had been online for months.
A health department tech supervisor told data manager Rebekah Jones on May 5 to take down the dataset. Jones replied in an email that was the “wrong call,” but complied, only to be ordered an hour later to put it back.
That day, she emailed reporters and researchers following a listserv she created, saying she had been removed from handling coronavirus data because she refused to manipulate datasets to justify DeSantis’ push to begin reopening businesses and public places.
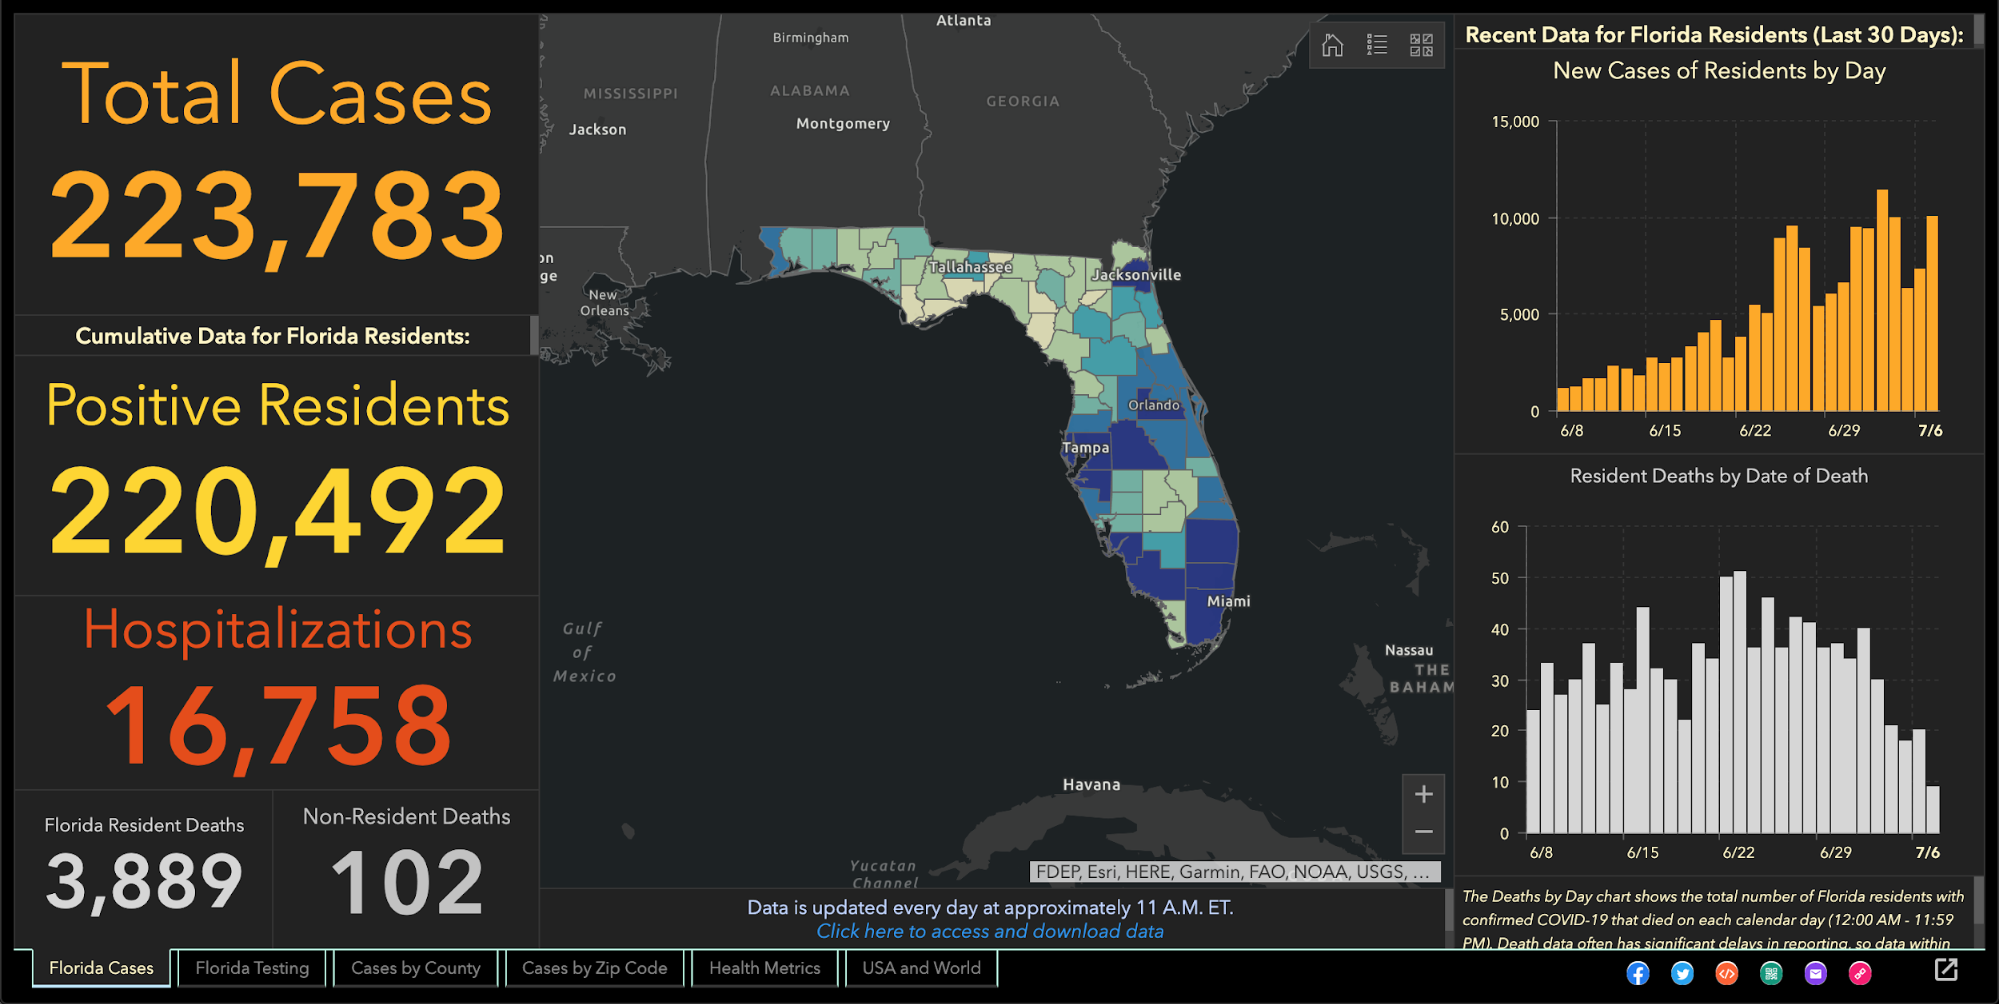
Two weeks later, the health department fired Jones, who in March had created and maintained Florida’s one-stop coronavirus dashboard, which had been viewed by millions of people, and had been praised nationally, including by White House Coronavirus Task Force Coordinator Deborah Birx.
The dashboard allows viewers to explore the total number of coronavirus cases, deaths, tests and other information statewide and by county and across age groups and genders.
DeSantis claimed on May 21 that Jones wanted to upload bad coronavirus data to the state’s website. To further attempt to discredit her, he brought up stalking charges made against her by an ex-lover, stemming from a blog post she wrote, that led to two misdemeanor charges.
Using her technical know-how, Jones launched a competing COVID-19 dashboard website, FloridaCOVIDAction.com in early June. After national media covered Jones’ firing and website launch, people donated more than $200,000 to her through GoFundMe to help pay her bills and maintain the website.
People view her site more than 1 million times a day, she said. The website features the same type of data the state’s dashboard displays, but also includes information not present on the state’s site such as a listing of testing sites and their contact information.
Jones also helped launch TheCOVIDMonitor.com to collect reports of infections in schools across the country.
Jones filed a whistleblower complaint against the state in July, accusing managers of retaliating against her for refusing to change the data to make the coronavirus situation look better.
“The Florida Department of Health needs a data auditor not affiliated with the governor’s office because they cannot be trusted,” Jones said Friday.
Florida Hides Death Details
When coronavirus kills someone, their county’s medical examiner’s office logs their name, age, ethnicity and other information, and sends it to the Florida Department of Law Enforcement.
During March and April, the department refused requests to release that information to the public, even though medical examiners in Florida always have made it public under state law. Many county medical examiners, acknowledging the role that public information can play in combating a pandemic, released the information without dispute.
But it took legal pressure from news outlets, including The Post, before FDLE agreed to release the records it collected from local medical examiners.
When FDLE finally published the document on May 6, it blacked out or excluded crucial information such as each victim’s name or cause of death.
But FDLE’s attempt to obscure some of that information failed when, upon closer examination, the seemingly redacted details could in fact be read by common computer software.
Outlets such as Gannett, which owns The Post, and The New York Times, extracted the data invisible to the naked eye and reported in detail what the state redacted, such as the details on how each patient died.
Reluctantly Revealing Elder Care Deaths, Hospitalizations
It took a lawsuit against the state filed by the Miami Herald, joined by The Post and other news outlets, before the health department began publishing the names of long-term care facilities with the numbers of coronavirus cases and deaths.
The publication provided the only official source for family members to find out how many people had died of COVID-19 at the long-term care facility housing their loved ones.
While the state agreed to publish the information weekly, it has failed to publish several times and as of Nov. 24 had not updated the information since Nov. 6.
It took more pressure from Florida news outlets to pry from the state government the number of beds in each hospital being occupied by coronavirus patients, a key indicator of the disease’s spread, DeSantis said.
That was one issue where USF’s Salemi publicly criticized Florida.
“They were one of the last three states to release that information,” he said. “That to me is a problem because it is a key indicator.”
Confusion Over Positivity Rate
One metric DeSantis touted to justify his decision in May to begin reopening Florida’s economy was the so-called positivity rate, which is the share of tests reported each day with positive results.
But Florida’s daily figures contrasted sharply with calculations made by Johns Hopkins University, prompting a South Florida Sun-Sentinel examination that showed Florida’s methodology underestimated the positivity rate.
The state counts people who have tested positive only once, but counts every negative test a person receives until they test positive, so that there are many more negative tests for every positive one.
John Hopkins University, on the other hand, calculated Florida’s positivity rate by comparing the number of people testing positive with the total number of people who got tested for the first time.
By John Hopkins’ measure, between 10 and 11 percent of Florida’s tests in October came up positive, compared to the state’s reported rate of between 4 and 5 percent.
Health experts such as those at the World Health Organization have said a state’s positivity rate should stay below 5 percent for 14 days straight before it considers the virus under control and go forward with reopening public places and businesses. It’s also an important measure for travelers, who may be required to quarantine if they enter a state with a high positivity rate.
Withholding Detail on Race, Ethnicity
The Post reported in June that the share of tests taken by Black and Hispanic people and in majority minority ZIP codes were twice as likely to come back positive compared to tests conducted on white people and in majority white ZIP codes.
That was based on a Post analysis of internal state data the health department will not share with the public.
The state publishes bar charts showing general racial breakdowns but not for each infected person.
If it wanted to, Florida’s health department could publish detailed data that would shed light on the infection rates among each race and ethnicity or each age group, as well as which neighborhoods are seeing high rates of contagion.
Researchers have been trying to obtain this data but “the state won’t release the data without (making us) undergo an arduous data use agreement application process with no guarantee of release of the data,” Adirim said. Researchers must read and sign a 26-page, nearly 5,700-word agreement before getting a chance at seeing the raw data.
While Florida publishes the ages, genders and counties of residence for each infected person, “there’s no identification for race or ethnicity, no ZIP code or city of the residence of the patient,” Adirim said. “No line item count of negative test data so it’s hard to do your own calculation of test positivity.”
While Florida doesn’t explain its reasoning, one fear of releasing such information is the risk of identifying patients, particularly in tiny, non-diverse counties.
Confusion Over Lab Results
Florida’s daily report shows how many positive results come from each laboratory statewide. Except when it doesn’t.
The report has shown for months that 100 percent of COVID-19 tests conducted by some labs have come back positive despite those labs saying that shouldn’t be the case.
While the department reported in July that all 410 results from a Lee County lab were positive, a lab spokesman told The Post the lab had conducted roughly 30,000 tests. Other labs expressed the same confusion when informed of the state’s reporting.
The state health department said it would work with labs to fix the error. But even as recently as Tuesday, the state’s daily report showed positive result rates of 100 percent or just under it from some labs, comprising hundreds of tests.
Mistakenly Revealing School Infections
As DeSantis pushed in August for reopening schools and universities for students to attend in-person classes, Florida’s health department published a report showing hundreds of infections could be traced back to schools, before pulling that report from public view.
The health department claimed it published that data by mistake, the Miami Herald reported.
The report showed that COVID-19 had infected nearly 900 students and staffers.
The state resumed school infection reporting in September.
A similar publication of cases at day-care centers appeared online briefly in August only to come down permanently.
Updates Delayed
After shifting in late April to updating the public just once a day at 11 a.m. instead of twice daily, the state met that deadline on most days until it started to falter in October. Pandemic followers could rely on the predictability.
On Oct. 10, the state published no data at all, not informing the public of a problem until 5 p.m.
The state blamed a private lab for the failure but the next day retracted its statement after the private lab disputed the state’s explanation. No further explanation has been offered.
On Oct. 21, the report came out six hours late.
Since Nov. 3, the 11 a.m. deadline has never been met. Now, late afternoon releases have become the norm.
“They have gotten more sloppy and they have really dragged their feet,” Adirim, the FAU scientist, said.
No spokesperson for the health department has answered questions from The Post to explain the lengthy delays. Alberto Moscoso, the spokesman throughout the pandemic, departed without explanation Nov. 6.
The state’s tardiness can trip up researchers trying to track the pandemic in Florida, Adirim said, because if one misses a late-day update, the department could overwrite it with another update the next morning, eliminating critical information and damaging scientists’ analysis.
Hired Sports Blogger to Analyze Data
As if to show disregard for concerns raised by scientists, the DeSantis administration brought in a new data analyst who bragged online that he is no expert and doesn’t need to be.
Kyle Lamb, an Uber driver and sports blogger, sees his lack of experience as a plus.
“Fact is, I’m not an ‘expert’,” Lamb wrote on a website for a subscribers-only podcast he hosts about the coronavirus. “I also don’t need to be. Experts don’t have all the answers, and we’ve learned that the hard way throughout the entire duration of the global pandemic.”
Much of his coronavirus writings can be found on Twitter, where he has said masks and mandatory quarantines don’t stop the virus’ spread, and that hydroxychloroquine, a drug touted by President Donald Trump but rejected by medical researchers, treats it successfully.
While DeSantis says lockdowns aren’t effective in stopping the spread and refuses to enact a statewide mask mandate, scientists point out that quarantines and masks are extremely effective.
The U.S. Food and Drug Administration has said hydroxychloroquine is unlikely to help and poses greater risk to patients than any potential benefits.
Coronavirus researchers have called Lamb’s views “laughable,” and fellow sports bloggers have said he tends to act like he knows much about a subject in which he knows little, the Miami Herald reported.
DeSantis has yet to explain how and why Lamb was hired, nor has his office released Lamb’s application for the $40,000-a-year job. “We generally do not comment on such entry level hirings,” DeSantis spokesman Fred Piccolo said Tuesday by email.
It could be worse.
Texas health department workers have to manually enter data they read from paper faxes into the state’s coronavirus tracking system, The Texas Tribune has reported. And unlike Florida, Texas doesn’t require local health officials to report viral data to the state in a uniform way that would make it easier and faster to process and report.
It could be better.
In Wisconsin, health officials report the number of cases and deaths down to the neighborhood level. They also plainly report racial and ethnic disparities, which show the disease hits Hispanic residents hardest.
Still, Salemi worries that Florida’s lack of answers can undermine residents’ faith.
“My whole thing is the communication, the transparency,” Salemi said. “Just let us know what’s going on. That can stop people from assuming the worst. Even if you make a big error people are a lot more forgiving, whereas if the only time you’re communicating is when bad things happen … people start to wonder.”
Crafting successful public health measures depends on the ability of top scientists to gather data and report their findings unrestricted to policymakers.
State of play: But concern has spiked among health experts and physicians over what they see as an assault on key science protections, particularly during a raging pandemic. And a move last week by President Trump, via an executive order, is triggering even more worries.
What’s happening: If implemented, the order creates a “Schedule F” class of federal employees who are policymakers from certain agencies who would no longer have protection against being easily fired— and would likely include some veteran civil service scientists who offer key guidance to Congress and the White House.
“This much-needed reform will increase accountability in essential policymaking positions within the government,” OMB director Russ Vought tells Axios in a statement.
What they’re saying: Several medical associations, including the Infectious Diseases Society of America, strongly condemned the action, and Democrats on the House oversight panel demanded the administration “immediately cease” implementation.
“If you take how it’s written at face value, it has the potential to turn every government employee into a political appointee, who can be hired and fired at the whim of a political appointee or even the president,” says University of Colorado Boulder’s Roger Pielke Jr.
Protections for members of civil service allow them to argue for evidence-based decision-making and enable them to provide the best advice, says CRDF Global’s Julie Fischer, adding that “federal decision-makers really need access to that expertise — quickly and ideally in house.”
Between the lines: Politics plays some role in science, via funding, policymaking and national security issues.
The public health system is a mix of agency leaders who are political appointees, like HHS Secretary Alex Azar, and career civil servants not dependent on the president’s approval, like NIAID director Anthony Fauci.
“Public health is inherently political because it has to do with controlling the way human beings move around,” says University of Pennsylvania’s Jonathan Moreno.
Yes, but: The norm is to have a robust discussion — and what has been happening under the Trump administration is not the norm, some say.
“Schedule F is just remarkable,” Pielke says. “It’s not like political appointees editing a report, [who are] working within the system to kind of subvert the system. This is an effort to completely redefine the system.”
The Center for Strategic and International Studies’ Stephen Morrison says that the administration has been defying normative practices, including statements denigrating scientists, the CDC and FDA.
The big picture: Public trust in scientists,which tends to be high, is taking a hit, not only due to messaging from the administration but also from public confusion over changes in guidance, which vacillated over masks and other suggestions.
Public health institutions “need to have the trust of the American people. In order to have the trust of the American people, they can’t have their autonomy and their credibility compromised, and they have to have a voice,” Morrison says.
“If you deny CDC the ability to have briefings for the public, and you take away control over authoring their guidance, and you attack them and discredit them so public perceptions of them are negative, you are taking them out of the game and leaving the stage completely open for falsehoods,” he adds.
“All scientists don’t agree on all the evidence, every time. But what we do agree on is that there’s a process. We look at what we know, we decide what we can clearly recommend based on what we know, sometimes when we learn more, we change our recommendations, and that’s the scientific process,” Fischer says.
What’s next: The scientific community is going to need to be proactive on rebuilding public trust in how the scientific process works and being clear when guidance changes and why it has changed, Fischer says.
A patchwork approach to contact tracing across state health departments is making it increasingly difficult to know where people are getting exposed to COVID-19.
While some states like Louisiana and Washington state publicly track detailed data related to COVID-19 cases in bars, camps, daycares, churches, worksites and restaurants, most states do not, creating obstacles to preventing future cases.
The extensive spread of the virus, combined with the country’s 50-state approach to pandemic response, has led to a dearth of information about where transmissions are occurring. Those shortcomings are in turn complicating efforts to safely open the economy and to understand the risks associated with certain activities and settings.
Experts know COVID-19 spreads in crowded indoor spaces, but more specifics could help state and local lawmakers strike a better balance between public health needs and those of the economy.
“If you want to take a more targeted approach to public health measures, the more information you have the better,” said Joshua Michaud, an associate director for global health policy at the Kaiser Family Foundation and an infectious disease epidemiologist.
“Rather than have a blunt, close-everything-down approach, you could be a bit more targeted and surgical about how you implement certain measures,” he added.
The Hill asked every state for information about the data they collect and share as part of their contact tracing programs, one of the main tools public health officials have to slow the spread of COVID-19.
Most states release information about outbreaks and cases at congregate settings like nursing homes, meatpacking plants, and prisons, which comprise the majority of cases. But there is less information publicly available about the numbers of cases or outbreaks tied to other settings commonly visited by people.
A handful of states including Arkansas, Colorado, Kansas, Louisiana, Maryland, Michigan, Ohio, Rhode Island and Washington track and publicly release data on the settings where COVID-19 outbreaks are occurring, according to responses from state health departments.
For example, Louisiana has tied 468 cases to bars in the state, but most of the new cases in the past week have been tied to food processing plants.
In The Hill’s review of publicly available state data, other settings for COVID-19 transmission include restaurants, childcare centers, gyms, colleges and schools, churches, retailers, weddings and other private social events. It is not clear how widely those settings contributed to infections because widespread transmission of the virus means many people who get sick do not get interviewed by contact tracers — over the past week, there has been an average of 42,000 confirmed cases, though many more are likely going undetected.
State health departments in Idaho, Illinois, Massachusetts, Mississippi, Missouri, New Hampshire, North Carolina, South Carolina, Tennessee, Texas, Vermont, Virginia and West Virginia told The Hill they don’t track location data.
Utah tracks outbreaks and cases tied to workplaces and schools, but not restaurants or bars.
Arizona, California, Delaware, Indiana, Oregon and Pennsylvania track infection locations, but don’t release it to the public.
“The number of people getting COVID-19 from isolated, identifiable outbreaks, such as those in long term care facilities, is decreasing, and more people are contracting COVID-19 from being out and about in their community, such as when visiting restaurants and bars,” said Maggi Mumma, a spokeswoman for the Pennsylvania Department of Health.
Bars, indoor dining and gyms are still closed in most of New York and New Jersey, so there is no current data to track for those settings.
But the state health departments also don’t release data on outbreaks or cases tied to other settings like childcare or retail stores.
Minnesota, Montana, North Dakota and Wisconsin release the number of cases tied to outbreaks in the community but do not go into specifics about possible transmission sites.
For example, Minnesota lists nearly 7,000 cases as being tied to “community” exposure, but that includes settings like restaurants, bars and workspaces.
In Iowa, a state health department spokesperson said the agency is working on extracting and sharing this type of data on its website, while Maine would not say if they track by specific location.
The remaining state health departments did not respond to multiple requests for comment from The Hill and don’t have information about outbreaks or exposure settings on their websites.
Several states said local health departments may be tracking infection locations even if the state is not.
Experts said such a decentralized approach can miss outbreaks if local departments aren’t communicating with each other, meaning any data should be public.
“I do think it would be very valuable for states to make that information public,” said Crystal Watson, assistant professor at Johns Hopkins Bloomberg School of Public Health.
“It helps us collectively get a better understanding as policymakers, as people trying to help in the response. It can also help with personal decision making for people to understand … where it’s most dangerous to go related to getting infected,” Watson said.
The disparities between state health departments are partially due to a lack of federal guidance.
There are no federal requirements on the information contact tracers collect; guidelines vary from state to state, and sometimes from county to county.
Tracking data about where people are getting sick would allow states to take a “cluster busting” approach, experts said, by working backwards from confirmed cases to find where patients might have first contracted the disease, potentially stopping future outbreaks.
That approach requires a change in mindset for contact tracers, who typically focus on reaching close contacts of confirmed cases who might have been exposed to the virus. But research shows between 10 and 20 percent of people are responsible for about 80 percent of new infections, mostly through so-called super-spreader events.
“We know that the way this virus has transmitted is highly clustered groups and anytime you have settings where a lot of people are together in one place,” said Kaiser’s Michaud.
“Collecting good information on this — the cluster busting approach — is a good way to find out where your prevention efforts can have the best bang for your buck,” he said.
At the same time, some state programs are still not operating at full force and are struggling to keep up with widespread infections.
“I think that many parts of the country, especially outside of the Northeast … simply have too many cases to use contact tracing as the primary public health measure to control cases,” said Stephen Kissler, a research fellow at the Harvard T.H. School of Public Health.
“It’s just not enough,” he said. “We just don’t have enough resources, and in a lot of these places enough contact tracers, to follow up on all of the cases.”