Days Cash on Hand Does Not Tell the Full Liquidity Story

https://www.kaufmanhall.com/insights/blog/days-cash-hand-does-not-tell-full-liquidity-story

Days cash on hand is one of the most important metrics in hospital credit analysis. The ratio calculates an organization’s unrestricted cash and investments relative to daily operating expenses.

Here’s a computation commonly used to calculate days cash on hand:

[Unrestricted cash and investments*365 days] / [Annual operating expenses – non-cash expenses]

Math aside, let’s unpack what days cash on hand really tells us. Days cash on hand gives an indication of a hospital’s flexibility and financial health. Essentially, it tells us how long a hospital could continue to operate if cash flow were to stop. From a ratings perspective, the higher the days cash, the better, to create a cushion or rainy-day fund for unexpected events.

While the sheer abatement of cash flow feels like a doomsday scenario, we don’t have to look far back to see examples. The shutdown in the early days of Covid and the recent Change Healthcare cyberattack are examples of events that can materially impact cash flow. While these may be considered extreme, there are plenty of more common events that can disrupt cash flow, including a delay in supplemental funding, an IT installation, a change in Medicare fiscal intermediary, an escalation in construction costs, or the bankruptcy of a payer.

Size and diversified business enterprises can impact days cash on hand. For example, small hospitals with outsized cash positions relative to operations often report a dizzying level of days cash on hand. Health systems with wholly owned health plans often show lower days cash when compared to like-sized peers without health plans. Analysts will also review a hospital’s cash-to-debt ratio, which is an indication of leverage and compares absolute unrestricted cash to long-term obligations. Cash-to-debt creates a more comparable ratio across the portfolio.

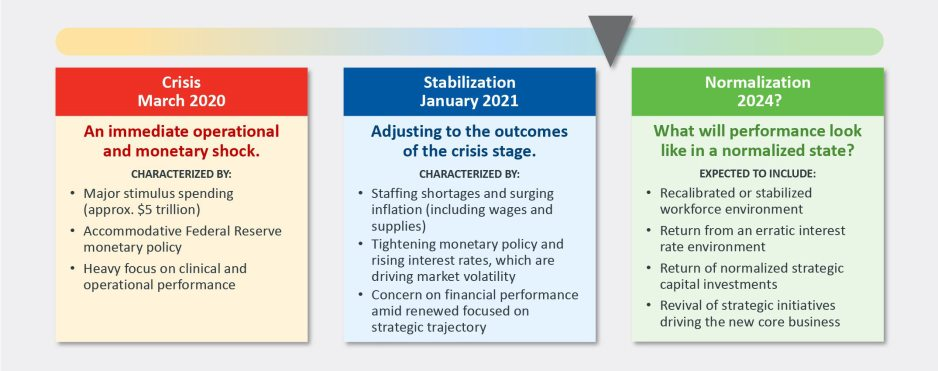
In the years leading up to the pandemic, the days cash on hand median increased steadily as the industry went through a period of stable financial performance and steady equity market returns. Hospitals took advantage of an attractive debt market to fund large capital projects or reimburse for prior capital spending. The median crested over 200 days. As discussed during our March 20, 2024, rating agency webinar, days cash median for 2023 is expected to decline or remain flat at best, not because of an increase in capital spending or deficit operations, but because daily expenses (mainly driven by labor) will grow faster than absolute cash. Expenses will outrun the bear, so to speak.

Days cash on hand will remain a pillar liquidity ratio for the industry, but equally important is the concept of liquidity. Days cash on hand doesn’t tell the whole story regarding liquidity. A hospital may compute that it has, say, 200 days cash on hand, but that calculation is based on total unrestricted cash and investments, which usually includes long-term investment pools. A sizable portion of that 200 days may not be accessible on a daily basis.

Recall that during the 2008 liquidity crisis, many hospitals had large portions of their unrestricted investment pools tied up in illiquid investments. When you needed it the most, you couldn’t get it. 2008 was a watershed moment that starkly showed the difference between wealth and liquidity and the growing importance of the latter. Days cash on hand didn’t necessarily mean “on hand.” Many hospitals scrambled for liquidity, which came in the form of expensive bank lines because liquidating equity investments in a down market would come at a huge cost.

Nearly overnight, daily liquidity became a fundamental part of credit analysis.

While the events were different, Covid and Change Healthcare followed the same fact pattern: crisis occurred, cash flow abated, and hospitals scrambled for liquidity, drawing on lines of credit to fund operating needs. Within a quick minute healthcare went “back to the future,” and undoubtedly, there will be another liquidity crisis ahead.

Rating reports now include information on investment allocation and diversification within those investments, and report new ratios such as monthly liquidity to total cash and investments. A hospital with below average days cash on hand or cash-to-debt may receive more attention in the rating report regarding immediately accessible funds.

Irrespective of a high or low cash position or rating category, providing rating analysts with a schedule highlighting where management would turn to when liquidity is needed would be well received. For example, do you draw on lines of credit, hit depository accounts, pause capital, extend payables, or liquidate investments, and in what order? Some health systems are taking this a step further with an in-depth sophisticated analysis to quantify their operating risks and size their liquidity needs accordingly, which we call Strategic Resource Allocation. This analysis would boost an analyst’s confidence in management’s preparedness for the next crisis with the segmenting of true cash “on hand.” It would also help ensure that, when the next crisis arrives, management will know where to turn to maintain liquidity and meet daily cash needs.

Healthcare CFOs explore M&A, automation and service line cuts in 2024

Companies grappling with liquidity concerns are looking to cut costs and streamline operations, according to a new survey.

Dive Brief:

  • Over three-quarters of healthcare chief financial officers expect to see profitability increases in 2024, according to a recent survey from advisory firm BDO USA. However, to become profitable, many organizations say they will have to reduce investments in underperforming service lines, or pursue mergers and acquisitions.
  • More than 40% of respondents said they will decrease investments in primary care and behavioral health services in 2024, citing disruptions from retail players. They will shift funds to home care, ambulatory services and telehealth that provide higher returns, according to the report.
  • Nearly three-quarters of healthcare CFOs plan to pursue some type of M&A deal in the year ahead, despite possible regulatory threats.

Dive Insight:

Though inflationary pressures have eased since the height of the COVID-19 pandemic, healthcare CFOs remain cognizant of managing costs amid liquidity concerns, according to the report.

The firm polled 100 healthcare CFOs serving hospitals, medical groups, outpatient services, academic centers and home health providers with revenues from $250 million to $3 billion or more in October 2023.

Just over a third of organizations surveyed carried more than 60 days of cash on hand. In comparison, a recent analysis from KFF found that financially strong health systems carried at least 150 days of cash on hand in 2022.

Liquidity is a concern for CFOs given high rates of bond and loan covenant violations over the past year. More than half of organizations violated such agreements in 2023, while 41% are concerned they will in 2024, according to the report. 

To remain solvent, 44% of CFOs expect to have more strategic conversations about their economic resiliency in 2024, exploring external partnerships, options for service line adjustments and investments in workforce and technology optimization.

The majority of CFOs surveyed are interested in pursuing external partnerships, despite increased regulatory roadblocks, including recent merger guidance that increased oversight into nontraditional tie-ups. Last week, the FTC filed its first healthcare suit of the year to block the acquisition of two North Carolina-based Community Health Systems hospitals by Novant Health, warning the deal could reduce competition in the region.

Healthcare CFOs explore tie-ups in 2024

Types of deals that CFOs are exploring, as of Oct. 2023.

https://datawrapper.dwcdn.net/aiFBJ/1

Most organizations are interested in exploring sales, according to the report. Financially struggling organizations are among the most likely to consider deals. Nearly one in three organizations that violated their bond or loan covenants in 2023 are planning a carve-out or divestiture this year. Organizations with less than 30 days of cash on hand are also likely to consider carve-outs.

Organizations will also turn to automation to cut costs. Ninety-eight percent of organizations surveyed had piloted generative AI tools in a bid to alleviate resource and cost constraints, according to the consultancy. 

Healthcare leaders believe AI will be essential to helping clinicians operate at the top of their licenses, focusing their time on patient care and interaction over administrative or repetitive tasks,” authors wrote. Nearly one in three CFOs plan to leverage automation and AI in the next 12 months.

However, CFOs are keeping an eye on the risks. As more data flows through their organizations, they are increasingly concerned about cybersecurity. More than half of executives surveyed said data breaches are a bigger risk in 2024 compared to 2023.

Credit and Capital Markets Outlook for 2024

For many providers, 2023 provided a return to profitability (albeit at modest levels) following the devastating operating and investment losses experienced in 2022. Kaufman Hall’s National Hospital Flash Report data illustrated generally improving operating margins throughout the year, leveling off at 2.0% in November on a year-to-date basis.

This level of performance is commendable given 2022 and early 2023 margins, although it is still well below the 3% to 4% range which we believe is needed for long-term sustainability in the not-for-profit healthcare world. We may well have reached a point of stability with respect to operating performance, but at a lower level.

The question for hospital and health system leaders is whether this level of operating stability provides sustainability?

From stabilization to normalization

Since the pandemic began in 2020, the progress of recovery has been viewed over three phases: crisis, stabilization, and normalization. In last year’s outlook, we noted that we were in the midst of a potentially multi-year stabilization phase, which would continue to be marked with volatility—including ongoing labor market dislocations, inflationary pressures, and restrictive monetary policies. As we enter 2024, there are signs that we are now at the bridge between stabilization and normalization (Figure 1).

Figure 1: The Three Phases of Recovery from the Covid Pandemic

“The question for hospital and health system leaders is whether that level of stability provides sustainability?”

These signs include evidence that the first two indicators for normalization—a recalibrated or stabilized workforce environment and a return from an erratic interest rate environment—are coming into place. In our 2023 State of Healthcare Performance Improvement survey, respondents indicated that the spike in contract labor utilization that has been a dominant factor in operating expense increases was subsiding. Sixty percent of respondents said that utilization of contract labor was decreasing, and 36% said it was holding steady. Only 4% noted an increase in contract labor usage. Overall employee cost inflation seems to be subsiding as well: for all three labor categories in our survey (clinical, administrative, and support services), more organizations were able to hold salary increases to the 0% – 5% range in 2023 than in 2022.

There is good news on the interest rate front as well. After a series of rate increases in 2023, the Federal Reserve has held steady the last six months and has signaled rate cuts in 2024. Inflation has cooled markedly (albeit not yet at target levels), and employment rates have held steady. The Fed may have achieved a “soft landing” that satisfies its dual mandate of stable prices and maximum sustainable employment. Borrowing costs for not-for-profit hospital issuers have declined nearly 100 basis points in the last two months and we are expecting a return to more normal issuance levels in the first half of 2024.

There are other indications of normalization, including in the rating agencies’ outlooks for 2024. Regardless of the headline, all saw significant improvement in healthcare performance 2023.

The final answer to the question of whether the healthcare industry is entering the normalization phase likely will hinge on the last two indicators. Will we see a return of normalized strategic capital investments, and will we see a revival of strategic initiatives driving the core business (perhaps newly imagined)?

In effect, are health care systems simply surviving or are they thriving?

Looking forward, several factors could either bolster or undermine healthcare leaders’ confidence and willingness to resume a more normal level of investment in both capital needs and strategic growth. These include:

  • Politics and the 2024 elections. When North Carolina—a state that has traditionally leaned “red”—decided to opt into the Affordable Care Act’s (ACA’s) Medicaid expansion in 2023, it seemed that political debates over the ACA might be in the rearview mirror. But last November, former president Trump—currently the leading candidate for the Republican presidential nomination after strong wins in the Iowa caucuses and New Hampshire primary—indicated his intent to replace the ACA with something else. President Biden is now making protection and expansion of the ACA a key part of his 2024 campaign. What had appeared to be a settled issue may be a significant point of contention in the 2024 presidential election and beyond.

Although we do not anticipate any significant healthcare-related legislation in advance of the 2024 elections, healthcare leaders should be prepared for renewed attention to the costs of government-funded healthcare programs leading up to and following the elections. The national debt has increased rapidly over the past 20 years, tripling from $11 trillion in 2003 to $33 trillion in 2023. If the deficit and national debt become an important issue in the election, a move toward a balanced budget—akin to the Balanced Budget Act of 1997—post election could lead to further cuts to Medicare and Medicaid.

  • Temporary relief payments. Health systems continue to receive one-time cash infusions through the 340B settlement, Federal Emergency Management Agency (FEMA) payments and other governmental programs. Approximately 1,600 hospitals have or will be receiving a lump-sum payment to compensate them for a change in the Department of Health & Human Services’ (HHS’s) reimbursement rates for the 340B program from 2018 to 2022, which was ruled unlawful by the Supreme Court in a 2022 decision. The total amount to be distributed is approximately $9 billion and began hitting bank accounts in January 2024.

But what the right hand giveth, the left hand taketh away. Budget neutrality requirements will force HHS to recoup this offset—amounting to approximately $7.8 billion—which it will do by reducing payments for non-drug items and services to all Outpatient Prospective Payment System (OPPS) providers by 0.5% until the offset has been fully recouped, beginning in calendar year 2026. HHS estimates that this process will take approximately 16 years. Is this a harbinger of lower payments on other key governmental programs?

Many hospitals also continue to receive Covid-related payments from FEMA for expenses occurred during the pandemic. In addition, state supplemental payments—especially under Medicaid managed care and fee-for-service programs—are providing some relief. The Centers for Medicare & Medicaid Services has issued a proposed rule, however, that would limit states’ use of provider-based funding sources, such as provider taxes, and cap the rate of growth for state-directed payments. 

As all of these payment programs dry up over the next few years, hospitals will need to replace the revenue and/or get leaner on the expense side in order to maintain today’s level of performance.

  • The hollowing of the commercial health insurance market. Our colleague, Joyjit Saha Choudhury, recently published a blog on the hollowing of the commercial health insurance market, driven by long-term concerns over the affordability of healthcare. While volumes have been recovering to pre-pandemic levels, this hollowing threatens the loss of the most profitable volumes and will pressure hospitals and health systems to create and deliver value, compete for inclusion in narrow networks, and develop more direct relationships with the employer community.

Related, the growing penetration of Medicare Advantage plans is reducing the number of traditional Medicare beneficiaries. Many CFOs report that these programs can be the most difficult with which to work given their high denial rates and required pre-authorization rates. A new rule requiring insurers to streamline prior authorizations for Medicare Advantage, Medicaid, and Affordable Care Act plans may help alleviate this issue; however, it will be incumbent upon management teams to stay ahead of them. Aging demographics are also reducing the percentage of commercially insured patients for many hospitals and health systems, further exacerbating the problem. This combination of fewer commercial patients (who often subsidize governmental patients) and more pressure on receiving the duly owed commercial revenue threatens to be an ongoing headache for management teams.

  • Ongoing impact of the Baby Boom generation. Despite the good news on inflation—and indications that the Fed may begin lowering interest rates in 2024—the economy is by no means out of the woods yet. The Baby Boom generation, which holds more than 50% of the wealth in the U.S. and is seemingly price agnostic, still has many years of spending ahead, in healthcare and general purchasing. This will likely continue to pressure inflation, especially in the healthcare sector, where demand will continue to grow. As the generation starts to shrink, the resulting wealth transfer will be the largest ever in our country’s history and have profound (and unforeseen) consequences on the overall economy and healthcare in general.

In sum, these other factors will continue to affect the sector (both positively and negatively) and require health system management teams to navigate an everchanging world. While many signs point toward short-term relief, the longer-term challenges persist. Improvements in the short term may, however, provide the opportunity to reposition organizations for the future.

How hospitals and health systems should respond

Healthcare leaders should view ongoing uncertainty in the political and economic climate as a tailwind as much as a headwind. This uncertainty, in other words, should be a motivation to put in place strategies that will buffer healthcare organizations from potential bumps in the road ahead. Setting balance sheet strategy should be a part of an organization’s planning process.

How an organization sets that strategy, measures its performance, and makes improvements will set apart top-performing organizations. 

Although heightened debt issuance early in 2024 signals a return for many systems to a climate of investment, there is still limited energy around strategy and debt conversations in many boardrooms, especially in those organizations where financial improvement continues to lag. The last two years have illustrated that hospitals and health systems will not be able to cut their way to profitability. Lackluster performance cannot and will not improve without some level of strategic change, whether it is through market share gains, payer mix shift, or operational improvements. This strategic change requires investment and investment requires capital. Capital can be obtained in many forms—whether through growth in capital reserves, improved cash flow, or new debt issuance—but is essential for change. Reengaging in conversations about strategy and growth should be an imperative in 2024 and will require reexamining how that growth is funded.

Healthcare leaders should engage their partners as they continue or refocus on:

  • Changing the conversation from debt capacity to capital capacity. Management teams need to determine what they can afford to spend on capital if the new normal of cash flow will be constrained going forward. Capital capacity is and should be agnostic to the source of that capital, such as debt, cash flow from operations, or liquidity reserves. Healthcare leaders must focus on what they can spend, before deciding how to fund that spending. The conversation will need to balance investment for the future with maintaining key credit metrics in the short term.
  • Conducting a capitalization analysis. Separate but related to the previous entry, how much leverage should your organization have relative to its overall capitalization? Ostensibly, many organizations have been paying principal while curtailing borrowing needs, so capitalization may have improved. While that may be the case, many organizations have depleted reserves and/or experienced investment losses that have reduced capitalization. Understanding where the organization stands is an essential next step.
  • Evaluating surplus returnConsider surplus return as investment income net of interest expense. Organizations should evaluate their ability to reliably generate both operating cash flow and net surplus. How an organization’s balance sheet is positioned to generate returns and manage risk will be a critical success factor.   
  • Focusing on the metrics that matter. These include operating cashflow margin, cash to debt, debt to revenue, and days cash on hand. As key metrics for rating analysts and investors continue to evolve, management teams need to make sure they are focused on the correct numbers. The discussion should be dually focused on ensuring adequate-to-ample headroom to basic financial covenants as well as a comparison to key medians and peers. Strong financial planning will address how these metrics can be improved over time through synergies, growth, and diversification strategies.

Although it has been a difficult few years, hospitals and health systems seem to have moved onto a more stable footing over the last twelve months. In order to build upon the upward trajectory, now is the time to harness strategy, planning, and investment to move organizations from stability to sustainability.

Unlocking Value in Non-Core Healthcare Assets

Inflation, labor pressures, and general economic uncertainty have created
significant financial strain for hospitals in the wake of the COVID pandemic.
Compressed operating margins and weakened liquidity have left many
hospitals in a precarious economic situation, with some entities deciding to delay or even cancel planned capital expenditures or capital raising. Given these tumultuous times, hospital entities could look to the realm of the higher education sector for a playbook on how to leverage non-core assets to unlock significant unrealized value and strengthen financial positions, in the form of public-private partnerships.


These structures, also known as P3s, involve collaborative agreements between public entities, like hospitals, and private sector partners who possess the expertise to unlock the value of non-core assets. A special purpose vehicle (SPV) is created, with the sole purpose of delivering the responsibilities outlined under the project agreement. The SPV is typically owned by equity members. The private sector would be responsible for raising debt to finance the project, which is secured by the obligations of the project agreement (and would be non-recourse to the hospital). Of note, the SPV undergoes the rating process, not the hospital entity. Even more importantly, the hospital retains ownership of the asset while benefiting from the expertise and resources of the private sector.


Hospitals can utilize P3s to capitalize on already-built assets, in what is known as a “brownfield” structure. A brownfield structure would typically result in an upfront payment to the hospital in exchange for the right of a private entity to operate the asset for an agreed-upon term. These upfront payments can range from tens of millions to hundreds of millions of dollars.


Alternatively, hospitals can engage in “greenfield” structures where the underlying asset is either not yet built or needs significant capital investment. Greenfield structures typically do not result in an upfront payment to the hospital entity. Instead, (in the example of a new build) private partners would typically design, build, finance, operate and maintain the asset. The hospital still retains ownership of the underlying asset at the completion of the agreed upon term.


P3 structures can be individually tailored to suit the unique needs of the hospital entity, and the resulting benefits are multifaceted. Financially, hospitals can increase liquidity, lower operating expenses, increase debt capacity, and create headroom for financial covenants. These partnerships provide a means to raise funds without directly accessing the capital markets or undergoing the rating process. Upfront payments represent unrestricted funds and can be used as the hospital entity sees fit to further its core mission. Operationally, infrastructure P3s offer hospitals the opportunity to address deferred maintenance needs, which may have accumulated over time. Immediate capital expenditure on infrastructure facilities can enhance reliability and efficiency and contribute to meeting carbon reduction or sustainability goals. Furthermore, these structures provide a means for the hospital to transfer a meaningful amount of risk to private partners via operation and maintenance agreements.


For years, various colleges and universities have adopted the P3 model, which is emerging as a viable solution for hospitals as well.
Examples of recent structures in the higher education sector include:

  • Fresno State University, which partnered with Meridiam (an infrastructure private equity fund) and Noresco (a design builder) to
    deliver a new central utility plant. The 30-year agreement involved long-term routine and major maintenance obligations from
    the operator, with provisions for key performance indicators and performance deductions inserted to protect the university.
    Fresno State is not required to begin making availability payments until construction is completed.
  • The Ohio State University, which secured a $483 million upfront payment in exchange for the right of a private party to operate
    and maintain its parking infrastructure. The university used the influx of capital to hire key faculty members and to invest in their
    endowment.
  • The University of Toledo, which received an approximately $60 million upfront payment in exchange for a 35-year lease and
    concession agreement to a private operator. The private team will be responsible for operating and maintaining the university’s
    parking facilities throughout the term of the agreement.

  • Ultimately, healthcare entities can learn from the successful implementation of infrastructure P3 structures in the higher education sector. The experiences of Fresno State, The Ohio State University, and the University of Toledo (among others) serve as compelling examples of the transformative potential of P3s in the healthcare sector. By unlocking the true value of non-core assets through partnerships with the private sector, hospitals can reinforce their financial stability, meet sustainability goals, reduce risk, and shift valuable focus back to the core mission of providing high-quality healthcare services.

  • Author’s note: Implementing P3 structures requires careful consideration and expert guidance. Given the complex nature of these partnerships, hospitals can greatly benefit from the support of experienced advisors to navigate the intricacies of the process. KeyBank and Cain Brothers specialize in guiding entities through P3 initiatives, providing valuable expertise and insight. For additional information, please refer to a recording of our recent webinar and associated summary, which can be accessed here:
    https://www.key.com/businesses-institutions/business-expertise/articles/public-private-partnerships-can-unlock-hospitals-hiddenvalue.html

Financial Reserves as a Buffer for Disruptions in Operation and Investment Income

For the first time in recent history, we saw all three
functions of the not-for-profit healthcare system’s
financial structure suffer significant and sustained
dislocation over the course of the year 2022
(Figure above).

The headwinds disrupting these functions
are carrying over into 2023, and it is uncertain how
long they will continue to erode the operating and
financial performance of not-for-profit hospitals
and health systems.


Ÿ The Operating Function is challenged by elevated
expenses, uncertain recovery of service volumes, and
an escalating and diversified competitive environment.


Ÿ The Finance Function is challenged by a more
difficult credit environment (all three rating agencies

now have a negative perspective on the not-forprofit healthcare sector), rising rates for debt, and
a diminished investor appetite for new healthcare
debt issuance. Total healthcare debt issuance in
2022 was $28 billion, down sharply from a trailing
two-year average of $46 billion.


Ÿ The Investment Function is challenged by volatility and
heightened risk in markets concerned with the Federal
Reserve’s tightening of monetary policy and the
prospect of a recession. The S&P 500—a major stock
index—was down almost 20% in 2022. Investments
had served as a “resiliency anchor” during the first
two years of the pandemic; their ability to continue
to serve that function is now in question.

A significant factor in Operating Function challenges is
labor:
both increases in the cost of labor and staffing
shortages that are forcing many organizations to
run at less than full capacity. In Kaufman Hall’s 2022
State of Healthcare Performance Improvement Survey, for
example, 67% of respondents had seen year-over-year
increases of more than 10% for clinical staff wages,
and 66% reported that they had run their facilities at
less-than-full capacity because of staffing shortages.


These are long-term challenges,

dependent in part on
increasing the pipeline of new talent entering healthcare
professions, and they will not be quickly resolved.
Recovery of returns from the Investment Function
is similarly uncertain. Ideally, not-for-profit health
systems can maintain a one-way flow of funds into
the Investment Function, continuing to build the
basis that generates returns. Organizations must now
contemplate flows in the other direction to access

funds needed to cover operating losses, which in
many cases would involve selling invested assets at a
loss in a down market and reducing the basis available
to generate returns when markets recover.


The current situation demonstrates why financial
reserves are so important:

many not-for-profit
hospitals and health systems will have to rely on
them to cover losses until they can reach a point
where operations and markets have stabilized, or
they have been able to adjust their business to a
new, lower margin environment. As noted above,
relief funding and the MAAP program helped bolster
financial reserves after the initial shock of the
pandemic. As the impact of relief funding wanes
and organizations repay remaining balances under
the MAAP program, Days Cash on Hand has begun
to shrink, and the need to cover operating losses is
hastening this decline. From its highest

point in 2021, Days Cash on Hand had decreased, as
of September 2022, by:


Ÿ 29% at the 75th percentile, declining from 302 to 216
DCOH (a drop of 86 days)


Ÿ 28% at the 50th percentile, declining from 202 to 147
DCOH (a drop of 55 days)


Ÿ 49% at the 25th percentile, declining from 67 to 34
DCOH (a drop of 33 days)


Financial reserves are playing the role
for which they were intended; the only
question is whether enough not-for-profit
hospitals and health systems have built
sufficient reserves to carry them through
what is likely to be a protracted period of
recovery from the pandemic.

KEY TAKEAWAYS

All three functions of the not-for-profit healthcare
system’s financial structure—operations, finance,
and investments—suffered significant and
sustained dislocation over the course of 2022.


Ÿ These headwinds will continue to challenge not-forprofit

hospitals and health systems well into 2023.

Ÿ Days Cash on Hand is showing a steady decline, as
the impact of relief funding recedes and the need
to cover operating losses persists.


Ÿ Financial reserves are playing a critical role in
covering operating losses as hospitals and health
systems struggle to stabilize their operational and
financial performance.

Conclusion

Not-for-profit hospitals and health systems serve
many community needs. They provide patients
access to healthcare when and where they need it.
They invest in new technologies and treatments that
offer patients and their families lifesaving advances
in care. They offer career opportunities to a broad
range of highly skilled professionals, supporting the
economic health of the communities they serve.


These services and investments are expensive and
cannot be covered solely by the revenue received
from providing care to patients.


Strong financial reserves are the foundation of good
financial stewardship for not-for-profit hospitals and
health systems.

Financial reserves help fund needed
investments in facilities and technology, improve an
organization’s debt capacity, enable better access to
capital at more affordable interest rates, and provide a
critical resource to meet expenses when organizations
need to bridge periods of operational disruption or
financial distress.
Many hospitals and health systems today are relying
on the strength of their reserves to navigate a difficult

environment; without these reserves, they would
not be able to meet their expenses and would be at
risk of closure.

Financial reserves, in other words,
are serving the very purpose for which they are
intended—ensuring that hospitals and health systems
can continue to serve their communities in the face of
challenging operational and financial headwinds.

When these headwinds have subsided, rebuilding these
reserves should be a top priority to ensure that our
not-for-profit hospitals and health systems can remain
a vital resource for the communities they serve.

Financial Reserves and Credit Management

For large capital projects—construction of a new cancer
treatment center, for example, or replacement of an
aging facility—issuance of municipal debt is one of the
most affordable ways for not-for-profit hospitals and
health system to finance the project
.

The affordability of that debt is, however, partly contingent on the
organization’s ability to maintain a strong credit rating,
and financial reserves—again measured as Days Cash on
Hand—are a significant component of that credit rating.


There are two basic forms of municipal debt:


Ÿ General obligation bonds are backed by the full
taxing power of the issuing municipal authority and
are considered relatively low risk. Hospitals that are
owned by a city or county can be funded by general
obligation bonds, although there are practical
limitations on their ability to issue these bonds,
including in many instances the need to obtain voter
or county commissioner approval. Organizations

without municipal ownership—including most
not-for-profit hospitals and health systems—
cannot issue general obligation bonds.


Ÿ Revenue-backed municipal bonds are backed by
the ability of the organization borrowing the debt
to meet its obligation to make principal and interest
payments through the revenue it generates over the
life of the bond. Because revenues can be disrupted
by any range of factors, revenue-backed bonds are
higher risk for investors. Most healthcare bonds
are revenue-backed municipal bonds.


When determining whether to invest in revenue-backed
municipal healthcare bonds, investors will look to the
credit rating of the hospital or health system that is
borrowing the debt. Credit ratings—issued by one or
more of the three major credit rating agencies (Fitch
Ratings, Moody’s Investors Service, and S&P Global
Ratings)—provide an assessment of the probability

that the hospital or health system will be able to meet
the terms of the debt obligation. These ratings are
tiered. A credit rating in the AA tier is better than a credit
rating in the A tier, which is better than a rating in the
BBB tier. Ratings below the BBB tier are considered sub-investment grade.

Organizations with a sub-investment
grade rating can still access various forms of debt,
but the amount of debt they can access generally will
be lower, the cost of the debt will be higher, and the
covenants that lenders require will be more stringent
than for investment-grade rated organizations.


Financial reserves and credit ratings


Days Cash on Hand is one of the most important factors
credit rating agencies use because it is an indicator
of how long the rated organization could withstand
serious disruption to its operations and cashflow.
The rating agencies issue median values for the various
metrics they use to determine credit ratings. Median

values for Days Cash on Hand increased significantly
across most rating categories for all three agencies
in 2020 and 2021; this reflects the temporary inflow
of pandemic relief funding through, for example,
the Coronavirus Aid, Relief, and Economic Security
(CARES) Act.


We anticipate these medians will move
closer to pre-pandemic levels as relief funds are
exhausted and hospitals repay remaining balances
on Medicare’s COVID-19 Accelerated and Advanced
Payment (MAAP) program funds. But even before
the pandemic, organizations in 2019 had a median
Days Cash on Hand
of 276 to 289 days at the AA level,
173 to 219 days at the A level, and 140 to 163 days at
the BBB level.


In other words, the Days Cash on Hand
benchmark for organizations seeking to maintain an
investment-grade rating would be well over 100 Days
Cash on Hand, and well over 200 Days Cash on Hand for
organizations seeking to achieve a higher rating level.
Again, these reserves are proportionate to the operating
expenses of the individual hospital or health system.

Impact of credit ratings on access to capital


Organizations that can achieve a higher rating can
also borrow money at more affordable interest
rates. Figure 3 shows average interest rates for
municipal bonds across a range of maturities as of
mid-December 2022 (maturity is the term in years
for repayment of the bond at the time the bond is
issued). Lower-risk general obligation municipal bonds
are shown as the baseline, with lines for AA, A, and
BBB rated healthcare revenue-backed bonds above
it. As a reminder, most hospitals and health systems
cannot borrow money using general obligation bonds;
instead, they use higher-risk revenue-backed bonds
.
Because revenue-backed bonds are a higher risk for
investors than tax-based general obligation bonds,

even hospitals and health systems with a strong
AA credit rating will pay a higher interest rate than
would a city or county that could back repayment of
the bond with tax revenues (see the line for AA rated
Healthcare Revenue Bonds compared to the line
for AAA rated General Obligation bonds). But there
is also a significant gap between the interest rate a
hospital with an AA credit rating would pay compared
to the interest rate available to a hospital with a lower
BBB rating
. Here, the difference is approximately
three-fourths of a full percentage point. When the
amount borrowed for a major new hospital project
can run into the hundreds of millions of dollars,
that difference represents significant savings for
organizations with a higher credit rating.

Financial reserves and debt capacity


Financial reserves and the funds they generate—
including investment income—also help define an
organization’s debt capacity: essentially, the amount of
debt an organization can assume without jeopardizing
its current credit rating. There are two key ratios here:


Ÿ The first is total unrestricted cash and investments
to debt.
In general, the more favorable that ratio is,
the more latitude a hospital or health system has to
take on additional debt, especially if the organization
is toward the middle to top end of its rating tier.

Ÿ The second is the debt service coverage ratio,
which measures the organization’s ability to
make principal and interest payments with funds
derived from both operating and non-operating
(e.g., investment income) activity. A higher ratio
here means the organization has more funds
available to service debt.


The ability to assume additional debt is an important
safety valve
if, for example, an organization needs to
mitigate poor financial performance to fund ongoing
capital needs or strategic initiatives.

KEY TAKEAWAYS

Not-for-profit hospitals and health systems often
borrow debt through revenue-backed municipal
bonds, meaning that the debt obligations will be
met by the revenue the organization generates
over the life of the bond.


Ÿ Because revenue-backed bonds are higher
risk than general obligation bonds
backed by a
municipality’s taxing authority (revenues can
be disrupted), investors seek assurance that an
organization will be able to meet its obligations.


Ÿ Credit ratings offer investors an assessment of
an organization’s current and near-term ability to
meet these obligations.

Ÿ Days Cash on Hand is an important metric in
assessing the organization’s credit rating, and a
higher rating generally requires a higher number of
Days Cash on Hand.


Ÿ A higher credit rating allows organizations to
borrow money at more affordable interest rates.


Ÿ A higher level of financial reserves and investment
income in relation to existing debt obligations also
increases an organization’s debt capacity, creating
an important safety valve if an organization has
to borrow money to mitigate poor operating or
investment performance.

The Financial Structure of Not-for-Profit Hospitals and Health Systems

Not-for-profit hospitals and health systems rely on
three interdependent functions to contribute to the
financial resilience of the organization: namely, the
ability to withstand adverse changes to these core
functions and continue to provide services to the
community (Figure above).


Ÿ The Operating Function:

The Operating Function
manages the portfolio of clinical services and
strategic initiatives that define the charitable mission
of the organization
. Clinical services generate
patient revenue, and if that revenue creates a
positive margin (i.e., exceeds expenses), that excess
is invested back into the health system. Operating
margins are, on average, very low in not-for-profit
healthcare.
For example, for the not-for-profit
hospitals and health systems rated by Moody’s
Investors Service, median operating margins from
2017–2021 ranged between 2.1% and 2.9%
. These
rated organizations represent only a few hundred
of the thousands of hospitals and health systems
in the country and are among the most financially
healthy. A 2018 study of a wider group of more than
2,800 hospitals found an average clinical operating
margin of -2.7%.


Ÿ The Finance Function:

Because the positive margins
generated by the Operating Function are rarely
enough to support the intensive capital needs of
maintaining and improving acute-care facilities, care
delivery models, and technology, not-for-profit health
systems rely on the Finance Function for internal
and external capital formation. The Finance Function
builds cash reserves and secures external financing

(e.g., bond proceeds, bank lines of credit) to support
the capital spending needs of the organization.
The
cash reserves maintained by the Finance Function
also help the organization meet daily expenses at
times when expenses exceed revenues.


Ÿ The Investment Function:

Not-for-profit hospitals
and health systems will also endeavor to invest
some of their cash reserves to generate returns
that, first, act as an additional hedge against
potential risks that could disrupt operations or cash
flow, and second, pursue independent returns.

Any independent returns generated serve as an
important supplement to revenues generated
through the Operating Function.

The three functions described above are common to
all not-for-profit organizations.
The main differences
are mostly within the Operating Function. In higher
education, for example, tuition revenue takes the
place of clinical revenue. While higher education also
maintains enterprise risk, the Operating Function
for colleges and universities is less vulnerable to
volume swings as enrollment is typically steady and
predictable. Likewise, higher education is less labor
intensive than healthcare.

Financial reserves include all liquid cash resources
and unrestricted investments held in the Finance and
Investment Functions. These reserves are equivalent
to the emergency funds
individuals are encouraged
to maintain to help them meet living expenses for
six to twelve months in case of a job loss or other
disruption to income.


Absolute reserve levels are important, as discussed
above, but they must also be viewed relative to
a hospital’s daily operating expenses. A common

metric used to describe these reserves is Days Cash
on Hand.
If an organization has 250 Days Cash on
Hand, that means that it would be able to meet its
operating expenses for 250 days if revenue was
suddenly shut off. The size of Days Cash on Hand will
be proportionate to the size of the hospital and health
system. Some of the largest not-for-profit health
systems have annual operating expenses approaching
$30 billion annually: meeting those expenses for 250
days would require Days Cash on Hand of more than
$20 billion.


The shutdown that occurred in the early days of the
pandemic (March through May 2020) is an example
of a time when cash flow nearly shut off for most
hospitals (except for emergency care). Reserves,
measured in absolute and relative terms such as
Days Cash on Hand, allowed hospitals that were
nearly empty to maintain staffing and operations
throughout the period.
Other hospitals that were
inundated with patients during the initial surge
were able to fund increased staffing and personal
protective equipment costs through their reserves.
Other examples of how reserves provide a buffer

against unexpected events include natural disasters
such as hurricanes, tornadoes, deep freezes, and
wildfires, which can require the temporary shutdown
of operations; cyberattacks, which can halt a hospital’s
ability to provide services; a defunct payer that is unable
to reimburse hospitals for care already provided; or an
escalation in labor costs as experienced by many during 2022.

Without the reserves to pay for contract labor or
premium pay, many hospitals would have undoubtedly
had to close or limit services to their community.

KEY TAKEAWAYS

Ÿ Financial reserves are created through the
interdependent relationship of operating, finance,
and investment functions in not-for-profit health
systems.


Ÿ These reserves build financial resilience: the ability
to withstand adverse changes to core functions and
continue to provide services to the community.


Ÿ Financial reserves play an important role in
supplementing any shortfalls
in revenue or capital
formation in one or more of these three functions.

Ÿ Financial reserves are equivalent to individual
emergency funds—both are intended to cover
expenses if income or revenue flows are
significantly disrupted.


Ÿ A common metric used to describe financial
reserves is Days Cash on Hand: an organization’s
combined liquid, unrestricted cash resources and
investments, measured by how many days these
reserves could cover operating expenses if cash
flows were suddenly shut off.

Financial reserves, measured in absolute
and relative terms such as Days Cash
on Hand, allowed hospitals that were
nearly empty during the early days of
the pandemic to maintain staffing and
operations throughout the period. Other
hospitals that were inundated with patients
during the initial surge were able to fund
increased staffing and personal protective
equipment costs through their reserves.

A Comparison: Financial Reserves and Higher Education Not-for-Profits

Not-for-profit hospitals and health systems are
not alone in their reliance on financial reserves;

most not-for-profit organizations carry reserves
that enable them to maintain operations and
make needed investments even in times of weaker
operating performance. Higher education is
probably most comparable to healthcare
, with
significant overlaps between the two sectors.
Moody’s Investors Service, one of the three major
rating agencies, notes that 16% of its rated higher
education institutions have affiliated academic
medical centers (AMCs), and revenue from patient
care at these AMCs contributes to 28% of the
overall revenues for the higher education sector.


The magnitude of Days Cash on Hand levels
varies by industry; financial reserves maintained
by private not-for-profit higher education

institutions, for example, are significantly greater
than those maintained by not-for-profit hospitals
and health systems.
For comprehensive private
universities across all rating categories, Moody’s
reports median Days Cash on Hand in 2021 of 498
days for assets that could be liquidated within a
year. This compares with a median 265 Days Cash
on Hand in 2021 across all freestanding hospitals,
single-state, and multi-state healthcare systems
rated by Moody’s.


Financial reserves are a critical measure of
financial health across both healthcare and higher
education.
They help ensure that not-for-profit
colleges, universities, hospitals, and health systems
can continue to fulfill their vital societal functions
when operations are disrupted, or when they are
experiencing a period of sustained financial distress.

Thomas Jefferson University reports $83.5M Q3 loss, health system patient volumes up

Philadelphia-based Thomas Jefferson University, including Jefferson Health, reported a multimillion-dollar loss in the third quarter ending Sept. 30.

Five things to know:

1. Thomas Jefferson University reported an $83.5 million loss for the quarter, down significantly from a $12.8 million gain in the same period last year.

2. Thomas Jefferson University reported $29.9 million in operating revenue. Clinical operations reported an $87.3 million loss from operations, and the insurance operations reported a $7.1 million gain for the quarter.

3. The organization reported a -3.7 percent operating margin, compared to 0.9 percent for the third quarter last year.

4. Hospital inpatient admissions grew 30.4 percent year over year to 39,463 cases for the quarter. Outpatient observations were also up 21.6 percent to 11,744 cases. Outpatient visits were up 36 percent year over year to 524,200 visits.

5. Days cash on hand for clinical operations dropped by nearly 11 days since the start of the fiscal year to 158.5 days due to nonoperating investment losses and repaying Medicare advance payments.

Health system cash reserves plummet

Cash reserves, an important indicator of financial stability, are dropping for hospitals and health systems across the U.S.

Both large and small health systems are affected by rising labor and supply costs while reimbursement remains low. St. Louis-based Ascension reported days cash on hand dropped from 336 at the end of the 2021 fiscal year to 259 as of June 30, 2022, the end of the fiscal year. The system also reported accounts receivable increased three days from 47.3 in 2021 to 50.3 in 2022 because commercial payers were slow, especially in large dollar claims.

Trinity Health, based in Livonia, Mich., also reported days cash on hand dropped to 211 in fiscal year 2022, ending June 30, compared to 254 days at the end of 2021. Trinity attributed the 43-day decrease in cash on hand to “investment losses and the recoupment of the majority of the Medicare cash advances.”

Chicago-based CommonSpirit Health reported days cash on hand decreased by 69 days in the last year. The 140-hospital health system reported 245 days cash on hand at the 2021 fiscal year’s end June 30, and 176 days for 2022.

Lehigh Valley Health Network in Allentown, Pa., said unfavorable trends in the capital market led to investment losses and a drop in days cash on hand from 216 to 150 days in the 2022 fiscal year ending June 30. The health system also had a scheduled repayment of $191.1 million in advance Medicare dollars as well as $25 million in deferred payroll tax payments.

Philadelphia-based Thomas Jefferson University reported cash on hand for clinical operations dropped by 10.9 days in just the last quarter due to nonoperating investment losses and repaying government advances, which equaled about five days cash on hand. The health system reported 158.5 days cash on hand as of Sept. 30.

While the large health systems’ days cash on hand are dropping, they still have deep reserves. Smaller hospitals and health systems are in a more dire situation. Doylestown (Pa.) Hospital reported as of Sept. 30 the system had 81 days cash on hand, and Moody’s downgraded the hospital in June after the days cash on hand dropped below 100.

Kaweah Health in Visalia, Calif., saw reserves plummet since the pandemic began from 130 to 84 days cash on hand. Gary Herbst, CEO of Kaweah Health, blamed lost elective procedures, high labor costs, inflation and more for the system’s financial issues.

“The COVID-19 pandemic, and its aftermath, have brought District hospitals to the brink of financial collapse,” Mr. Herbst wrote in an open letter to Gov. Gavin Newsom published in the Visalia Times Delta. He asked Mr. Newsom to provide additional funding for public district hospitals. “Without your help, it will soon be virtually impossible for Medi-Cal patients to receive anything but emergency medical care in the State of California.”