In just 2020, deaths from gun violence cost the U.S. healthcare system $290 million, or about $6,400 per patient, according to a report from the Commonwealth Fund. These costs are mostly covered by Medicaid and other government insurance programs.
The U.S. healthcare system sees about 30,000 inpatient hospital stays and 50,000 emergency room visits due to gun violence each year, leading to more than $1 billion in initial medical costs, according to a new analysis.
The Commonwealth Fund published these results last week and relied on three data sources for its analysis: the 2019 Global Burden of Disease study, the Small Arms Survey and the U.S. Government Accountability Office.
Even after leaving the hospital, patients are faced with challenges. A year after a gun injury, medical spending rises about $2,495 per person per month. In addition, those who suffer firearm injuries are more likely to form mental health challenges and substance use disorders.
“The impact of gun violence reaches far beyond the hospital room,” the analysis states.
Firearm-related deaths are increasing, according to the Centers for Disease Control and Prevention. In 2021, almost 49,000 Americans died from firearms, compared to 45,000 in 2020.
Additional findings from the report include:
In 2019, the U.S. had a higher rate of firearm deaths than any other country. Its rate of firearm deaths was almost five times as much as France, the second-highest country.
Eight times more people in the U.S. died from firearm violence in 2019 compared to Canada, the second-highest country.
More people died from self-harm by firearm in the U.S. than any other country in 2019, more than three times higher than France and Switzerland.
More women were killed by guns in the U.S. than any other country in 2019.
In the U.S., there are 67 million more firearms than people. That difference is higher than the population of the United Kingdom, which has 66.2 million people.
In the U.S., 52% of people who are admitted to hospitals for firearm injuries are Black, 29% are White, 14% are Hispanic and 5% are another race or ethnicity. Black Americans account for 50% of firearm injury hospital costs, while White Americans account for 27%, Hispanic Americans account for 17% and other races or ethnicities account for 6%.
About 48% of firearm-related inpatient hospital stays are in the American South, while 20% are in the Midwest, 20% are in the West and 12% are in the Northeast. The South accounts for 44% of firearm injury hospital costs, while the West accounts for 26%, the Midwest accounts for 18% and the Northeast accounts for 11%.
Over the past seven years, Medicare Advantage’s (MA’s) enrollment has almost doubled, adding 10 percent to its market share , now at 49 percent. Rebates, the additional dollars paid by CMS to MA plans that bid beneath their “benchmark,” have doubled in that time from $80 per beneficiary per month (PBPM) to $164. (Benchmarks are intended to represent the average per-beneficiary spending in traditional Medicare (TM) in a given service area.)
The Medicare Advantage industry’s explanation of its success is grounded in claims about MA’s ability to deliver Medicare Part A and B benefits for much less than TM. These savings are, in theory, the basis for the rebates, the incremental revenue CMS pays to plans that fund the improved benefits and lower premiums as compared to TM, which in turn help attract members to MA plans. Indeed, the Medicare Payment Advisory Commission (MedPAC) reports that MA bids average 85 percent of the FFS cost. Because these bids include approximately 15 percent for administrative costs and profits, they imply that Plan medical cost savings must be in the range of 25 to 30 percent versus the Medicare FFS cost benchmark bidding target.
However, a close examination of the bid process reveals that most of these savings are artifacts of the process and not due to better or more efficient care. They result from including “induced utilization costs” from Medicare supplemental insurance, legislated increases in the benchmarks, and risk score gaming. The inflation of benchmarks and risk score gaming, not better care, finance the rebates that drive MA market success.
CMS pays MA Plans a per-person revenue amount that is determined by the Plan’s bid to provide Part A (hospital) and Part B (all other medical services) to enrollees. Plans bid against a benchmark, which as noted is intended to capture the amount that Medicare would spend on TM benefits for an average TM beneficiary. If the bid is less than the benchmark, CMS keeps about one-third of the difference and pays two-thirds to the Plan as a rebate. This rebate can be used to improve benefits or reduce costs for the members. If the bid is above the benchmark, there is no rebate, and the Plan must charge the member premiums to make up the difference.
Bids include the cost of medical services as well as plan administrative costs and profits. Most plans bid sufficiently below the benchmark to offer members a “zero premium” product, often including Part D drug coverage. Conceptually, the difference between the benchmark and the bid represents “savings” that the plan generates that decrease CMS costs.
Real Vs. Apparent Savings
The difference between bids and benchmarks, i.e., the savings vs. FFS, and rebates have doubled over the past seven years, leading to improved benefits, lower premiums for members, higher profits and more rapid growth. In 2022, rebates were $164 PBPM and 66 percent of beneficiaries were in zero-premium products.
This suggests that savings for CMS have increased; however, the reality is that most of these are just “apparent savings”—not real savings—that increase costs for CMS, beneficiaries and taxpayers.
Here is how that happened.
Benchmarks Are Significantly Inflated By Including The Costs Of ‘Induced Utilization’
The total cost of care is a function of the price paid per service and the number of services patients receive. Because MA Plans are given the right to use CMS’s Medicare pricing schedule for all Medicare participating providers, the MA average price per service tends to be about the same as Medicare’s. Most savings in MA then must be due to changes in utilization of services. Is the 25-30 percent implied savings of MA really due to 25-30 percent lower utilization across the full set of health care services, or is something else leading to “apparent savings”?
The ‘Induced Utilization Effect’ Of Medicare Supplemental Insurance Leads To Higher Utilization And Costs In The TM Population
Health insurance benefits programs vary by the percentage of costs paid by the covered individual. First-dollar coverage (FDC) means that the insurer pays most of the cost of services. Non-first dollar coverage (NFDC) with deductibles, coinsurance, and copays creates financial hurdles for patients as they pay more of the cost. Actuaries have shown that populations with FDC use more services and have higher total costs. We use the term “induced utilization” to denote the additional services associated with FDC. If one assumes that the additional services are necessary and contribute to better health, this difference is better framed as “forgone services” by the population with NFDC.
TM’s population provides an ideal context to study this phenomenon. TM’s fee-for-service benefits cover about 84 percent of medical costs but the vast majority of TM beneficiaries (84 percent) have supplemental insurance coverage that covers the other 16 percent of costs, effectively giving them FDC. MedPAC commissioned two studies to examine the difference in utilization between beneficiaries with and without supplemental coverage. MedPAC cited the first study in their June 2012 report on reforming Medicare’s benefit design, concluding:
The study estimated that total Medicare spending was 33 percent higher for beneficiaries with medigap policies . . . Beneficiaries with employer sponsored coverage had 17 percent higher Medicare spending
The authors of this study updated it in 2014, using three years of additional data, through 2008. Their conclusions at that time estimated that Medicare spending was 25 percent higher for beneficiaries with Medigap policies and 14 percent higher for those with employer-sponsored coverage. Another 2019 study on induced utilization showed that Medigap increased utilization by more than 20 percent.
The way the costs from induced utilization inflate the MA benchmark calculation has major implications for the calculation of MA Plan rebates. As we shall see below, the current approach gives MA plans a massive head start on financial success, no matter how well or poorly they manage care or costs.
Effects Of Induced Utilization On TM Spending Flow Through To MA Benchmarks
At a high level, the MA benchmark is based on the average total cost for all TM beneficiaries. The 2022 TM average cost of $1,086 per beneficiary per month (PBPM) is the average of the total medical costs for two Medicare populations: those with additional coverage (TM + Coverage) and those with Medicare only (TM only). Exhibit 1, using the differences in spending cited by Hogan et al in 2014 above, demonstrates the underlying average costs for individuals with and without additional coverage. The TM-only population costs CMS $920 while the TM+ Coverage population costs $1,169. The overall weighted average cost of $1,086 is inflated above the TM-only cost by $166, or 18 percent.
The Expected Cost Plans Use In Their Bids, Based On TM-Only Benefits, Are Far Below The Inflated MA Benchmark And Result In Large “Apparent Savings” And Rebates
The MA bid process instructs plans to bid their expected cost using the standard Medicare package of services and benefits. Any improved benefits and resulting costs are part of the supplemental benefit information that explains how they will use the rebates. The intent is for the plans to demonstrate their ability to drive significant savings versus CMS’s cost. One would think that this should be a comparison of the bid with the TM-only population’s cost. But the MA benchmark used in the comparison is based on the overall average of costs for the TM +Coverage and the TM-only populations, thereby including the induced utilization costs. When the lower expected cost is subtracted from the inflated benchmark it automatically creates “apparent savings” of $166 PBPM, or 18 percent.
Exhibit 2 illustrates how these “apparent savings” roll through the MA bid to create rebates for the plans. Our model in exhibit 2 is based on MedPAC’s analysis of the industry-wide 2022 MA bids, which showed an average rebate of $164 PBPM. That analysis, combined with the Medicare 2022 average TM cost of $1,086, implies that the expected medical costs used in the bids averaged approximately $790, an actual medical cost savings of $130 PBPM (14 percent) compared to the $920 TM-only cost.
Column 1 shows what would happen if the benchmark were set at the TM-Only cost of $920 with an average risk population. With assumed administrative costs of $80 PBPM (8 percent) and profits of $50 (5 percent) the resulting bid would be $920. Because the bid and the benchmark would be both $920, plans would show no savings and receive no rebate. The total savings in the Bid are just the medical cost savings of $130, which fund the plan administrative costs and profits. With no rebate they would have to charge members for any improved or supplemental benefits. This would not be a formula for success in MA.
Column 2 uses the inflated benchmark of $1,086 that includes the $166 induced utilization effect. Medical costs do not change, the bid remains the same, and the $166 becomes the difference between the benchmark and the bid; two-thirds of the $166 becomes the rebate of $108. The total savings implied in the bid increase to $296, but 56 percent is due to “apparent savings,” which account for 100 percent of the rebate.
But this is still well below the reported 2022 $164 average rebate. Is more of this driven by plan medical cost savings?
Legislated Payments Above FFS Cost Further Inflate Benchmarks And Contribute To Apparent Savings And Rebates
The MA average national benchmark of $1,086 is based on Medicare’s national average cost for TM in 2022, as reported by CMS. This is what Medicare pays for all Part A and B services for an average beneficiary across the country. Actual MA rates are set at the county level and are adjusted from 95 percent to 115 percent of FFS Medicare expenses depending on whether a county has high or low costs relative to the national average. Approximately 80 percent of MA enrollees are also in plans that receive quality bonuses.
County bonuses and quality bonuses are added to benchmarks. According to MedPAC, in 2022 these bonuses accounted for an additional 8 percent increase in payments above the FFS cost, and 90 percent of MA members were in Plans receiving quality bonuses.MedPAC again reiterated at its January 2023 meeting that the “quality bonus program is not a good way of judging quality for the 49 percent of beneficiaries in MA.” Column 3 starts with a benchmark that is inflated $87 (8 percent) more to account for these bonuses. The bid is unchanged, increasing the difference to $253 and the rebate to the $164 reported by MedPAC. Of the savings implied in the bid, 66 percent is from benchmark inflation, as is 100 percent of the rebate.
Risk Score Gaming Acts As A Multiplier Of This Benchmark Inflation
As described in our prior article, MA Money Machine Part 1, plans systematically increase their risk scores to improve payments from CMS. Column 4 in exhibit 2 illustrates the results for a plan that increases its risk score from 1 to 1.1. In the bid process, the benchmark-bid difference is computed by comparing the actual bid to the risk-adjusted benchmark. Our prior examples had an average risk score of 1, so the risk-adjusted benchmark is the same as the benchmark. In Column 4 the benchmark is risk adjusted by multiplying the $1,173 from Column 3 by the 1.1 risk score, resulting in an increase of $117.
While the higher risk score might suggest that the population is sicker, that is an illusion created by the risk score game. The medical costs do not change.The reality is the population is the same; the plan has just collected more codes that make the population look sicker. We recently presented an example of this using data from a United Health Group (UHG)/Optum Team Study that included a comparison of HCC coding rates for FFS and MA populations.
The bid therefore remains the same. The difference has increased to $370, resulting in a rebate of $241. The savings implied in the bid increase to $500, but 74 percent of these and 100 percent of the rebate are apparent savings from benchmark and risk score driven inflation.
The MA Bid Process Allows Plans With Zero Cost Savings To Offer Zero Premium Products
Column 5 of exhibit 2 shows that even if the plan has no actual medical cost savings, and no increase in the risk score, the benchmark inflation from induced utilization and bonuses allows the plan to have a rebate of $100.
MedPAC has reported that rebates vary widely, suggesting that there are indeed real MA plans today that are delivering no improvement in medical costs vs. FFS but still are receiving rebates and offering zero premium products.
Even Plan Medical Cost Savings Are Uncertain
Most of our examples assume that MA beneficiaries have a risk score of 1, that is they have the same health burden as an average Medicare population. Multiple studies have shown that this is not the case. Jacobson et al demonstrated that beneficiaries who enrolled in MA in 2016 were 16 percent less costly than individuals who stayed in TM. Other researchers have used mortality rates as evidence that individuals choosing MA are healthier than those in TM. If MA beneficiaries are actually healthier and have lower medical costs, the 14 percent “real” cost savings we use in exhibit 2 would be overstated.
ACOs Do Not Benefit From Any of These Subsidies
In an earlier paper, Joe Antos and Jim Capretta asserted that “There is little question the MA plans have the capacity to deliver Medicare benefits at far less cost than unmanaged fee-for-service” and further that accountable care organizations (ACOs) deliver “far less that the savings that could be achieved by MA plans based on their bids.” While we disagree with both statements, we agree on one point: the savings implied in MA bids seem large. But they are mostly apparent not real savings.
ACOs have a very different starting point from MA plans. They don’t start with the 18 percent advantage demonstrated above, they don’t get county and quality bonuses and they are not able to benefit much from risk coding. The costs of induced utilization are in their benchmarks, but their aligned beneficiaries are representative of the TM mix of people with FDC and non-FDC. The benefits and the resulting costs match, unlike the MA bid comparison of average costs and lower plan expected costs. Any comparison of savings by the two programs needs to account for this reality. We believe that most of the differences in the “real savings” of the two programs is accounted for by claims denials and some instances of lower prices in MA vs. FFS.
Conclusion
MA is growing rapidly because of plans offering lower premiums and improved, supplemental benefits.
Claims by the MA industry that they are successful because they deliver more efficient care are flawed because they compare MA costs to inflated benchmarks that are much higher than the actual CMS costs to provide benefits.
Even if one assumes that MA does decrease medical costs, these savings as reflected in MA bids are not the drivers of the rebates or MA success. Indeed, 100 percent of rebates result from inflated benchmarks and risk score gaming. The resulting payments, which are in excess of TM costs, generate the additional funding for “free-to-the-member” improved benefits. While there is large variation, and some plans improve care and decrease utilization, MA industry success is a function of corporate subsidies.
The bottom line: we are systematically driving people out of TM by subsidizing the more expensive MA.
Inflated benchmarks from these three sources start MA plans “on third base” and risk score gaming gives them a free walk home. For MA plan owners it feels like they hit a home run. For taxpayers and Medicare beneficiaries footing the bill it feels like a series of major errors. CMS in its 2024 Medicare Advantage Advance Notice has proposed significant changes to the Risk Adjustment system. We believe this would be an important step forward towards addressing the vast overpayments to MA plans and deserves our support.
At a meeting with hospital system CEOs last Wednesday, one asked: “has healthcare reached the tipping point?” I replied ‘not yet but it’s getting close.’
I iterated factors that make these times uniquely difficult in every sector:
An uncertain economy that’s unlikely to fully recover until next year.
The growth of Medicaid and Medicare coverage that shifts their financial shortfall to employers and taxpayers who are fed up and pushing back.
A vicious political environment that rewards partisan brinksmanship and focus-group tested soundbites to manipulate voters on complex issues in healthcare.
The growing domination of Big Business in each sector that have used acquisitions + corporatization to their advantage.
The widening role of private equity in funding non-conventional solutions that disrupt the status quo (and the uncertain future for many of these).
The federal courts system that’s increasingly the arbiter over access, fairness, quality and freedoms in healthcare.
The lingering impact of the pandemic.
And growing public disgust and distrust as the system’s altruism and good will is undermined by pervasive concern for profit.
Unprecedented! But events like those last week prompt hitting the pause button: not everyone pays attention to healthcare like many of us. The slaughter of 6 innocents in Nashville hit close to home: it’s about guns, mental health and life and death. The appeal of tech-giants to press the pause button on Generative AI for at least 6 months was sobering. The ravage of tornados that left thousands insecure without food, housing or hope seemed unfair. Mounting tensions with Russia and complex negotiations with China that reminded us that the U.S. competes in a global economy. And President Trump’s court appearance tomorrow will stoke doubt about our justice system at a time when it’s role in healthcare and society is expanding.
I am a healthcare guy. I am prone to see the world through the lens of the U.S. health industry and keen to understand its trends, tipping points and future. There’s plenty to watch: this week will be no exception. The punch list is familiar:
Medicaid coverage: Many will be watching the fallout of from state redetermination requirements for Medicaid coverage starting as soon as this week with disenrollment in Arizona, Arkansas, Idaho, New Hampshire and South Dakota.
Medicare Advantage: Health insurers will be modifying their Medicare Advantage strategies to adapt to CMS’ risk adjustment and Value-based Insurance Design modifications announced last week.
Prescription drug prices: PBMs and drug companies will face growing skepticism as Senate and House committees continue investigations about price gauging and collusion. Hospitals will be making adjustments to higher operating losses as states cut their Medicaid rolls.
Technology: The 7500 VIVA attendees will be doing follow-up to secure entrées for their technologies and solutions among prospective buyers.
Physicians: And physicians will intensify campaigns against insurers and hospitals now seen as adversaries while lobbying Congress for more money and greater income opportunities i.e., physician-owned hospitals.
Hospitals: On the offense against site-neutral payments, physician owned hospitals, drug prices and inadequate reimbursement from health insurers.
All will soldier on but the food fights in healthcare and broader headwinds facing the industry suggest a tipping point might be near.
I am not a fatalist: the future for healthcare is brighter than its past, but not for everyone. Strategies predicated on protecting the past are obsolete. Strategies that consider consumers incapable of active participation in the delivery and financing of their care are archaic. Strategies that depend on unbridled consolidation and opaque pricing are naïve. And strategies that limit market access for non-traditional players are artifacts of the gilded age gone by when each sector protected its own against infidels outside.
These times call for two changes in every board room and C Suite in of every organization in healthcare:
Broader vision: Understanding healthcare’s future in the broader context of American society, democracy and capitalism: Beltway insiders and academics prognosticate based on lag indicators that are decreasingly valid for forecasting. Media pundits on healthcare fail to report context and underpinnings. Management teams are operating under short-term financial incentives lacking longer-term applicability. Consultants are telling C suites what they want to hear. And boards are being mis-educated about trends of consequence that matter. Understanding the future and building response scenarios is out of sight and out of mind to insiders more comfortable being victims than creators of the new normal.
Board leadership: Equipping boards to make tough decisions: Governance in healthcare is not taken seriously unless an organization’s investors are unhappy, margins are shrinking or disgruntled employees create a stir. Few have a systematic process for looking at healthcare 10 years out and beyond their business. Every Board must refresh its thinking about what tomorrow in healthcare will be and adjust. It’s easier for board to approve plans for the near-term than invest for the long-term: that’s why outsiders today will be tomorrow’s primary incumbents.
So, is U.S healthcare near its tipping point? I don’t know for sure, but it seems clear the tipping point is nearer than at any point in its history. It’s time for fresh thinking and new players.
Hard-pressed to come up with significant savings to reduce the deficit, some Senate Republicans are taking a closer look at reforms to Medicare Advantage in light of reports that insurance companies are collecting billions of dollars in extra profits by over-diagnosing older patients.
But the idea of cracking down on Medicare Advantage overpayments to insurance companies divides Republicans, who have traditionally championed the program.
Proponents of Medicare Advantage reform anticipated it will face strong opposition from the insurance industry, one of the most powerful special interest groups in Washington.
Sen. Bill Cassidy (La.), the top-ranking Republican on the Senate Health, Education, Labor and Pensions Committee, is leading the push to reduce Medicare overpayments.
“Medicare is going insolvent. If we don’t do anything, it’s going to go insolvent. We have a whole package of things, all of them bipartisan, and we’re doing it essentially to have something out there so that if somebody decides to do something, there will be things that are examined, considered and bipartisan” to vote on, he said.
“I come up with lots of stuff. We thought it through policy and think it’s policy that can make it all the way through,” he said.
Cassidy’s office says his bill could extend the solvency of Medicare by saving as much as $80 billion in federal funds over the next decade without cutting benefits.
He emphasizes that it would not cut Medicare Advantage benefits, but critics of the legislation are sure to challenge that claim.
“We’re not undermining Medicare Advantage,” he said.
“In fact, I would say this is a better alternative than what CMS is doing by rule,” he added, referring to a new rule-making action by the Biden administration to recover overpayments in Medicare Advantage through the Centers for Medicare & Medicaid Services.
The Medicare Payment Advisory Panel estimates that Medicare Advantage plans collected $124 billion in overpayments from 2008 to 2023. They collected an estimated $44 billion overpayments in 2022 and 2023 alone, according to MedPAC.
Unlike traditional fee-for-service Medicare, Medicare Advantage plans are offered by private companies. Both are funded by taxpayers through general revenues, payroll taxes and beneficiaries’ premiums.
Cassidy is also leading a bipartisan working group to reform Social Security to extend its solvency. Members include Sens. Angus King (I-Maine) and Mitt Romney (R-Utah).
“To have a significant impact on fiscal policy, you’d have to look at entitlements,” said Romney, who called Medicare Advantage “an area we’re going to be looking at very shortly — the committee will be looking at Medicare Advantage,
the cost of Medicare Advantage …. It’s become more expensive than the old fee-for-service Medicare.”
In a follow-up interview Thursday, Romney said senators are also looking at reforms to Pharmacy Benefit Managers, the companies that serve as middle-men between drug manufacturers, insurance companies and pharmacies.
Romney said, “in the past, Medicare Advantage has been a lower-cost way of providing Medicare than fee-for-service Medicare.”
“If that’s changing, I’d like to understand why and make sure we don’t create impediments to the lower-cost Medicare Advantage,” he said.
Sen. Mike Braun (R-Ind.) said Medicare Advantage overpayment “definitely” is a “reform issue.”
“I’ve been the loudest voice on reforming health care and that’s a commonsense idea,” he said. “Whatever it takes to bring down health care costs.
“I’m one of the most free-market people here, but the health care industry is not a free market. It’s like an unregulated utility,” he said. “There’s so much opaqueness.”
But some Republicans are already trying to paint efforts to reduce overpayments as cuts to Medicare Advantage.
“The problem with Medicare Advantage is President Biden is cutting $540 per member per year. That’s the problem. Medicare Advantage has been very successful,” said Sen. Roger Marshall (R-Kan.), an OB/GYN who practiced medicine for more than 25 years.
National Republican Senatorial Committee Chairman Steve Daines (R-Mont.) accused Biden of “proposing Medicare Advantage cuts” when the president accused some Republicans of wanting to sunset Medicare at his Feb. 7 State of the Union address.
Medicare Advantage is getting more popular among Democrats as well as the number of blue state enrollees in the program soars. The number of Americans enrolled in Medicare Advantage has nearly doubled over the last 12 years, according to the Kaiser Family Foundation.
Cassidy’s proposal, which he introduced with progressive Sen. Jeff Merkley (D-Ore.) on Monday, could draw broader interest from Republicans.
Sen. John Cornyn (R-Texas), an adviser to the Senate GOP leadership, called Medicare Advantage a “success.”
“That doesn’t mean that it should be immune from oversight, so I’ll be interested to see what they have to say,” he said.
Cassidy and Merkley say that Medicare Advantage plans have a financial incentive to make beneficiaries appear sicker than they are because they are paid a standard rate based on the health of individual patients. Their bill, the No Unreasonable Payment, Coding or Diagnoses for Elderly (No Upcode Act) would require risk models based on more extensive diagnostic data over a period of two years.
The goal is to narrow the disparity in how patients are assessed by traditional Medicare and Medicare Advantage.
Studies and audits conducted by CMS and the Department of Health and Human Services’ inspector general found that insurance companies collected billion of dollars in overpayments because of diagnoses that were not later supported by enrollees’ medical records.
The Kaiser Family Foundation reported in August that more than 28 million people — or about 48 percent of the eligible Medicare population — were enrolled in Medicare Advantage plans in 2022. They accounted for $427 billion or 55 percent of total federal Medicare spending.
The Medicare Advisory Payment Commission recommends a higher-than-current-law fee-for-service payment update in 2024 for acute care hospitals and positive payment updates for clinicians paid under the physician fee schedule. It recommends reductions in base payment rates for skilled nursing facilities, home health agencies and inpatient rehabilitation facilities.
MedPAC gave Congress recommendations on payment rates in both traditional fee-for-service and Medicare Advantage for 2024, satisfying a legislative mandate comparing per enrollee spending in both programs.
MedPAC estimates that Medicare spends 6% more for MA enrollees than it would spend if those enrollees remained in fee-for-service Medicare.
In their March 2023 Report to the Congress: Medicare Payment Policy, commissioners said they were acutely aware of how providers’ financial status and patterns of Medicare spending varied in 2020 and 2021 due to COVID-19 and were also aware of higher and more volatile cost increases.
However, they’re statutorily charged to evaluate available data to assess whether Medicare payments are sufficient to support the efficient delivery of care and ensure access to care for Medicare’s beneficiaries, commissioners said.
FEE-FOR-SERVICE RATE RECOMMENDATIONS
MedPAC’s payment update recommendations are based on an assessment of payment adequacy, beneficiaries’ access to and use of care, the quality of the care, the supply of providers, and their access to capital, the report said. As well as higher payments for acute care hospitals and clinicians, MedPAC recommends positive rates for outpatient dialysis facilities.
It recommends providing additional resources to acute care hospitals and clinicians who furnish care to Medicare beneficiaries with low incomes. It also recommends a positive payment update in 2024 for hospice providers concurrent with wage adjusting and reducing the hospice aggregate Medicare payment cap by 20%.
It recommends negative updates, which are reductions in base payment rates, for skilled nursing facilities, home health agencies and inpatient rehabilitation facilities.
Acute care
For acute care hospitals paid under the inpatient prospective payment system, commissioners recommend adding $2 billion to current disproportionate share and uncompensated care payments and distributing the entire amount using a commission-developed “Medicare SafetyNet Index” to direct funding to those hospitals that provide care to large shares of low-income Medicare beneficiaries.
This recommendation got pushback from America’s Essential Hospitals.
“We appreciate the Medicare Payment Advisory Commission’s desire to define safety net hospitals for targeted support, but the commission’s Medicare safety net index (MSNI) could have the perverse effect of shifting resources away from hospitals that need support the most,” said SVP of Policy and Advocacy Beth Feldpush. “The MSNI methodology fails to account for all the nation’s safety net hospitals by overlooking uncompensated care and care provided to non-Medicare, low-income patients – especially Medicaid beneficiaries. Any practical definition of a safety net provider must consider the care of Medicaid and uninsured patients, yet the MSNI misses on both counts.”
Feldpush urged policymakers to develop a federal designation of safety net hospitals and to reject the MSNI.
“Further, policymaking for these hospitals should supplement, rather than redistribute, existing Medicare DSH funding, which reflects a congressionally sanctioned, well-established methodology,” she said.
Physicians and clinicians
For clinicians, the commission recommends that Medicare make targeted add-on payments of 15% to primary care clinicians and 5% to all other clinicians for physician fee schedule services provided to low-income Medicare beneficiaries.
The American Medical Association commended MedPAC, but also said that an update tied to just 50% of the Medicare Economic Index would cause physician payment to chronically fall even further behind increases in the cost of providing care. AMA president Dr. Jack Resneck Jr. urged Congress to pass legislation providing for an annual inflation-based payment update.
MedPAC has long championed a physician payment update tied to the Medicare Economic Index, Resneck said. Physicians have faced the cost of inflation, the COVID-19 pandemic and growing expenses to run medical practices, jeopardizing access to care, particularly in rural and underserved areas.
“Not only have Medicare payments failed to respond adequately, but physicians saw a 2% payment reduction for 2023, creating an additional challenge at a perilous moment,” Resneck said. “As one of the only Medicare providers without an inflationary payment update, physicians have waited a long time for this change. When adjusted for inflation, Medicare physician payment has effectively declined 26% from 2001 to 2023. These increasingly thin or negative operating margins disproportionately affect small, independent, and rural physician practices, as well as those treating low-income or other historically minoritized or marginalized patient communities. Our workforce is at risk just when the health of the nation depends on preserving access to care.”
The AMA and 134 other health organizations wrote to congressional leaders urging for a full inflation-based update to the Medicare Physician Fee Schedule.
MGMA’s SVP of Government Affairs Anders Gilberg said, “Today’s MedPAC report recommends Congress provide an inflationary update to the Medicare base payment rate for physician and other health professional services of 50% of the Medicare Economic Index (MEI), an estimated annual increase of 1.45% for 2024. In the best of times such a nominal increase would not cover annual medical practice cost increases. In the current inflationary environment, it is grossly insufficient.”
MGMA urged Congress to pass legislation to provide an annual inflationary update based on the full MEI.
Ambulatory surgical centers and long-term care hospitals
Previously, the commission considered an annual update recommendation for ambulatory surgical centers (ASCs). However, because Medicare does not require ASCs to submit data on the cost of treating beneficiaries, the commissioners said they had no new significant data to inform an ASC update recommendation for 2024.
Commissioners also previously considered an annual update recommendation for long-term care hospitals (LTCHs). But as the number of cases that qualify for payment under Medicare’s prospective payment system for LTCHs has fallen, they said they have become increasingly concerned about small sample sizes in the analyses of this sector.
“As a result, we will no longer provide an annual payment adequacy analysis for LTCHs but will continue to monitor that sector and provide periodic status reports,” they said in the report.
MEDICARE ADVANTAGE
Commissioners said that overall, indicators point to an increasingly robust MA program. In 2022, the MA program included over 5,200 plan options, enrolled about 29 million Medicare beneficiaries (49% of eligible beneficiaries), and paid MA plans $403 billion (not including Part D drug plan payments).
In 2023, the average Medicare beneficiary has a choice of 41 plans offered by an average of eight organizations. Further, the level of rebates that fund extra benefits reached a record high of about $2,350 per enrollee, on average.
Medicare payments for these extra benefits – which are not covered for beneficiaries in FFS – have more than doubled since 2018. For 2023, the average MA plan bid to provide Medicare Part A and Part B benefits was 17% less than FFS Medicare would be projected to spend for those enrollees.
However, the benefits from MA’s lower cost relative to FFS spending are shared exclusively by the companies sponsoring MA plans and MA enrollees (in the form of extra benefits). The taxpayers and FFS Medicare beneficiaries (who help fund the MA program through Part B premiums) do not realize any savings from MA plan efficiencies.
Medicare should not continue to overpay MA plans, MedPAC said. Over the past few years, the commission has made recommendations to address coding intensity, replace the quality bonus program and establish more equitable benchmarks, which are used to set plan payments, the report said. All of these would stem Medicare’s excess payments to MA plans, helping to preserve Medicare’s solvency and sustainability while maintaining beneficiary access to MA plans and the extra benefits they can provide.
PART D
Medicare’s cost-based reinsurance continues to be the largest and fastest growing component of Part D spending, totaling $52.4 billion, or about 55% of the total, according to the report.
As a result, the financial risk that plans bear, as well as their incentives to control costs, has declined markedly. The value of the average basic benefit that is paid to plans through the capitated direct subsidy has plummeted in recent years.
In 2023, direct subsidy payments averaged less than $2 per member per month, compared with payments of nearly $94 per member, per month, for reinsurance. To help address these issues, in 2020 the commission recommended substantial changes to Part D’s benefit design to limit enrollee out-of-pocket spending; realign plan and manufacturer incentives to help restore the role of risk-based, capitated payments; and eliminate features of the current program that distort market incentives.
In 2022, Congress passed the Inflation Reduction Act, which included numerous policies related to prescription drugs. One such provision is a redesign of the Part D benefit with many similarities to the commission’s recommended changes.
The changes adopted in the IRA will be implemented over the next several years, and are likely to alter the drug-pricing landscape, commissioners said.
New Hyde Park, N.Y.-based Northwell Health began 2023 with a low, but positive operating margin, but labor costs are expected to increase again this year on the back of recent union activity in the state.
To offset such increases that were not anticipated in the 2023 budget, Northwell is evaluating opportunities to reduce expenses and increase revenue across the health system, which includes 21 hospitals and about 83,000 employees.
Michael Dowling, CEO of Northwell, spoke to Becker’s Hospital Review about the health system’s biggest challenge this year, how it approaches cost-cutting and why outpatient care is its biggest growth area.
Editor’s note: Responses are lightly edited for length and clarity.
Question: Many health systems saw margins dip last year amid rising inflation, increased labor costs and declining patient volumes. How have you led Northwell through the challenges of last year?
Michael Dowling: We ended 2022 with a low, but positive margin. We’ve been coming back from COVID quite successfully, and we’re back pretty much in all areas to where we were prior to the pandemic. Volumes have returned and we’re very busy. We came into 2023 with a positive budget and a positive margin. We anticipate that you’re always going to have challenges and disturbances, but it’s important to stay focused and deal with it. We have a very detailed strategic plan, which outlines our various goals, and we stick to it.
Q: What is your top priority today?
MD: The biggest issue for us today is labor costs. We have lots of union activity in New York at the moment. There were various nurse strikes in New York City at the beginning of the year. None of our hospitals were involved in those deliberations, but some of those hospitals agreed to contracts that have increases that were not anticipated in anybody’s 2023 budget. That’s going to have an effect on us. We have negotiations ongoing with the nurses’ union, and have 10 unions overall. About 90 percent of Northwell’s facilities have unions, so the bottom line is we are going to have expenses as a result of these contracts that were not anticipated in the budget. I don’t know the final number on these contracts yet, but it’s definitely going to be more than what we anticipated.
The unions in New York get a lot of government support and have become very empowered and quite aggressive. The bottom line is there’s more expense than we anticipated in our budget, so we need to figure out how to address that. We’re looking at everything across our health system to find expense reductions or revenue enhancements to be able to make up for the increased labor costs and be optimistic about ending the year with a positive margin. But we’re in a good place and are not like some other health systems that are struggling financially.
Q: Where are the biggest opportunities to reduce expenses or increase revenue to offset the increased labor costs?
MD: It’s a combination of a lot of things. We have a detailed capital plan that we may slow down. We hire about 300 people a week, so maybe we’ll target that hiring into specific areas and not be as broad based as we thought we could be. We will examine if we have specific programs or initiatives we can curtail without doing any damage to our core mission. It will end up being a portfolio of items; it won’t be one big thing. On the revenue side, we’re working very hard to increase our neurosurgery, cardiac, cancer and orthopedic businesses. Over the next couple of months, all of those things will be taken into consideration. The bottom line is we are going to come out of this winning.
Q: Looking three or four years down the line, where do you see the biggest growth opportunities for Northwell?
MD: Our biggest growth is in outpatient care. A lot of surgeries are moving outpatient, so we have to get ahead of that. Some think we are only a hospital system, but only about 46 percent of our business is from our hospital sector today. Home care is going to grow phenomenally, especially given the new technology that’s available. Digital health will also dramatically expand.
We’re also looking at expanding into new geographic areas and markets. It’s about positioning your offerings in places close to where people live, so you reduce the inconvenience of people having to travel long distances for care when it should be available to them closer to home. When you do that, you increase market share. We’re constantly increasing our market share by being very aggressive about going to where the customer is and providing the highest quality care that we can. Part of that is also being able to recruit top-line, quality physicians. When you do that, you attract new business because you have competencies that you didn’t have before. It’s a combination of all of these things, but there’s certainly no limit to the opportunities in front of us. We’re not in a world of challenges; we’re in a world of opportunity. The question is are we aggressive enough and do we have enough tolerance for some risk? We need to be as aggressive as we possibly can to take advantage of some of those opportunities.
Q: What is the biggest challenge on the horizon for Northwell?
MD: The biggest challenge is the huge growth in government payer business — Medicare and Medicaid. The problem with Medicaid — especially in a union environment — is it doesn’t cover your costs. The government is a big part of a potential future issue there. By increasing Medicaid, the more of your business becomes Medicaid and the worse you end up doing, unless you can increase your commercial payer business to continue to cross-subsidize. We also have a lot of union negotiations over the next couple of months, which will put a strain on our 2023 budget, but we will resolve it.
Q: How do you see hospitals and health systems evolving as CMS, commercial payers and patients continue to push more services to outpatient settings, where they can arguably be performed at a higher quality and lower cost?
MD: I think it’s going to continue to grow. For example, Northwell has 23 hospitals — 21 of which it owns — yet it has 890 outpatient facilities. We’ve been ahead of this curve a long time. Our primary expansion is in ambulatory care, not in-hospital care. Like I said, only 46 percent of Northwell’s total business is its hospital business. If you’re relying on the hospital to be the core provider of the future, you’re going to lose. You’ve got to take a little bit of a hit by going out and expanding your ambulatory presence. But the more you expand ambulatory and grow in the right locations, the more you increase market share, which brings more of the necessary inpatient care back to your hospitals. Our hospitals are growing and getting busier in addition to our outpatient centers because we are growing market share. If we enter a new community and see 100 people, five of them will need to be hospitalized. That’s a new market. Ambulatory cannot be disassociated from its connection to the inpatient market.
Q: Many financial experts are projecting a recession this year. How might that affect hospitals and health systems, and how can they best prepare?
MD: Even if we do have a recession, it doesn’t mean that people don’t get sick. In fact, people’s problems increase. Our business does not slow down if we have a recession; our business will probably increase. On the revenue side, it won’t necessarily affect our government reimbursement, which we don’t do well on anyway. The things you worry about during a recession is if employers give up the coverage of their staff. Then those employees with no insurance may go on a state Medicaid program, and that might affect hospitals.
In the healthcare sector, even in a recession, the need for hospital services actually increases. No recession could be as bad as what we experienced during COVID, yet we managed it. We had a problem that we didn’t even understand, and we worked through it. I think healthcare deserves an extraordinary credit for what was done during COVID. If there is a recession, we will deal with it. It’s just one of those things that happens, and we will respond to it in as comprehensive a way as we can. I can’t control it, but I can control our response. Leadership to me is about having a positive disposition; basically saying that whatever happens to you, you’re going to win.
As the U.S. prepares to end the COVID-19 public health emergency, hospitals are facing a major cut in Medicare payments used to treat patients diagnosed with the disease.
Since January 2020, hospitals nationwide have received a 20 percent increase in the Medicare payment rate through the hospital inpatient prospective payment system to treat COVID-19 patients — that policy ends May 11.
The sunsetting of the three-year policy is a key concern for the AHA because of its financial implication for hospitals already struggling with increased labor costs and inflation.
From January 2020 to November 2021, payments for the 1 million traditional Medicare patients hospitalized with COVID-19 totaled $23.4 billion, or more than $24,000 per patient, according to lobbying and law firm Brownstein.
The end of the policy also has the potential to increase medical costs for patients hospitalized with COVID-19. If patients must pay higher costs for COVID-19-related services, they may be less inclined to get tested or even seek treatment.
“It means there will be less testing in this country, and likely less treatment because not everyone can afford it,” Jose Figueroa, MD, assistant professor of health policy and management at the Harvard T.H. Chan School of Public Health, told Time Jan. 31. “Will this change the trajectory of the pandemic? It’s something we are going to have to watch.”
As of Feb. 8, the nation’s seven-day COVID-19 case average was 40,404, a 1 percent decrease from the previous week’s average. The rate of decrease has slowed in the last two weeks — the CDC’s last weekly report published Feb. 3 reported a 6.7 percent drop in cases.
The seven-day hospitalization average for Feb. 1-7 was 3,665, a 6.2 percent decrease from the previous week’s average and down from an 8.4 percent drop in cases a week prior.
Last week the Biden Administration announced that the federal COVID public health emergency (PHE) will expire on May 11. While the recent Omnibus law will lessen the impact, the graphic above highlights several important provisions for providers which are currently set to end with the PHE.
The Centers for Medicare and Medicaid Services (CMS) will no longer provide hospitals with a 20 percent inpatient payment boost for treating traditional Medicare patients hospitalized with COVID. The cost of COVID testing and treatments will shift from the federal government to consumers as private and public insurers can charge for tests and care, while the uninsured will bear the full costs of COVID vaccines and treatment.
Medicare’s current flexibilities around skilled nursing facility (SNF) admissions will end, as it reinstates the three-day prior hospitalization rule for SNF transfers, and ceases paying for SNF stays beyond 100 days.
The end of the PHE also means that providers willno longer be able to prescribe controlled substances virtually, without an initial in-person evaluation. This is especially significant given the volume of mental health and substance abuse treatment that shifted to telehealth across the course of the pandemic.
While the Drug Enforcement Agency has been working on regulations to address this, a proposed rule has not yet been released. Together, these changes amount tolower payments for health systems, COVID cost exposure for patients, and fewer flexibilities for providers managing care, even as thousands of patients are still being hospitalized with COVID each week.
Before 2006, Medicare Advantage in its current form didn’t exist. Now, the public-private program is expected to overtake traditional Medicare this year — how did it get here?
Medicare Advantage basics
Medicare is a federal insurance program that started in 1965 to primarily provide health coverage to Americans 65 and older.
Medicare Advantage is a federally-approved plan from a private insurance company that provides more coverage than traditional Medicare.
In 2022, 28.4 million people were enrolled in MA out of 58.6 million Medicare beneficiaries overall – or 48 percent.
Medicare is divided into four parts: A: Hospital insurance (hospital, skilled nursing, home health and hospice services) B: Medical insurance (outpatient services, physician visits, preventive screenings) C: Medicare Advantage D: Prescription drug insurance
The Centers for Medicare and Medicaid Services (CMS) oversees all Medicare plans. In 1997, Part C (MA) was created, and Part D was introduced in 2006.
Traditional Medicare includes Parts A and B, though Part B is optional. MA plans cover Parts A, B and D benefits.
When Congress created MA, it was initially called Medicare+Choice. In 2003, most Medicare+Choice plans were rebranded as Medicare Advantage.
Supplemental Medicare, or Medigap, are plans that can be purchased from commercial payers by traditional enrollees to cover more services.
Part C (MA) operates under a capitated fee, or when MA insurers are paid a set amount per beneficiary, and then pay for their health expenses. Traditional Medicare is fee-for-service, where providers are paid per service delivered.
If a provider accepts Medicare, enrollees are able to receive care there. MA members are typically confined to a select network of providers for non-emergency care, but coverage must meet or exceed traditional Medicare standards.
Terminology: Words and phrases associated with MA
Preferred Provider Organization (PPO): An MA plan with a large provider network that members pay less to use. Out-of-network providers can provide covered services for a higher cost, and emergency care is always covered. PPOs make up 40 percent of MA offerings in 2023.
Health Maintenance Organization (HMO): An MA plan where care is only covered with in-network providers, except for emergency care. HMOs account for 58 percent of MA offerings in 2023.
HMO-Point-of-Service (HMO-POS): HMO plans that allow some out-of-network services for a higher copayment.
Dual-Eligible Special Needs Plans (D-SNP): Special MA plans that provide coverage to beneficiaries eligible for both Medicare and Medicaid.
Private Fee-for-Service (PFFS): A fee-for-service MA plan that pays set amounts for care. Most PFFS plans have provider networks that charge less. They must cover out-of-network care, but usually at a higher cost – these make up less than 1 percent of plans.
Accountable Care Organization (ACO): A group of providers who join together to provide high-quality care to Medicare patients. ACO models are overseen by CMS, and several types now exist.
Prior authorization: Permission needed from the insurer for coverage, often for specialists or out-of-network care. Part D plans usually require PA for specialty drugs, but the process is plan specific.
Star ratings: An annual performance rating from CMS ranging from 1 to 5 stars, with 5 being the highest. Plans with four or more stars receive monetary bonuses that then must be used to improve benefits.
Medicare Advantage today
MA is expected to make up half of all Medicare enrollment in 2023. Under current growth, the program will hit 69 percent by 2030.
A record 3,998 MA plans are available nationwide in 2023, up 6 percent from the previous year.
The average beneficiary has 43 MA plans to choose from in 2023, up from 38 in 2022.
In 2023, 57 MA and Part D plans earned a five star designation, a decline from 2022, when 74 plans earned the designation.
The average star rating across all plans for 2023 is 4.15, down from 4.37 in 2022.
The top five reasons enrollees chose MA plans over traditional in 2022: More benefits: 24 percent Out-of-pocket limit: 20 percent Recommended by trusted people: 15 percent Offered by former employer: 11 percent Maintain same insurer: 9 percent
The largest MA insurers in 2022: UnitedHealthcare: 7 million Humana: 5.1 million BCBS plans: 4.1 million CVS Health/Aetna: 3.3 million Kaiser Permanente: 1.8 million Centene: 1.5 million Cigna: 540,000
The average monthly MA premium is projected to be $18 for 2023, down from $19.52 in 2022.
Part D average premiums for 2023 are expected to be $31.50, down from $32.08 in 2022.
The standard monthly premium for Part B enrollees is $164.90 for 2023, a decrease of $5.20 from 2022.
Traditional Medicare members spent about 7 percent more on average for healthcare compared to MA members in 2019, according to an AHIP study published Sept. 21.
MA members spent $1,965 less on average on out-of-pocket costs and premiums annually compared to traditional Medicare beneficiaries in 2019, an April 19 study from the Better Medicare Alliance found.
Around 16 percent of MA enrollees switch insurance after one year of enrollment, an Oct. 4 study in the American Journal of Managed Care found. Nearly half switched insurers by their fifth year.
MA enrollees received 9.2 percent fewer low-value services than their counterparts using traditional Medicare, a study published Sept. 9 in JAMA Open Network found.
About a third, or 31.6 percent, of the 57 MA plans that earned five stars in 2023 are a part of the Alliance of Community Health Plans, a trade group representing integrated payer-providers.
MA plans were the most likely health plans to use alternative payment models in 2022, with 57 percent using some kind of alternative payment. Of those, 35 percent used a risk-based model.
Half of the 13 percent of employers who offered retirement health benefits in 2022 did so through MA plans, up from 26 percent in 2017, according to a report from Kaiser Family Foundation published Dec. 1.
In 2023, 1,111 MA plans will offer extra benefits beyond vision, dental and hearing, which is up from 351 in 2020.
Percentage of MA plans offering extra benefits in 2022: Vision: 99 percent Hearing: 98 percent Fitness: 98 percent Dental: 96 percent Remote access: 72 percent Meals: 71 percent Acupuncture: 45 percent Transportation: 39 percent In-home support: 12 percent Bathroom safety: 9 percent Part B rebate: 7 percent Telemonitoring: 4 percent Plans with caregiver support: 4 percent
Geography
Texas saw the most growth in MA offerings from 2022 to 2023, with 42 more plans. That was followed by Florida (26) and Pennsylvania (21).
Alabama had the highest MA enrollment rate (53 percent of all Medicare) in 2022, while Wyoming had the lowest (6 percent).
In 34 percent of metropolitan areas, one payer controls more than half of the MA market, according to a 2022 AMA report. In 91 percent of metros, one payer controls at least 30 percent of the market.
Humana offers MA plans in 89 percent of U.S. counties in 2023, and UnitedHealthcare offers plans in 84 percent.
Number of counties payers offering MA plans in 2023: *There are 3,143 counties
Counties with the most MA plans available: 1. Summit County, Ohio: 87 T-2. Cuyahoga County, Ohio: 84 T-2. Medina County, Ohio: 84 T-4: Lake County, Ohio: 83 T-4: Stark County, Ohio: 83
Alaska, Montana, South Dakota and Wyoming have the least 5-star MA plans available, with one in 2022. New York and Ohio have the most 5-star plans, with 12 available.
Controversy
To date, nearly every major insurer has been accused of or settled allegations of MA fraud from the federal government. Payers have been accused of exploiting the program through elaborate coding schemes that make patients appear sicker on medical records than they actually are — thereby leading to higher payments from CMS. Insurers dispute these claims. MA overpayments to payers are estimated to have cost as much as $25 billion in 2020. Physicians told The Washington Post in June that it is common practice for payers and health systems to “data mine” a patient’s medical history if that individual is covered by MA because the program pays a set amount based on patient risk.
Some experts have said the issue stems from the flexibility of interpretation around current MA risk adjustment coding guidelines — others expect there to be increased scrutiny of the program in 2023.
Recent policy moves
CMS issued a proposed rule Dec. 6 that would require electronic prior authorization processes among MA organizations.
CMS is cracking down on deceptive marketing practices and no longer allows MA or Part D prescription drug plans to advertise on television without agency approval as of Jan. 1. The agency said it issued the new policy after reviewing thousands of beneficiary complaints regarding confusing, misleading or inaccurate information from plans — plan sponsors are also responsible for all marketing activities from brokers and third-party agencies.
CMS issued a proposed rule Dec. 14 to continue its efforts to overhaul prior authorization and marketing practices around MA and Part D plans, along with adding health equity measures to star ratings and boosting behavioral health network adequacy requirements.
A CMS rule revising MA and Part D marketing and communication regulations went into effect June 28 to increase oversight over third-party marketing organizations.
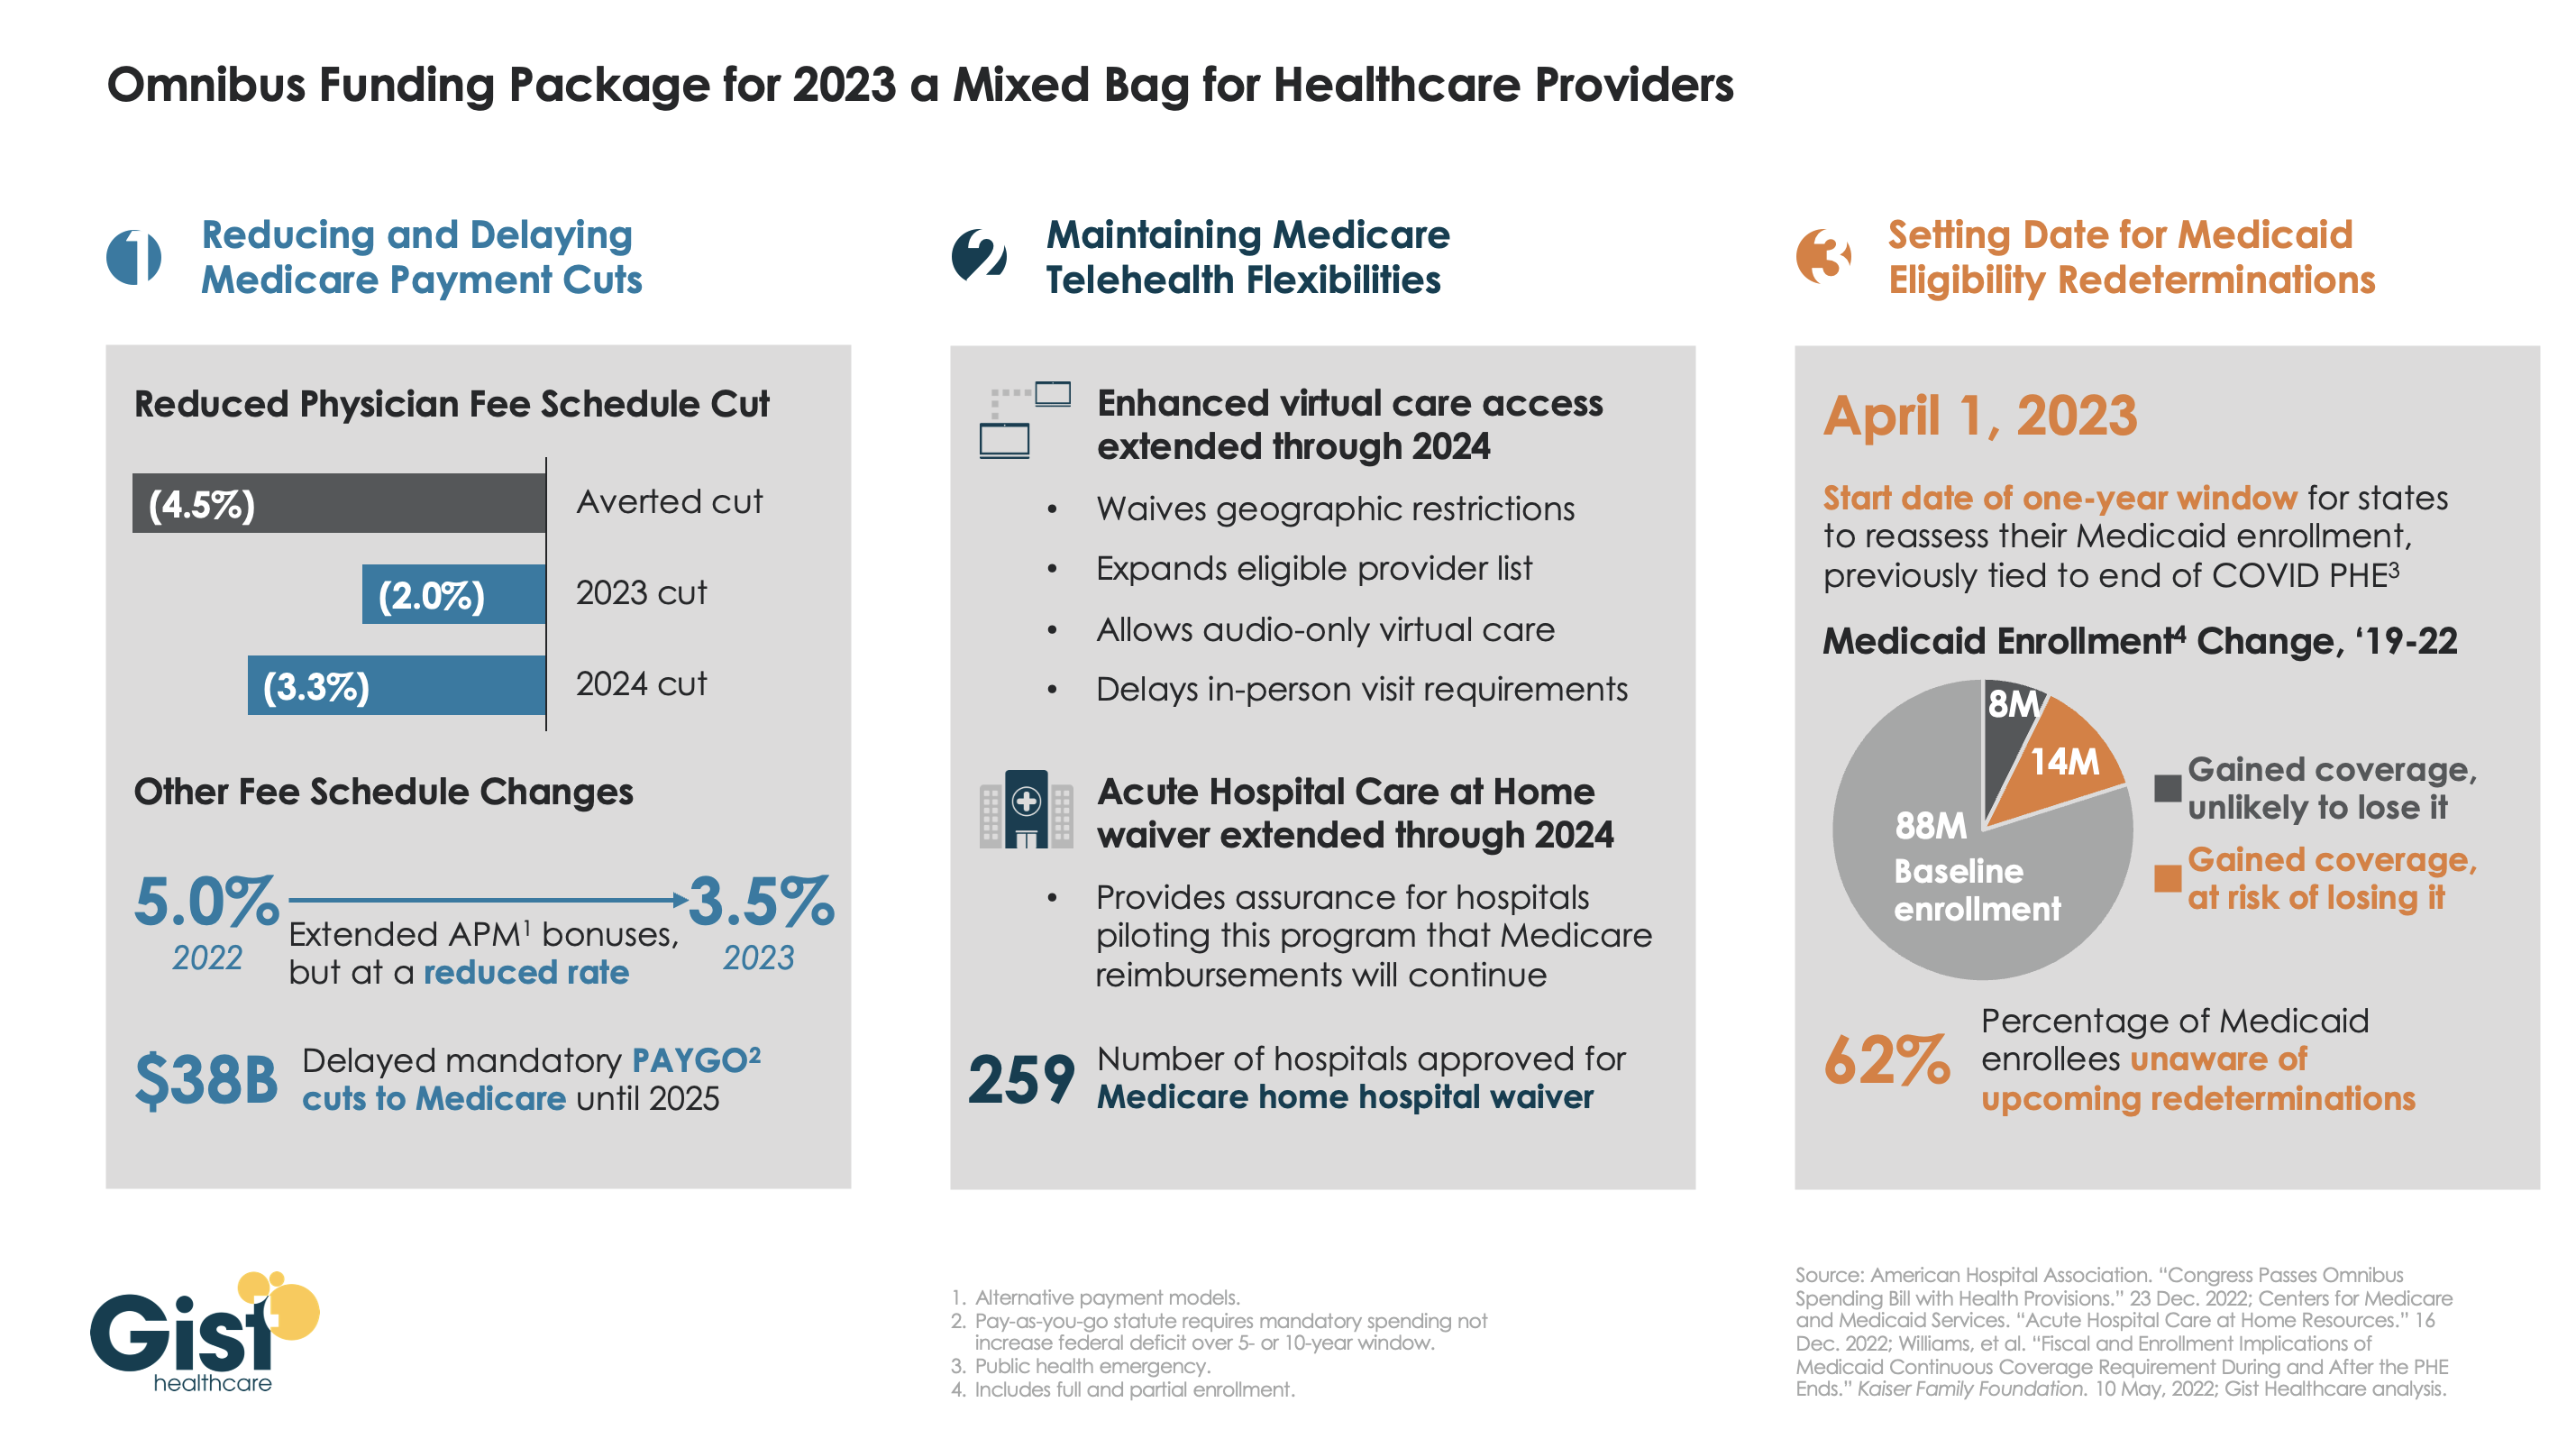
Late last week, President Biden signed a $1.7T spending package to fund the federal government through next September. While around half the funds are dedicated to defense, some important healthcare items made it into the bill, including a reduction in planned Medicare physician pay cuts and a two-year postponement of the $38B Medicare spending cut required by the PAYGO sequester.
The law also decoupled several measures from the end of the federal COVID public health emergency (PHE), setting April 1st as the start date for states to begin Medicaid eligibility redeterminations, and extending Medicare’s telehealth flexibilities and the Acute Hospital Care at Home waiver program through the end of 2024. For more details on these changes, see our graphic below.
The Gist: Medical groups were hoping for more of a reprieve from the Medicare physician fee schedule cuts, but Congress proved unwilling to address concerns over rising practice costs. We’re relieved that Medicare’s new telehealth and hospital at home policies will continue beyond the PHE, given the early interest we’ve seen from the provider community in embracing these new, more consumer-friendly care models.
Once the new Congress finally gets underway, we’re expecting this to be an uneventful two years for federal healthcare legislation, with the emphasis of health policy likely to shift toward states, federal agency rulemaking, and judicial activity.