

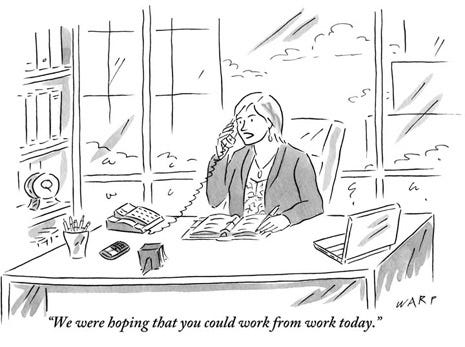
Cartoon – Working from Work


Private equity firm Apollo Global Management’s ownership of two large health systems — Louisville, Ky.-based ScionHealth and Brentwood, Tenn.-based Lifepoint Health — downgrades hospital services, hurts workers and puts patients at risk, according to a study published Jan. 11 by the Private Equity Stakeholder Project.
Since acquiring Lifepoint in 2018 and spinning off ScionHealth in 2021, Apollo has consolidated ownership of 220 hospitals in 36 states, with a workforce of about 75,000 employees. Many of the hospitals have experienced service cuts, layoffs, poor quality ratings and regulatory investigations, according to the report.
The report comes amid rising scrutiny of private equity hospital ownership.
In December, the Senate Budget Committee launched an investigation into the effects of private equity ownership on hospitals that specifically mentioned Apollo’s ownership of Lifepoint. Iowa Sen. Chuck Grassley and Rhode Island Sen. Sheldon Whitehouse requested “documents and detailed answers” about certain hospital transactions and the degree to which private equity firms are calling the shots at hospitals.
A Harvard Medical School-led study published Dec. 26 in JAMA also found that hospitals that are bought by private equity-backed companies are less safe for patients. On average, patients at private equity-purchased facilities had 25.4% more hospital-acquired conditions, according to the study.
“Apollo’s purchase of these hospital systems follows a disturbing pattern of harm caused by the growing influence of private equity in the healthcare sector,” PESP Healthcare Director Eileen O’Orady, said in a news release. “Private equity’s utmost priority to maximize short-term profit over the long-term viability of the companies it controls leads to excessive debt, cost cutting, worse outcomes for patients and deteriorating working conditions for employees. Apollo’s management of its hospitals seems to follow the usual playbook.”
The study, “Apollo’s Stranglehold on Hospitals Harms Patients and Healthcare Workers,” was developed in conjunction with the American Federation of Teachers and the International Association of Machinists and Aerospace Workers. Click here to access the full report.
Apollo, Lifepoint and ScionHealth did not respond to Becker’s request for comment.

The Nelson A. Rockefeller Institute of Government is a public policy think tank founded in 1981 that conducts cutting-edge research and analysis to inform lasting solutions to the problems facing New York State and the nation.
Introduction & Definitions
In 2023, I noted 10 trends within three broad categories in healthcare worth watching and provided a mid-year update on those trends. They included: the impact of unwinding the Public Health Emergency on insurance coverage, healthcare workforce shortages, price inflation, declining margins at hospitals, private equity in healthcare, consolidations, alternate payment models, attention to health equity, digital telehealth expansion, and the expansion of non-traditional providers in healthcare. These trends continue to be worth watching in 2024.
More significant than any one of these trends is the combined interaction of the trends in the industry overall—what I’ll call a “mega-trend,” which results in a trifurcation of the industry. Currently, there are parts of the healthcare industry struggling to exist. This is due to different factors, including high expenses, staffing challenges, and a lack of access to capital and technology, among other things. I call the types of healthcare entities that fall into this category “Today” entities because they exist now but may or may not exist in the future. In contrast, there is another set of entities in healthcare that have emerged in the last five or so years. They are becoming larger through consolidation and integration, and have greater access to capital and technology. I call these types of healthcare entities the “Tomorrow” entities because their size, resources, and forward-looking strategies are changing the future of healthcare.
In between these two categories, are existing and traditional entities in healthcare that seek sustaining strategies. I call these entities the “Striving Survivors” whose success and ability to persevere is still an open question. Most look like the healthcare entities of Today, but what distinguishes them is their ability to partner, use technology, and diversify what they offer. To understand the mega–trend phenomena of this trifurcation in healthcare and what’s happening within and across each of these three categories, this blog dissects how the trends I highlighted in 2023 are impacting the Today and the Tomorrow entities and discusses how the Striving Survivors are attempting to keep pace as the healthcare industry evolves.
The “Today” Healthcare Entities
As noted in my 2023 blog, price inflation and expense growth—particularly as they relate to workforce and labor costs—were two trends impacting existing healthcare organizations. Today’s healthcare entities are heavily reliant on people, and, unsurprisingly, increased expenses for personnel, which had a major impact on organizations’ bottom lines for the past few years, as did general inflation and increased supply prices. However, for some providers, revenue and patient volume have returned to levels comparable to pre–pandemic. According to Kaufman Hall, a healthcare consulting firm, by the end of 2023, some hospitals’ margins were beginning to stabilize.
In looking at what may happen in 2024 for providers, however, the return of patient volume and, therefore, more predictable revenue may not be enough to yield positive margins. This is because expenses are predicted to be challenging. Industry experts estimate that healthcare prices will grow 7 percent in the coming year. The estimate reflects increases in pharmaceutical costs, growing provider expenses given the high labor and supply costs noted earlier, and insurer rate increases.
Another challenge to the healthcare entities of Today is the availability of capital to make strategic investments. More of this capital is now being provided by private equity firms, an estimated $750 billion in the last decade. To secure capital in the private market, bond rating agencies typically favor larger providers because they are less risky. This, among other factors, has contributed to growing consolidation in the industry among physician groups, insurers, and hospitals. Not only do these entities need capital for projects like upgrades to existing facilities, but to also make strategic investments. Such investments include acquisitions of other providers or companies that add to the revenue base, or technologies that allow improvements in care delivery.
The Today entities are increasingly challenged with adapting to consumer demands for tech–enabled care options. Consumers want more tech–supported smart applications that allow them to book appointments or get assistance with care more quickly via chatbots. Consumers also want new options for care at home—including hospital–at–home, which provides acute care in a home-based setting, and home–based care. As noted in my November blog on AI in healthcare, access to such technologies is not only creating further separation between healthcare entities, but can also create further inequities among consumers.
The “Tomorrow” Healthcare Entities
With the challenges for the healthcare entities of Today outlined above, it is important to note that those same challenges are not as significant for the healthcare players of Tomorrow. This is because most are substantial in size and have sufficient revenue, technology, and capital resources—often in the form of private equity. And many of them did not start in healthcare. They include, for example, Amazon—which started as an online bookstore and now has annual revenues of over $500 billion, CVS—which started as a retail pharmacy and now has revenues close to $300 billion; Uber—which started as a tech-enabled taxi-like transport application and now has revenues of over $30 billion, and Microsoft—which started as computer company but has expanded into healthcare with annual revenues of over $200 billion.
Some of these companies have entered healthcare by partnering with, or acquiring companies already in the sector such as Amazon’s 2023 acquisition of One Medical, a tech–enabled primary care entity; the 2022 partnership between United Health Group and Change Healthcare, a technology company; and CVS’s official 2023 acquisition of Signify, a home health organization. This was on top of CVS’s earlier (2018) merger with health insurance company Aetna, and its 2022 partnership announcement with Uber with the stated aim of improving access to care and decreasing health inequities in underserved communities across the country. Other entities have increased their footprint in healthcare by launching their products, such as Microsoft’s 2020 launch of Cloud services, specifically for healthcare. Some of these companies are now collaborating, including the 2021 partnership between CVS Health and Microsoft, which was designed to customize care further, enable frontline workers to more easily access and use data, and digitize operations.
In addition to these large nontraditional healthcare entities, the health insurance industry has also experienced large–scale consolidation and diversification that enables them to compete. One of the most notable companies in the world of healthcare integration is the nation’s largest insurer, United Health Group (UHG). UHG continued to outpace provider margins, with 2023 third quarter margins for UHG at levels 14 percent higher year-over-year. The continued growth at UHG was largely due to the increasing number of individuals served and a growing provider base of 90,000 physicians, or 10 percent of all physicians nationwide. This contrasts with one of the largest provider margins (Kaiser) whose 2023 third-quarter margin was only $239 million, an improvement from the $1.5 billion loss they experienced in the third quarter from the previous year. Although no other insurers are as big as UHG, the next biggest including, Aetna, Anthem, Cigna, and Humana all had 2023 third–quarter net incomes ranging from $1 billion to $1.4 billion.
The Striving Survivors
Not all traditional healthcare entities are being left behind; I call these the Striving Survivors. They may currently be considered Today entities, but they are attempting to put in place strategies so they can be Tomorrow entities in the future. Here are three primary strategies that may help these entities survive into the future:
Conclusion
In 2024, it will not only be important for healthcare policymakers to monitor single trends such as the continued focus on health equity, the expansion of alternate payment models, or the cost of the healthcare workforce, but it will also be important to understand how trends may be interacting with each other to create larger market trends. Such is the case for the emergence of non-traditional players in healthcare, the influx of private equity, digital expansion, and major consolidations— which when combined —are resulting in a mega trend of trifurcation of the industry into Today, Tomorrow, and Striving entities in healthcare that are seeking to survive into the future. For healthcare policymakers, all these trends along with their interaction will be worth monitoring and understanding so that effective policies can be developed that result in a healthcare system that supports innovation, protects patients, reduces inequities, and results in better health outcomes at lower cost.

The new year dawned on a health insurance industry beset by challenges.
Only 7% of health plan executives view 2024 positively after being hammered by the coronavirus pandemic, regulatory turbulence and rising cost pressures, according to a Deloitte survey.
Costs are spiking, and health insurers remain uncertain how the lingering effects of COVID-19 will impact care utilization. Medicaid redeterminations are rewriting the coverage landscape state by state, while Medicare Advantage — the darling of payers’ business sheets — experiences significant regulatory upheaval.
Meanwhile, 2024 is a presidential election year. That’s adding more political uncertainty into the picture as Washington hammers payers over claims denials and the business practices of pharmacy benefit units.
Here’s what experts see coming down the pike for health insurers this year.
The number of Americans without insurance coverage is almost certainly going to rise this year as states overhaul their Medicaid rolls, experts say.
During the pandemic, continuous enrollment protections led a record number of people to enroll in Medicaid. But earlier this year, states resumed checking eligibility for the safety-net program. Around 14.4 million Americans have been removed from Medicaid due to the redeterminations process, many for administrative reasons like incorrect paperwork despite remaining eligible.
“We are going to see an increase in the uninsured rate for children and probably adults as well as a consequence,” said Joan Alker, executive director of the Georgetown University Center for Children and Families.
The question is how big of an increase, experts said. Redeterminations began in April, but lagging information and state differences in data reporting has made it difficult to determine where individuals are turning for coverage, and in what numbers.
Early signs suggest some people losing Medicaid have found plans in the Affordable Care Act exchanges, though it’s probably “a very small percentage,” Alker said. More than 20 million people have signed up for ACA coverage since open enrollment began in November — an all-time high, according to data released by the Biden administration in early January.
Experts say the growth is due in part to redeterminations, along with the effects of more generous federal subsidies. Those subsidies are slated to expire in 2025, meaning ACA enrollment should stay elevated until then.
But it’s unlikely everyone who loses Medicaid will find a home on the marketplaces. The cost of family coverage without an employer remains out of reach for many Americans. It’s also too early to determine how many people terminated from Medicaid have shifted into employer coverage — that data should also emerge as 2024 continues, said Matt Fiedler, a senior fellow with the Brookings Schaeffer Initiative on Health Policy.
Federal regulators have also taken a number of actions to try and curb improper procedural Medicaid losses, like cracking down on states with high levels of child disenrollments. Yet, procedural terminations are unlikely to improve significantly this year, experts said.
“We do see a very hopeful trend” in some states, like Washington and Oregon, embracing longer periods of continuous eligibility, Alker noted.
The government has ramped up ACA marketplace outreach, which — along with macro forces like a strong labor market — are positive signs that individuals no longer eligible for Medicaid may find alternative coverage, whether in the ACA exchanges or through employment.
But “it’s likely we’ll see an increase in the uninsured rate. I think the question is how much,” Fiedler said.
Healthcare costs are projected to grow much faster in 2024 than the historical average, fueled by inflation, supply chain disruption and labor pressures increasing provider wages. Those costs are burdening employers already stressed by worker mental health and deferred preventive screenings that could worsen health conditions down the line.
As a result, employers are investing heavily in mental health and substance use disorder services. Seven out of ten employers say mental healthcare access is a priority in 2024, and employers say they’ll turn to virtual care providers to address the need, according to a Business Group on Health survey.
As a result, employers are increasingly demanding integrated platforms combining different benefits, continuing a pivot away from the point solutions they were deluged with during the pandemic. Payers are racing to meet that need.
This year, UnitedHealthcare plans to integrate more than 20 standalone products into a “supported benefits platform,” said Dan Kueter, CEO of the payer’s employer and individual business, during an investor day in November.
Cigna, which focuses on employer-sponsored plans, plans to add more services to its behavioral health navigator to help employers personalize the platform for their employees this year, said CEO David Cordani during a November earnings call.
For their part, health insurers are likely to raise premiums and combat hospital reimbursement hikes in 2024 to control costs, according to credit rating agency Fitch Ratings.
However, that outlook is complicated by uncertainty around how much elevated care utilization seen in 2023 will continue. Some payers, like UnitedHealth and Humana, are forecasting high utilization, while others like CVS have said they expect it to drop.
More payers might pursue mergers and acquisitions or build out internal musculoskeletal management programs to control costs, said Prateesh Maheshwari, a managing director at venture capital firm Maverick Ventures. Hip and knee surgeries were an oft-cited driver of utilization last year.
Still, publicly traded health insurance companies could see their margins moderately decrease in 2024, Fitch said.
Surging demand for GLP-1s means insurance coverage for the drugs is expected to increase next year, putting more stress on the nation’s pressured healthcare payment system. GLP-1s, or glucagon-like peptide-1 drugs, have historically been used to treat diabetes but have shown efficacy in weight loss.
The drugs are exceedingly expensive, but that hasn’t stopped people from trying to get their hands on GLP-1s — off-label or not. TD Cowen predicts GLP-1 sales could reach $102 billion by 2030, with $41 billion of that for obesity.
More private payers are considering covering the drugs next year, though the doors to coverage aren’t being thrown wide open. According to a November survey by the International Foundation of Employee Benefit Plans, while 76% of employers provide GLP-1 drug coverage for diabetes, just 27% provide coverage for weight loss.
Yet, 13% are considering adding coverage for weight loss.
As insurance coverage increases, payers will ensure only eligible patients are accessing the drugs through checks like step therapy, said Nathan Ray, head of healthcare M&A at consultancy West Monroe. As a result, access could remain restricted.
Payers will also tie coverage for GLP-1s to additional behavioral management programs. That trend has proved a gold rush for chronic condition management companies and telehealth providers, which have rushed to stand up new business lines for weight loss that include GLP-1s.
“Things like this, that include the opportunity for medication along with the accompaniment of behavioral change, is where I think the market will go in 2024,” said Heather Dlugolenski, Cigna’s U.S. commercial strategy officer.
Proponents of weight loss medication are also eyeing a potential overturn of the ban on Medicare coverage of weight loss drugs next year. A growing number of lawmakers (and drugmakers standing to profit from Medicare coverage) have come out in support of a bill introduced in 2023 to allow Medicare to cover anti-obesity drugs.
The bill is unlikely to be prioritized given Washington has a lot on its plate during the election year, but passage isn’t out of the realm of possibility, experts said.
More seniors will select Medicare Advantage plans this year, further growing a program that recently saw its enrollment sneak past that of traditional Medicare.
In MA, the government contracts with private insurers to manage the care of Medicare seniors. MA has become increasingly popular, swelling to cover 31 million people last year — a boon for insurers offering the coverage, which can be twice as profitable for private payers than other types of plans.
As such, MA plans have been advertising heavily, trumpeting their supplemental benefits like gym memberships or subsidized groceries. Seniors find those benefits attractive, Brookings’ Fiedler said, and may not understand that MA plans may not cover as much medical care as traditional Medicare.
”My best bet would be MA enrollment in the near term continues to grow,” Fiedler said. “I don’t think we’re at the ceiling yet.”
Despite elevated costs in 2023 from seniors using more medical care, insurers generally didn’t cut back on plan benefits this year as they continue to compete for members.
Major payers in MA, including Humana, UnitedHealthcare, Centene and Kaiser Permanente, expanded their geographic markets for 2024, even as some lagging competitors like Cigna consider exiting MA altogether.
Yet, the program hasn’t been without its complications. Payers cried foul last year over tweaks to MA rates, star ratings and reimbursement audits, with Humana and Elevance suing to stop the changes.
MA “should remain a key long-term growth driver for managed care, but we see a more challenging setup in 2024 as weaker funding, risk coding changes, and lower Star ratings combine to pressure margins,” J.P. Morgan analysts wrote in an outlook report published late last year.
Insurers were also plagued in 2023 by congressional hearings and lawsuits over their claims reviews processes, sparking criticism that seniors may not be receiving the care they’re due.
Scrutiny from Washington around such practices is likely to continue.
“We are seeing both in the Senate and House a lot of interest in peeling back the layers of the onion of how big health plans are operating their Medicare Advantage programs. That’s going to continue to be an issue,” said Reed Stephens, a healthcare chair at law firm Winston & Strawn who focuses on risk.
Though it’s unlikely that legislation will be passed reforming MA, Reed said. Overall, regulatory and political turbulence should subside somewhat this year.
The rate and marketing changes were “short of the last train out of the station,” said Brookings’ Fiedler. “The administration is unlikely to want a big fight with MA plans in an election year.”
Major pharmacy benefit managers will introduce more options billed as transparent and cost-effective to retain clients after some turned to upstart competitors last year.
PBM clients are clamoring for outcomes-based pricing, with structures tying PBM compensation to measures like adherence, according to a J.P. Morgan survey from late 2023. Clients also want transparency, whether more data sharing or full administration models.
The changes aren’t revolutionary, but they hint at ongoing distrust of major PBMs from benefits teams, J.P. Morgan said.
UnitedHealth’s Optum Rx, Cigna’s Express Scripts and CVS Caremark — which together control 80% of prescriptions in the U.S. — have all recently launched new programs, partnerships or models they say are more affordable and transparent to meet the demand.
The industry is likely to see more moves along those lines in 2024, experts say — especially as Congress considers legislation to reform PBMs. The Lower Costs, More Transparency Act passed the House in December. The bill is seen as unlikely to clear the Senate, but specific measures, like forced PBM transparency, could make it into larger legislative packages.
The passing of measures around transparency could satisfy politicians’ need for a win when it comes to drug pricing without creating meaningful reform in the sector, according to Jefferies analyst Brian Tanquilut.
Yet, momentum to do something about high drug costs will certainly carry into this year. Presidential candidates on both sides of the aisle are expected to wield the issue on the campaign trail.
“The companies in those markets are going to have to stay nimble and keep on their toes,” said Winston & Strawn’s Stephens.
Companies like UnitedHealth, CVS and Humana will continue building out networks of physical care sites in 2024. New M&A guidelines from the Department of Justice and Federal Trade Commission could raise the bar for merger approvals, but the value proposition for insurers to acquire healthcare providers is too high for them to be dissuaded, experts said.
Payers will continue to pursue as many deals “as they can find willing, available targets,” said West Monroe’s Ray.
By directing members to owned locations for medical needs, health insurers can essentially pay themselves for providing a service, keeping more revenue in-house. As a result, payers — especially those with a large presence in MA, which incentivizes organizations to better manage cost — will stay on the hunt for acquisition targets.
While healthcare M&A was relatively slow in 2023, 68% of senior leaders in the sector expect deal volume to rise in 2024, according to a survey by investment bank Jefferies.
Optum — which employs or is affiliated with around one-tenth of all doctors in the U.S. — is already eyeing M&A. The health services arm of UnitedHealth is currently pursuing an acquisition of a physician-owned clinic chain in Oregon, even as it comes off a number of big provider buys in 2023, including the multi-billion-dollar acquisitions of home health providers Amedisys and LHC Group.
Cigna has also said it plans to look for smaller strategic acquisitions to grow its business, after a potential merger with rival Humana crumbled late last year.

Allina doctors and physician assistants said that chronic understaffing, high levels of burnout and compromised patient safety due to the corporatization of care motivated them to seek union representation.
“We have been seeing the shift of healthcare control going to corporations and further and further away from patient voices and patient advocacy. That really fell apart during the pandemic,” said Allina physician Liz Koffel during a press conference on Aug. 15 announcing primary care physicians’ unionization drive.
Koffel detailed workplace grievances that she said occurred due to Allina’s push for profits, including high productivity demands backed by few support staff and the health system’s now-abandoned policy of interrupting non-emergency medical care for patients with high levels of debt.
In a statement to Healthcare Dive, an Allina spokesperson said the system had “committed to taking steps to make sure the National Labor Relations Board’s process was fair to all involved,” and that it would not take further procedural action against the union.
Across the country, physicians’ feelings of limited autonomy is driving similar interest in unionization, according to John August, director of healthcare labor relations at Cornell’s School of Industrial and Labor Relations.
“Frankly, I’ve never seen anything like it in my whole career — where so many people are saying exactly the same thing at the same time, from a profession that heretofore has been essentially not unionized,” he said.
Although doctors have historically shown little interest in unionization — the physician unionization rate was under 6% nationwide in 2021 — the tide is beginning to turn.
Doctors are increasingly working in consolidated hospitals owned by larger health systems or private equity firms. They report consolidation limits the influence they have on their day-to-day jobs, according to a December study from the Physician Advocacy Institute.
In addition, other options, such as physician-owned practices, are disappearing, with the percentage of owned practices falling 13% between 2012 and 2022, according to an analysis from the American Medical Association.
Elsewhere in the healthcare industry, unionization and strikes have led to gains for workers.
Last year, nurses at Robert Wood Johnson University Hospital successfully negotiated nurse-to-patient ratios by holding the picket line for nearly four months in New Jersey, and more than 75,000 healthcare workers secured a 20% raise over four years at Kaiser Permanente by staging the largest healthcare strike in recent history.


UnitedHealth is bracing for a struggle next year with the financial effects of shifting Medicare Advantage payment rates.
The health insurance giant released 2024 guidance on Tuesday that included a number of less favorable metrics than analysts expected.
During the company’s investor day in New York City on Wednesday, UnitedHealth executives blamed the outlook on an MA rate change issued by regulators earlier this year that insurers slam as a payment cut.
Pressured metrics include slower MA membership growth, lower margins at UnitedHealthcare and a higher medical loss ratio. UnitedHealth forecast a 2024 MLR of 84%, a full percentage point higher than analysts’ consensus expectation.
Despite the MA headwind, UnitedHealthcare’s financial targets overall still came in in-line or ahead of analyst expectations.
UnitedHealth is a behemoth in the U.S. healthcare industry, with one of the largest pharmacy benefits managers, an expanding healthcare IT arm and a growing presence in care delivery, including a network of tens of thousands of physicians.
UnitedHealth is also the dominant health insurer in many markets, including in MA. The Minnesota-based company is the largest provider of the privately-run Medicare plans.
Management has said they expect their share of the market to grow as more seniors age into the government insurance program and select MA over traditional Medicare.
However, UnitedHealth is now saying that MA growth could be depressed next year thanks to a rate notice from the CMS that’s deeply unpopular with insurers.
Earlier this year, the CMS finalized MA rates for 2024 that regulators said should result in a 3.3% increase in revenue for health insurers in the program. The changes also include a new approach to risk adjustment meant to curb upcoding, a practice where insurers inflate their members’ sicknesses to get higher payments from the government.
However, insurers have said the changes, which are being phased in over the next three years, will result in a net decrease to MA revenue overall.
“That rate notice has a material impact in terms of revenues associated with our Medicare Advantage portfolio, and as you can see that ripples through the metrics of the organization,” CEO Andrew Witty said during UnitedHealth’s investor day.
UnitedHealthcare, UnitedHealth’s health insurance division, now expects slower Medicare revenue and membership growth next year than analysts expected.
UnitedHealth expects to add between 325,000 and 375,000 Medicare Advantage members next year, representing almost 4% growth at the midpoint — “well below our model,” commented JP Morgan analyst Lisa Gill in a note.
That’s compared to 11% membership growth year to date in 2023, according to CMS data cited in a TD Cowen note. Previously, UnitedHealth leadership said they expected to grow above the overall MA industry growth rate in 2024, so “this appears to be a disappointment,” TD Cowen analyst Gary Taylor wrote.
However, “we are not materially surprised to see the slower growth rate in 2024 given the changes with the risk adjustment,” Gill said.
Some payers have said the rate changes could force them to cut benefits in MA. Yet, UnitedHealth has spent the last six months reconfiguring its plans in response to the rate notice, looking for ways to contain costs without curtailing benefits, Witty said.
UnitedHealthcare should bring in about $303 billion in revenue next year, mostly driven by Medicaid upside, the company said. TD Cowen’s Taylor noted he was unsure why UnitedHealth forecast the Medicaid improvement, given Medicaid payers are shedding members as states recheck eligibility for the safety-net insurance coming out of the COVID-19 pandemic.
UnitedHealth thinks its Medicaid enrollment will drop by up to 200,000 members next year due to redeterminations, the company said.
UnitedHealth leadership devoted half of their investor day to talking about the insurer’s plans to expand value-based care arrangements — a “core objective” for the next several years, Witty said.
A key actor in striving for that objective is Optum Health, UnitedHealth’s care delivery network that’s under the umbrella of its health services business Optum.
Optum released stronger 2024 guidance than analysts expected. Much of that growth is due to better-than-expected margins for Optum Health, analysts said.
Optum Health has been working to transition commercial lives into more lucrative value-based arrangements, management said in comments earlier this year.
Currently, Optum Health has about 4 million lives in fully accountable payment arrangements — a number that’s nearly doubled from 2021, said UnitedHealthcare CEO Brian Thompson during the investor day.
Optum Health expects to add another 750,000 lives by the end of next year.
”You should expect us to grow that number substantially each year,” Thompson said. “Our long-term ambition is to transition as many people as possible into value-based care.”
Overall, UnitedHealth expects 2024 adjusted profit of $27.50 to $28 a share, largely in line with what analysts expected.
Expected revenue is $400 billion to $403 billion, higher than Wall Street consensus.

Jersey City, N.J.-based CarePoint Health and Hudson Regional Hospital in Secaucus, N.J., have signed a letter of intent to combine under a new management company, Hudson Health System, which will incorporate the acute care facilities of both organizations.
Hudson Health System would be a four-hospital system that includes both nonprofit and for-profit hospitals in an innovative new model and continue to be in-network with all major payers.
The transaction is expected to strengthen CarePoint’s financial position and improve patient care and outcomes across the hospitals, according to John Rimmer, CarePoint’s chief medical officer, said in a Jan. 12 news release.
“Hudson County is the most diverse and dynamic community in New Jersey, and its residents deserve nothing less than exceptional care, affordable access, the most advanced specialties and technology, and the highest caliber physicians to serve patients’ needs, especially the underserved communities that rely on our facilities,” said CarePoint President and CEO Achintya Moulick, MD, who will be president and CEO of Hudson Health System. “With adequate state support, I believe we can build a hospital system that will deliver on its core mission.”
The letter of intent is the precursor to a new organizational structure and operating plan that will require approval from the New Jersey State Department of Health. Hudson Health System would be a four-hospital system that includes Hudson Regional, Bayonne Medical Center, Hoboken University Medical Center and Christ Hospital in Jersey City.
“This new system expands our mutual impact far beyond and far sooner than what we could ever have achieved separately,” Hudson Regional CEO Nizar Kifaieh, MD, said. “The possibilities are enormous and will energize the entire medical community to deliver that much more to the patients.”
More details about Hudson Health System are expected to be announced in the coming days.
There is no one-size-fits-all when it comes to managing teams, and managers may take different approaches based on team size, organization size, organizational needs and other factors. However, one approach has risen to the surface recently: “quiet management.”
Career coach Adam Broda posted about the topic on LinkedIn last year. He said quiet managers stop checking employee start and stop times, let people choose to work where they want, encourage guilt-free time off, remove unnecessary meetings and distractions, listen to team feedback about how the manager manages, and give workers what they need to be successful, then step away and trust them to deliver.
“Quiet managers operate with a high level of trust in their employers and don’t micromanage,” Mr. Broda wrote. “This way, the job becomes more of a support role and gives managers the time to get out in front and lead by example instead of leading by structure and administration.”
To gain insight into what quiet management may look like in healthcare, Becker’s discussed the topic with three leaders: Kevin Mahoney, CEO of the University of Pennsylvania Health System, part of Philadelphia-based Penn Medicine, which also includes the Perelman School of Medicine; Karen Frenier, BSN, RN, senior vice president of human resources and chief nurse executive at Orlando (Fla.) Health; and Mitch Cloward, president of Salt Lake City-based Intermountain Health’s Desert Region.
Mr. Mahoney leads health system operations, spanning six hospitals, 11 multispecialty centers and hundreds of outpatient facilities in Pennsylvania, Delaware and New Jersey. He said he demonstrates quiet management by emphasizing the “why” behind Penn Medicine’s business, rather than the “how.”
“At Penn Medicine, we believe we were founded to create and disseminate knowledge, and that’s what we try to do,” he said.
The organization has found success with this approach; the breakthrough messenger ribonucleic acid technology that enabled the COVID-19 vaccines from Moderna and Pfizer-BioNTech came from the organization.
“So when you’re doing your job, you’re not just doing your revenue cycle job,” Mr. Mahoney said. “You’re also creating a hospital margin that allows us to fund research.”
He said he also works to be visible and assumes positive intent.
“I think everybody comes to work to do their very best,” Mr. Mahoney added. “We give them guidelines, we set priorities, but we need to let them get the job done.”
Ms. Frenier described her management style as authentic and transparent. This means clearly and frequently communicating with team members.
“With quiet management, I think, communicate once and get out of the way,” she said. “And my conflict a little bit [with that] is you can do quiet management and have visibility at the same time. And I think that is so important. What is important for us, Orlando Health, our culture, my leadership style is very clear expectations, what our goals are, what our priorities are.”
Ms. Frenier also subscribes to the lean management philosophy of leaders “going to the gemba” — a Japanese term for “actual place” — a principle that involves direct observation to improve work processes.
“It doesn’t make any sense for me to say, ‘Here’s how to fix the problem.’ The problem needs to be answered by the team members who do the work,” she said. “Our role [as managers] is to remove obstacles, move things along sometimes. So to me, that’s part of quiet management. However, my conflict is that there’s nothing quiet about it.”
The approach is one Mr. Cloward said is woven throughout the healthcare workforce.
“Quiet leadership and quiet managers are frequently observed in healthcare,” he said. “This may be associated with our primary purpose and our mission of selflessly devoting ourselves to caring for our patients and the communities we serve. I also believe that most caregivers and leaders that choose a career in healthcare do so because they want to help others.”
Refining meeting strategy
Meetings are an important part of a manager’s responsibilities, but too many meetings could leave some employees overwhelmed and less clear on the task at hand. A 2022 report from Otter.ai and the University of North Carolina at Charlotte found nearly one-third of meetings are unnecessary and that organizations waste millions of dollars on them.
From Mr. Mahoney’s perspective, the productivity of meetings can get lost in the virtual world and in Zoom meetings, so his focus is on getting back to productive meetings.
“You wouldn’t go into a conference room and put a brown bag on your head,” he said. “But people get on a Zoom meeting and they’ll turn the camera off, and we’re losing the engagement.”
To maximize engagement, his overall philosophy is that daily huddles on units are better than meetings to solve a problem, interact and move forward with a solution. He said video and online tools have also been helpful to disseminate his words to 50,000 employees.
Ms. Frenier also expressed support for huddles over formal sit-down meetings. She said 259 nurse leaders across the company attended a huddle Jan. 11.
“That excites me,” she said. “That number is as good as when we started it a little over a year ago. And, when I start with my updates, if Hospital Consumer Assessment of Healthcare Providers and Systems, our customer experience and emergency department throughput is our top work, then I’m very consistent in giving us an update on how that work is. [Managers must] be clear with your expectations. You can’t talk about a new one every day. But you’ve got a follow-up [via huddles]. The best way for us to connect is to be visible, develop relationships.”
To help with that connection, Orlando Health recently rolled out new behavioral expectations for workers across all teams. The expectations center around communication, connection, commitment and curiosity.
“We have written out what that means,” Ms. Frenier said. “The next step for that is to make our coaching plans easier for leaders to have that conversation [about those expectations].”
Facing conflict head-on
No matter the leadership style, managers at one time or another likely will have to handle challenging conversations or conflicts within their team. Mr. Mahoney’s approach: “Handle them straightforward first thing in the morning, get it resolved, get it behind us, and then don’t let it linger and carry forward.”
He said it is especially important to address the obstacle or problem rather than the individual.
“I do that with a lot of data, not just Penn data, but industry trends,” Mr. Mahoney said. “We all think we’re an island unto ourselves. [But no matter the organization], the issues are very similar.
“We can’t control our external environment; we can just control our response to it. So a lot of the confrontational meetings that we have are because we have to change the way we’re doing business. Not because we’re doing it wrong, but because of the macroeconomic headwinds that we’re facing.”
Approaching challenging situations as a quiet manager often reflects the style of “servant leadership,” Mr. Cloward said.
“I strive to understand what they hope to accomplish in their current job and what they hope to achieve over time with career goals and aspirations,” Mr. Cloward said. “I dedicate time to helping them remove barriers to reduce frustration and increase satisfaction as we serve. I establish clear direction so that expectations are fully understood and in doing so, I strive to inspire rather than force, coerce or incite fear.”
Being effective — quietly
There are other practices or habits that quiet managers use outside of handling challenging conversations or conflicts within their team. Mr. Mahoney, for example, stands at a connecting hallway between two buildings that is frequented by workers and answers people’s questions in between shifts.
He is also in favor of asking workers more open-ended questions such as, “What can I do to make your job easier?” and “What obstacles did you face today that I could work to eliminate?” instead of a question like, “How many bills did we collect today?”
“Because, again, people know their jobs,” Mr. Mahoney said. “They don’t need me to do their jobs.”
Ms. Frenier agreed.
“It is our role [as managers] to allow the team members to be the best they can be and get out of the way,” she said. “… Supporting them with the right tools and documentation that’s not so burdensome, and, if there’s technology that helps us do our job better, that’s the work we should be doing.”
However, being effective as a quiet manager does not begin only once someone is hired and part of a team. Rather, it can start as early as the hiring process, Mr. Cloward said, and approaching the process from this angle can improve workplace culture.
“Quiet leaders are leaders who have been disciplined in the hiring process,” he said. “They hire the very best caregivers who not only have technical/clinical skills, but also human skills — caregivers who are altruistic, who devote themselves to serving our patients and our communities.”

