A recent engagement with a health system executive team to discuss an underperforming service line uncovered a serious issue that’s becoming more common across the industry.
“Our providers are more productive than ever,” the CFO informed our team, “and yet we keep losing money on the service line.”
After digging into their physician compensation model, we came upon one source of the system’s issue. Because it was incentivizing physician RVUs equally across all payers, its providers responded, quite rationally, by picking up market share where growth was easiest: Medicaid patients, who weren’t generating any margin.
“We recognize that we’ve been employing these physicians as loss leaders in order to generate downstream revenue,” the CFO shared, “but what’s the point of that revenue if there’s no longer any downstream margin?”
The economics of physician employment becomes a tough conversation very quickly; it’s a sensitive topic to many, and one with myriad facets.
But the loss leader physician employment model obviously only works when it produces positive downstream margins.
We’re in a critical window of time, where hospital margins are just beginning to recover as volumes return—but those volumes are not necessarily in the same places as before.
The opportunity is ripe for systems to work closely with their aligned physicians to reexamine the post-pandemic margin picture for individual service lines and ensure incentives are aligning all parties to hit operating margin goals.
Are these kinds of conversations taking place at your health system?
Tuesday, the, FTC, and DOJ announced creation of a task force focused on tackling “unfair and illegal pricing” in healthcare. The same day, HHS joined FTC and DOJ regulators in launching an investigation with the DOJ and FTC probing private equity’ investments in healthcare expressing concern these deals may generate profits for corporate investors at the expense of patients’ health, workers’ safety and affordable care.
Thursday’s State of the Union address by President Biden (SOTU) and the Republican response by Alabama Senator Katey Britt put the spotlight on women’s reproductive health, drug prices and healthcare affordability.
Friday, the Senate passed a $468 billion spending bill (75-22) that had passed in the House Wednesday (339-85) averting a government shutdown. The bill postpones an $8 billion reduction in Medicaid disproportionate share hospital payments for a year, allocates $4.27 billion to federally qualified health centers through the end of the year and rolls back a significant portion of a Medicare physician pay cut that kicked in on Jan. 1. Next, Congress must pass appropriations for HHS and other agencies before the March 22 shutdown.
And all week, the cyberattack on Optum’s Change Healthcare discovered February 21 hovered as hospitals, clinics, pharmacies and others scrambled to manage gaps in transaction processing. Notably, the American Hospital Association and others have amplified criticism of UnitedHealth Group’s handling of the disruption, having, bought Change for $13 billion in October, 2022 after a lengthy Department of Justice anti-trust review. This week, UHG indicates partial service of CH support will be restored. Stay tuned.
Just another week for healthcare: Congressional infighting about healthcare spending. Regulator announcements of new rules to stimulate competition and protect consumers in the healthcare market. Lobbying by leading trade groups to protect funding and disable threats from rivals. And so on.
At the macro level, it’s understandable: healthcare is an attractive market, especially in its services sectors. Since the pandemic, prices for services (i.e. physicians, hospitals et al) have steadily increased and remain elevated despite the pressures of transparency mandates and insurer pushback. By contrast, prices for most products (drugs, disposables, technologies et al) have followed the broader market pricing trends where prices for some escalated fast and then dipped.
While some branded prescription medicines are exceptions, it is health services that have driven the majority of health cost inflation since the pandemic.
UnitedHealth Group’s financial success is illustrative:
it’s big, high profile and vertically integrated across all major services sectors. In its year end 2023 financial report (January 12, 2024) it reported revenues of $371.6 Billion (up 15% Year-Over-Year), earnings from operations up 14%, cash flows from operations of $29.1 Billion (1.3x Net Income), medical care ratio at 83.2% up from 82% last year, net earnings of $23.86/share and adjusted net earnings of $25.12/share and guidance its 2024 revenues of $400-403 billion. They buy products using their scale and scope leverage to pay less for services they don’t own less and products needed to support them. It’s a big business in a buyer’s market and that’s unsettling to many.
Big business is not new to healthcare:
it’s been dominant in every sector but of late more a focus of unflattering regulator and media attention. Coupled with growing public discontent about the system’s effectiveness and affordability, it seems it’s near a tipping point.
David Johnson, one of the most thoughtful analysts of the health industry, reminded his readers last week that the current state of affairs in U.S. healthcare is not new citing the January 1970 Fortune cover story “Our Ailing Medical System”
“American medicine, the pride of the nation for many years, stands now on the brink of chaos. To be sure, our medical practitioners have their great moments of drama and triumph. But much of U.S. medical care, particularly the everyday business of preventing and treating routine illnesses, is inferior in quality, wastefully dispensed, and inequitably financed…
Whether poor or not, most Americans are badly served by the obsolete, overstrained medical system that has grown up around them helter-skelter. … The time has come for radical change.”
Johnson added: “The healthcare industry, however, cannot fight gravity forever. Consumerism, technological advances and pro-market regulatory reforms are so powerful and coming so fast that status-quo healthcare cannot forestall their ascendance. Properly harnessed, these disruptive forces have the collective power necessary for U.S. healthcare to finally achieve the 1970 Fortune magazine goal of delivering “good care to every American with little increase in cost.”
He’s right.
I believe the U.S. health system as we know it has reached its tipping point. The big-name organizations in every sector see it and have nominal contingency plans in place; the smaller players are buying time until the shoe drops. But I am worried.
I am worried the system’s future is in the hands of hyper-partisanship by both parties seeking political advantage in election cycles over meaningful creation of a health system that functions for the greater good.
I am worried that the industry’s aversion toprice transparency, meaningful discussion about affordability and consistency in defining quality, safety and value will precipitate short-term gamesmanship for reputational advantage and nullify systemness and interoperability requisite to its transformation.
I am worried that understandably frustrated employers will drop employee health benefits to force the system to needed accountability.
I am worried that the growing armies of under-served and dissatisfied populations will revolt.
I am worried that its workforce is ill-prepared for a future that’s technology-enabled and consumer centric.
I am worried that the industry’s most prominent trade groups are concentrating more on “warfare” against their rivals and less about the long-term future of the system.
I am worried that transformational change is all talk.
It’s time to start an adult conversation about the future of the system. The starting point: acknowledging that it’s not about bad people; it’s about systemic flaws in its design and functioning. Fixing it requires balancing lag indicators about its use, costs and demand with assumptions about innovations that hold promise to shift its trajectory long-term. It requires employers to actively participate: in 2009-2010, Big Business mistakenly chose to sit out deliberations about the Affordable Care Act. And it requires independent, visionary facilitation free from bias and input beyond the DC talking heads that have dominated reform thought leadership for 6 decades.
Or, collectively, we can watch events like last week’s roll by and witness the emergence of a large public utility serving most and a smaller private option for those that afford it. Or something worse.
P.S. Today, thousands will make the pilgrimage to Orlando for HIMSS24 kicking off with a keynote by Robert Garrett, CEO of Hackensack Meridian Health tomorrow about ‘transformational change’ and closing Friday with a keynote by Nick Saban, legendary Alabama football coach on leadership. In between, the meeting’s 24 premier supporters and hundreds of exhibitors will push their latest solutions to prospects and customers keenly aware healthcare’s future is not a repeat of its past primarily due to technology. Information-driven healthcare is dependent on technologies that enable cost-effective, customized evidence-based care that’s readily accessible to individuals where and when they want it and with whom.
And many will be anticipating HCA Mission Health’s (Asheville NC) Plan of Action response due to CMS this Wednesday addressing deficiencies in 6 areas including CMS Deficiency 482.12 “which ensures that hospitals have a responsible governing body overseeing critical aspects of patient care and medical staff appointments.” Interest is high outside the region as the nation’s largest investor-owned system was put in “immediate jeopardy” of losing its Medicare participation status last year at Mission. FYI: HCA reported operating income of $7.7 billion (11.8% operating margin) on revenues of $65 billion in 2023.
Last week, Congress avoided a partial federal shutdown by passing a stop-gap spending bill and now faces March 8 and March 22 deadlines for authorizations including key healthcare programs.
This week, lawmakers’ political antenna will be directed at Super Tuesday GOP Presidential Primary results which prognosticators predict sets the stage for the Biden-Trump re-match in November. And President Biden will deliver his 3rd State of the Union Address Thursday in which he is certain to tout the economy’s post-pandemic strength and recovery.
The common denominator of these activities in Congress is their short-term focus: a longer-term view about the direction of the country, its priorities and its funding is not on its radar anytime soon.
The healthcare system, which is nation’s biggest employer and 17.3% of its GDP, suffers from neglect as a result of chronic near-sightedness by its elected officials. A retrospective about its funding should prompt Congress to prepare otherwise.
U.S. Healthcare Spending 2000-2022
Year-over-year changes in U.S. healthcare spending reflect shifting demand for services and their underlying costs, changes in the healthiness of the population and the regulatory framework in which the U.S. health system operates to receive payments. Fluctuations are apparent year-to-year, but a multiyear retrospective on health spending is necessary to a longer-term view of its future.
The period from 2000 to 2022 (the last year for which U.S. spending data is available) spans two economic downturns (2008–2010 and 2020–2021); four presidencies; shifts in the composition of Congress, the Supreme Court, state legislatures and governors’ offices; and the passage of two major healthcare laws (the Medicare Modernization Act of 2003 and the Affordable Care Act of 2010).
During this span of time, there were notable changes in healthcare spending:
In 2000, national health expenditures were $1.4 trillion (13.3% of gross domestic product); in 2022, they were $4.5 trillion (17.3% of the GDP)—a 4.1% increase overall, a 321% increase in nominal spending and a 30% increase in the relative percentage of the nation’s GDP devoted to healthcare. No other sector in the economy has increased as much.
In the same period, the population increased 17% from 282 million to 333 million, per capita healthcare spending increased 178% from $4,845 to $13,493 due primarily to inflation-impacted higher unit costs for , facilities, technologies and specialty provider costs and increased utilization by consumers due to escalating chronic diseases.
There were notable changes where dollars were spent: Hospitals remained relatively unchanged (from $415 billion/30.4% of total spending to $1.355 trillion/31.4%), physician services shrank (from $288.2 billion/21.1% to $884.8/19.6%) and prescription drugs were unchanged (from $122.3 billion/8.95% to $405.9 billion/9.0%).
And significant changes in funding Out-of-pocket shrank from 14.2% ($193.6 billion in 2020) to (10.5% ($471 billion) in 2020, private insurance shrank from $441 billion/32.3% to $1.289 trillion/29%, Medicare spending grew from $224.8 billion/16.5% to $944.3billion/21%; Medicaid and the Children’s Health Insurance Program spending grew from $203.4 billion/14.9% to $7805.7billion/18%; and Department of Veterans Affairs healthcare spending grew from $19.1 billion/1.4% to $98 billion/2.2%.
Looking ahead (2022-2031), CMS forecasts average National Health Expenditures (NHE) will grow at 5.4% per year outpacing average GDP growth (4.6%) and resulting in an increase in the health spending share of Gross Domestic Product (GDP) from 17.3% in 2021 to 19.6% in 2031.
The agency’s actuaries assume
“The insured share of the population is projected to reach a historic high of 92.3% in 2022… Medicaid enrollment will decline from its 2022 peak of 90.4M to 81.1M by 2025 as states disenroll beneficiaries no longer eligible for coverage. By 2031, the insured share of the population is projected to be 90.5 percent. The Inflation Reduction Act (IRA) is projected to result in lower out-of-pocket spending on prescription drugs for 2024 and beyond as Medicare beneficiaries incur savings associated with several provisions from the legislation including the $2,000 annual out-of-pocket spending cap and lower gross prices resulting from negotiations with manufacturers.”
My take:
The reality is this: no one knows for sure what the U.S. health economy will be in 2025 much less 2035 and beyond. There are too many moving parts, too much invested capital seeking near-term profits, too many compensation packages tied to near-term profits, too many unknowns like the impact of artificial intelligence and court decisions about consolidation and too much political risk for state and federal politicians to change anything.
One trend stands out in the data from 2000-2022: The healthcare economy is increasingly dependent on indirect funding by taxpayers and less dependent on direct payments by users.
In the last 22 years, local, state and federal government programs like Medicare, Medicaid and others have become the major sources of funding to the system while direct payments by consumers and employers, vis-à-vis premium out-of-pocket costs, increased nominally but not at the same rate as government programs. And total spending has increased more than the overall economy (GDP), household wages and costs of living almost every year.
Thus, given the trends, five questions must be addressed in the context of the system’s long-term solvency and effectiveness looking to 2031 and beyond:
Should its total spending and public funding be capped?
Should the allocation of funds be better adapted to innovations in technology and clinical evidence?
Should the financing and delivery of health services be integrated to enhance the effectiveness and efficiency of the system?
Should its structure be a dual public-private system akin to public-private designations in education?
Should consumers play a more direct role in its oversight and funding?
Answers will not be forthcoming in Campaign 2024 despite the growing significance of healthcare in the minds of voters. But they require attention now despite political neglect.
PS: The month of February might be remembered as the month two stalwarts in the industry faced troubles:
United HealthGroup, the biggest health insurer, saw fallout from a cyberattack against its recently acquired (2/22) insurance transaction processor by ALPHV/Blackcat, creating havoc for the 6000 hospitals, 1 million physicians, and 39,000 pharmacies seeking payments and/or authorizations. Then, news circulated about the DOJ’s investigation about its anti-competitive behavior with respect to the 90,000 physicians it employs. Its stock price ended the week at 489.53, down from 507.14 February 1.
And HCA, the biggest hospital operator, faced continued fallout from lawsuits for its handling of Mission Health (Asheville) where last Tuesday, a North Carolina federal court refused to dismiss a lawsuit accusing it of scheming to restrict competition and artificially drive-up costs for health plans. closed at 311.59 last week, down from 314.66 February 1.
Layoffs are slowing at hospitals and health systems as margins gradually improve, but CFOs continue to focus on controlling costs — particularly on the labor and supply fronts — to secure the long-term sustainability of their organizations.
Last year was characterized by hospital and health systems big and small trimming their workforces due to financial and operational challenges.
From October 2022 through December 2023, Becker’sreported on more than 100 hospitals and health systems across the country that laid off workers, eliminated positions or reduced or closed certain facilities and services to help shore up finances.
While layoffs have been reported at some hospitals this year, workforce cuts have been occuring at a slower rate compared to last year.
Hospital revenues are up year over year as patient volumes continue to rebound. Operating margins have fluctuated in the last 12 months, from a -1.2% low in February 2023 to 5.5% highs in June and December, according to Kaufman Hall. In January, average operating and operating EBITDA margins dropped to 5.1%.
Kaufman analysts noted that too many hospitals are losing money and high-performing hospitals doing better and better, “effectively pulling away from the pack.”
Fitch Ratings has described 2024 as another “make or break” year for a significant portion of the nonprofit hospital sector, which continues to battle an ongoing “labordemic.” However, the U.S. has also avoided a recession so far, partly due to a robust healthcare job market, according to The Wall Street Journal.
Nearly a quarter of health systems are appointing new executives to lead provider compensation — a function previously headed by COOs and CFOs, according to a recent report shared with Becker’s.
That stat comes from the American Association of Provider Compensation Professionals, which recently surveyed 75 U.S. health systems and medical groups to learn more about their management methods.
Health systems have been expanding their provider networks since the late 2000s and are continuing to work toward alignment, according to the report. Previously, COOs and CFOs might have led provider compensation strategy — but the arena has grown too complex and calls for an executive presence of its own.
As such, a number of roles specific to provider compensation have emerged, from the executive director level up to the senior vice presidency. Nearly 25% of health systems surveyed have created a new executive position to develop and lead a provider compensation department; 93% of these departments have sole responsibility for their organization’s compensation design and 84% have full control of compensation strategy, from management of fair market value to contract management.
“The core function of this new resource, department, and team was to build and manage compensation models developed for physicians. For many organizations, this expanded to include advanced practice providers,” the report says. “Over the years, organizations have understood the role to be much more strategic than initially proposed, which is why organizations across the country have developed roles [specific to provider compensation].”
Pittsburgh-based UPMC reported a $198 million operating loss (-0.7% margin) in 2023, down from a $162 million gain (0.6% margin) in 2022, according to financial documents published Feb. 28.
UPMC attributed the swing from operating income to loss to various factors, including increased labor and supply costs, increases in medical claims expense due to higher utilization and certain legal settlements.
Revenue for the health system increased 8.5% year over year to $27.7 billion and expenses rose 10% to $27.9 billion. Under expenses, labor costs increased 6.4% to $9.7 billion and supply costs were up 11% to $7.4 billion.
After accounting for nonoperating items, such as investment returns, UPMC ended 2023 with a $31 million net loss, compared to a $1 billion net loss the previous year.
As of Dec. 31, UPMC had more than $9.5 billion in cash and investments, $3.2 billion of which was held by its regulated health and captive insurance companies.
Below are the adjusted expenses for nonprofit, for-profit and government hospitals per inpatient day in 2022 in every U.S. state, according to the latest estimates provided by Kaiser State Health Facts.
The figures are based on information from the 2022 American Hospital Association Annual Survey. They are an estimate of the expenses incurred in a day of inpatient care and have been adjusted higher to reflect an estimate of outpatient service volumes, according to the Kaiser Family Foundation.
The foundation notes the figures are “only an estimate of expenses incurred by the hospital” for one day of inpatient care and do not substitute actual charges or reimbursement for care provided.
National average Nonprofit hospitals: $3,167 For-profit hospitals: $2,383 State/local government hospitals: $2,857
Oakland, Calif.-based Alta Bates Summit Medical Center, part of Sacramento, Calif.-based Sutter Health, could close by 2030.
“This closure would strain healthcare access in Berkely and send shockwaves across the region,” Jesse Arreguin, mayor of Berkeley, Calif., said in a Feb. 27 news release shared with Becker’s. “The impacts to EMS response times and service cuts for our most voluerable communities are simply unaccebtable.”
Amid the fear of closure, a spokesperson for Sutter Health told Becker’s in a statement that the health system is developing a comprehensive plan to meet the needs of the community.
“This includes thoroughly evaluating how our patients use our services, including outpatient clinics, specialty care, hospital care, and emergency services, with a focus on identifying and addressing unmet community needs,” the spokesperson said. “It’s a major undertaking that has taken longer than anticipated; however, it’s important to emphasize that no final decisions have been made.”
The Berkeley City Council voted on Feb. 27 to allocate $300,000 from the Berkeley General Fund to help explore current or potential opportunities to secure future healthcare and hospital access for the community.
“We cannot underestimate the repercussions of losing such a critical healthcare resource,” Sophie Hahn, a Berkeley City Council member, said in the release. “Beyond undermining our healthcare system, this closure would result in a profound loss of local jobs and impacts to our economy.”
U.S. Hospital YTD Operating Margin Index November 2021-December 2023
The observations and questions from this chart are both interesting and required reading for hospital executives:
Why were hospitals profitable at the 4% plus level through the worst of the 2021 Covid period?
What exactly happened between December of 2021 and January of 2022 that resulted in a profitability decrease from a positive 4.2% to a negative 3.4%?
Despite the best efforts of hospital executives, overall operating margins were negative throughout calendar year 2022 and did not return to positive territory until March of 2023.
Hospital margins remained positive throughout 2023 and into 2024. However, overall margins have remained below those experienced in both 2021 and in the pre-Covid year of 2019.
The above questions and observations have proven interesting, and the ongoing numbers have proven quite useful in many quarters of healthcare. But recently I was talking with Erik Swanson, who is the leader of the Kaufman Hall Flash Report and our executive behind the data, numbers, and statistics. Erik and I were speculating about all of the above observations, but our key speculation was whether the 2023 operating margin results actually reflected a hospital financial turnaround or, in fact, were there “numbers behind the numbers” that told a different and much more nuanced story. So Erik and I asked different questions and took a much deeper dive into the Flash Report numbers. The results of that dive were quite telling:
Too many hospitals are still losing money. Despite the fact that the Operating Margin Index median for 2023 and into 2024 was over 2%, when you look harder at the Flash Report data, you find that 40% of American hospitals continue to lose money from operations into 2024.
There is a group of hospitals that have substantially recovered financially. Interestingly, the data shows over time that the high-performing hospitals in the country are doing better and better. They are effectively pulling away from the pack.
This leads to the key question: Why are high-performing hospitals doing better? It turns out that several key strategic and managerial moves are responsible for high-performing hospitals’ better and growing operating profitability:
Outpatient revenue. Hospitals with higher and accelerating outpatient revenue were, in general, more profitable.
Contract labor. Hospitals that have lowered their percentage of contract labor most quickly are now showing better operating profitability.
An important managerial fact.The Flash Report found that hospitals with aggressive reductions in contract labor were also correlated to rising wage rates for full-time employees. In other words, rising wage rates have appeared to attract and retain full-time staff which, in turn, has allowed those hospitals to reduce contract labor more quickly, all of which has led to higher profitability.
Average length of stay.No surprise here. A lower average length of stay is correlated to improved profitability. Those hospitals that have hyper-focused on patient throughput, which has led to appropriate and prompt patient discharge, have also proven this to be a positive financial strategy.
Lower financial performers have financially stagnated throughout the pandemic. The data shows that throughout the pandemic, hospitals with good financial results improved those results, but of more consequence, hospitals with poor financial performance saw that performance worsen. The Flash Report documents that the poorest financially performing hospitals currently show negative operating margins ranging from negative 4% to negative 19%. Continuation of this level of financial performance is not only unstainable but also makes crucial re-investment in community healthcare impossible.
The urban hospital/rural hospital myth. A popular and often quoted hospital comparison is that there is an observable financial divide between urban and rural hospitals. Erik Swanson and I found that recent data does not support this common perception. When you compare “all rurals” to “all urbans” on the basis of average operating margin, no statistically significant difference emerges. However, what does emerge—and is a very important statistical observation—is that the lowest performing 20% of rural hospitals are, in fact, generating much lower margins then their urban counterparts this year. It is at this lowest level of rural hospital performance where the real damage is being done.
Rural hospitals and obstetrics. The data does confirm one very important American healthcare issue: Obstetrics and delivery services are one of the leading money losers of all hospital service offerings. And the data further confirms that rural hospitals are closing obstetric departments with more frequency in order to protect the financial viability of the overall rural hospital enterprise. This is a health policy issue of major and growing consequence.
The point here is that data, numbers, and statistics matter both to setting long-term social health policy agendas and to the strategic management of complex provider organizations. But the other point is that the quality and depth of the analysis is an equally important part of the process. A first glance at the numbers may suggest one set of outcomes. However, a deeper, more careful and penetrating analysis may reveal critical quantitative conclusions that are much more telling and sophisticated and can accurately guide first-class organizational decision-making. Hopefully the analytics here are a good example of this very point.
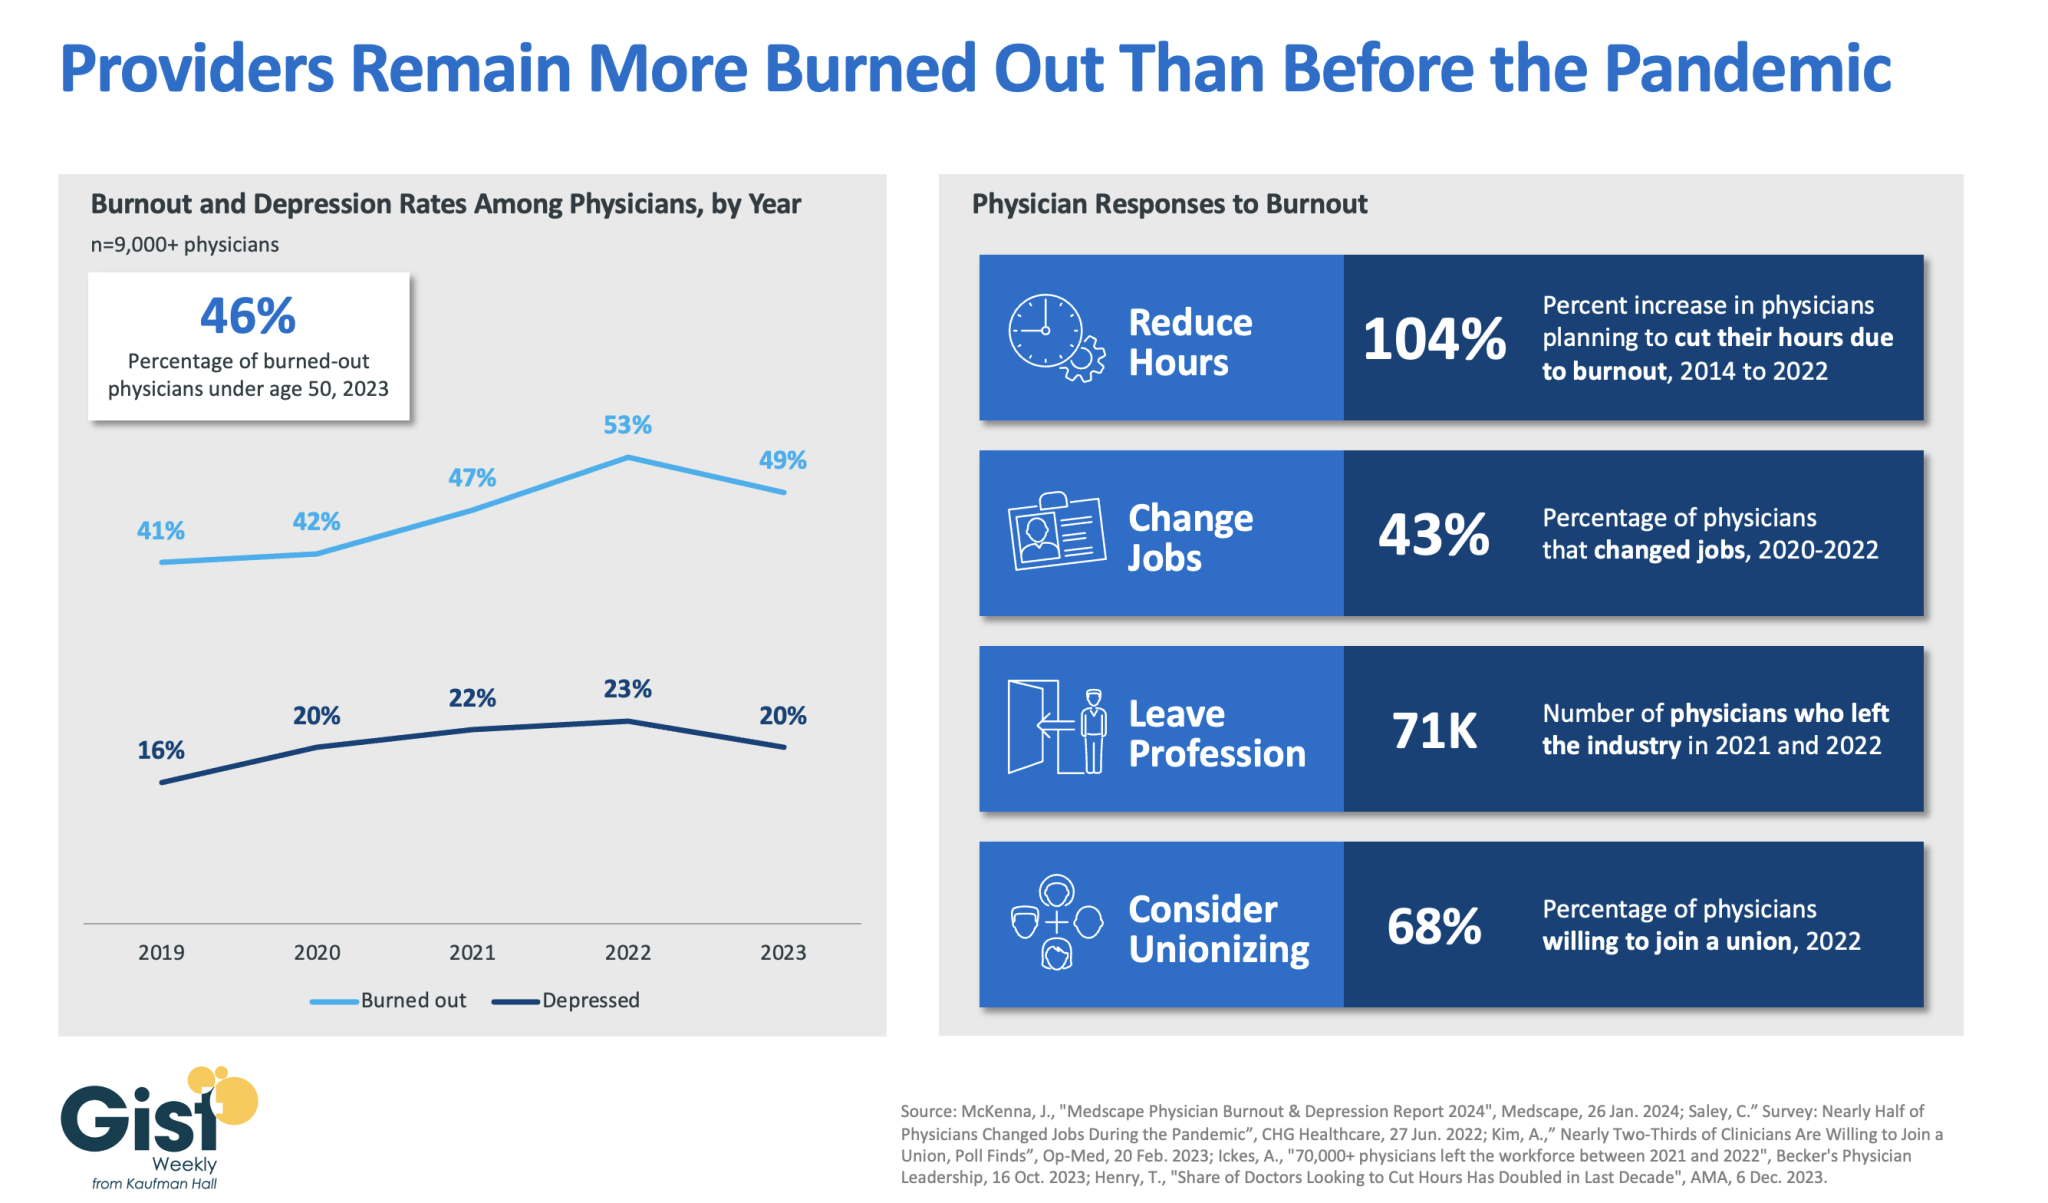
In 2023, nearly half of physicians reported feeling burned out, and a fifth reported feeling depressed. Although this does represent a drop from 2022’s peak, physicians remain more distressed than they were before the pandemic.
These numbers reveal some of the toll that the continued labor shortages, financial challenges, and payment changes of the past few years have taken on providers. In response to feeling burned out, an increased number of physicians say they are planning to cut their hours and over a third say they actually have changed jobs. Many have left the industry all together and the majority now say they are willing to join a union.
Health systems have long prioritized addressing provider burnout, but tighter operating margins have heightened both the challenge and the importance of helping to relieve it.
Continuing to find solutions to reduce administrative tasks, enhance team-based care models, and empower providers in decision-making processes are as important as ever for provider organizations today.