Providence Inches Closer to Breakeven in Q2, But Reckons With ‘Polycrisis’

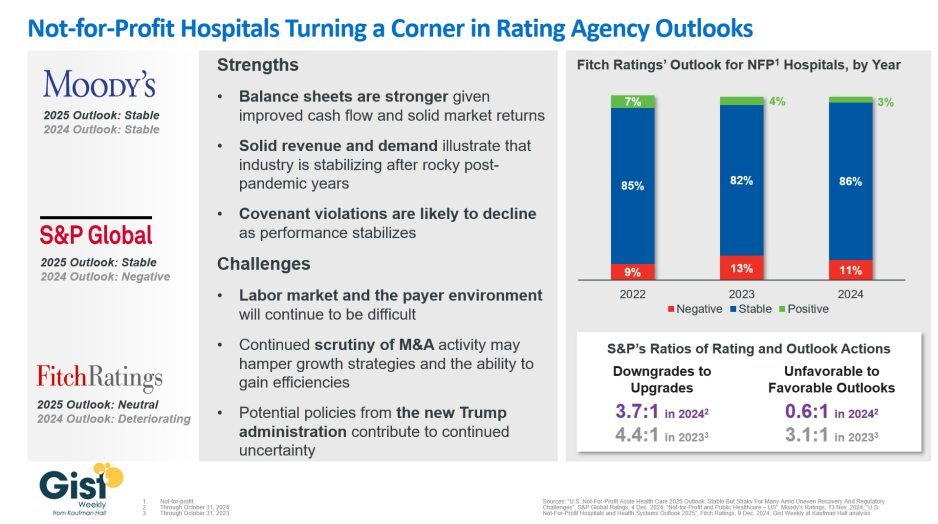
https://www.healthleadersmedia.com/ceo/providence-inches-closer-breakeven-q2-reckons-polycrisis

The nonprofit health system narrowed its operating loss while continuing to grapple with financial and policy pressures as it progresses towards profitability.


KEY TAKEAWAYS

Providence cut its operating loss in the second quarter to $21 million, improving from a $123 million loss a year ago.

Revenue rose 3% year-over-year to $7.91 billion, driven by higher patient volumes and better commercial rates.

The health system faces ongoing “polycrisis” challenges, including rising supply costs, staffing mandates, insurer denials, and looming Medicaid cuts, which have already prompted layoffs, hiring pauses, and leadership restructuring.

Providence made promising strides toward financial sustainability in the second quarter as higher patient volumes helped trim an operating loss that has weighed heavily on its balance sheet.

Yet the Renton, Washington-based health system warned that a compounding set of external pressures, which it labeled a “polycrisis,” still poses formidable challenges to its mission and future.

For the three months ended June 30, the nonprofit reported an operating loss of $21 million, equating to an operating margin of –0.3%, representing a marked improvement from the $123 million loss (–1.6%) posted over the same period in 2024. Compared with the previous quarter, the gain was even starker as Providence trimmed its deficit by $223 million. Through the first six months of the year, the health system had an operating loss of $265 million (-1.7%).

Revenue growth was fueled by higher patient volumes and improved commercial rates, Providence highlighted. Operating revenue rose 3% year-over-year to $7.91 billion as inpatient admissions (up 3%), outpatient visits (up 3%), case mix–adjusted admissions (up 3%), physician visits (up 8%), and outpatient surgeries (up 5%) all contributed.

On the expense side, Providence managed a 2% rise in operating costs to $7.93 billion, thanks largely to productivity gains, including a 43% reduction in agency contract labor. However, supply costs swelled by 9% and pharmacy expenses jumped by 12% year-over-year.

Providence, along with the healthcare industry at large, faces what CEO Erik Wexler called a “polycrisis” due to a mix of inflation, tariff-driven supply pressures, new state laws on staffing and charity care, insurer reimbursement delays and denials, and looming federal Medicaid cuts, especially from the One Big Beautiful Bill Act, which the health system said “threatens to intensify health care pressures.”

Those factors are significantly influencing hospitals’ and health systems’ decision-making. Providence has made staffing adjustments that include cutting 128 jobs in Oregon earlier this month, a restructuring in June that eliminated 600 full-time equivalent positions, a pause on nonclinical hiring in April, and leadership reorganization since Wexler took over as CEO in January.

Accounts receivable is another area that has been indicative of headwinds, with Providence noting that while it improved in the second quarter, it “remains elevated compared to historical trends.”

Even with the roadblocks in its path, Providence is working towards profitability after being in the red for several years running.

“I’m incredibly proud of the progress we’ve made and grateful to our caregivers and teams across Providence St. Joseph Health for their continued dedication,” Wexler said in the news release. “The strain remains, especially with emerging challenges like H.R.1, but we will continue to respond to the times and answer the call while transforming for the future.”

Hospitals begin to grapple with tariff fallout

Hospitals across the country are starting to reckon with the effects President Trump’s tariffs are having on medical supplies like syringes and PPE, and in some cases freezing spending and making other contingencies.

Why it matters: 

A global trade war could bring a return to pandemic disruptions if imported goods that health systems purchase in high volumes from China can’t be replenished. And there’s still the prospect of Trump’s tariffs on pharmaceuticals.

  • Ultimately, experts warn, supply disruptions and price hikes could drive up the price of patient care.

“Tariffs have the potential to add a layer of complication to [hospitals’] ability to get all of those medical goods, the drugs and the devices that they need to deliver care,” said Akin Demehin, the American Hospital Association’s vice president of quality and patient safety policy.

State of play: 

So far, there have been no widespread shortages or price spikes.

  • What most concerns the providers is a reliance on medical gear from China. Enteral syringes used to deliver drugs or nutrition through feeding tubes have no alternative sources and are subject to a 245% tariff, according to group purchasing organization Premier.
  • “With the consumables — the gowns, the gloves, masks … hospitals go through an enormous volume of those every year. Certainly there is some risk there,” said Kyle MacKinnon, senior director of operational excellence at Premier.

The pandemic spawned more domestic manufacturing of medical gear — and an anticipated reduction in dependence on overseas suppliers. But many of the startups have since disappeared, the New York Times reported, leaving the health system once again vulnerable to supply shocks amid threats like measles outbreaks and avian flu.

Between the lines: 

The situation could be further complicated by tariffs on pharmaceuticals that could weigh particularly hard on imported generics.

  • Cancer and cardiovascular medications, as well as immunosuppressives and antibiotics, are of great concern to hospitals, per a letter the American Hospital Association sent earlier this year to Trump. MD Anderson Cancer Center in Houston instituted a hiring freeze due to uncertainty, in part, from the tariffs’ impact on drug prices.
  • Medical devices are also facing a high level of exposure with roughly 70% of U.S. marketed medical devices manufactured exclusively outside the U.S., Premier wrote.
  • The American Hospital Association on Wednesday pointed to data that found 82% of health care experts expect tariff-related expenses to raise hospital costs by at least 15% over the next six months.
  • 94% of health care administrators expected to put off equipment upgrades, in response.

Reality check: 

Many hospitals may still be insulated from the worst effects because of long-term purchasing contracts.

  • Universal Health Services CFO Steve Filton said during an earnings call that three-quarters of the company’s supply chain had fixed contracted prices, Fierce Healthcare reported.
  • The company had begun to see “fees or stipends” on invoices with vendors with fixed contracted prices but had been ignoring them. “At the moment, it feels like there’s not a great deal of pressure,” he said.
  • But a dramatic reduction in goods from a major trading partner will eventually hit multiple players needing to replenish inventories, experts predict.

What to watch: 

Hospitals are among trade groups lobbying for tariff exemptions for critical medical supplies, including drugs. One question is whether pharmaceutical manufacturers can limit their exposure by “reshoring” more intellectual property in order to pay more U.S. taxes, Leerink Partners wrote in an investor note on Wednesday.

  • As supplies that have been stockpiled by hospitals begin to run low or as contracted prices expire, the true costs will begin to be felt.
  • “We especially worry about the potential impacts to vulnerable and to rural health care providers who already are operating on thin margins, and for whom changes in the cost of those kinds of goods could have a disproportionate impact,” Demehin said.

Implications of the National Hospital Flash Report for Hospital Operations

https://www.kaufmanhall.com/insights/thoughts-ken-kaufman/implications-national-hospital-flash-report-hospital-operations

For the past six years, Kaufman Hall has been publishing its monthly National Hospital Flash Report, which is designed to provide a pulse on the health of the healthcare industry and to highlight meaningful and pertinent trends for hospital and health system leaders. The data that powers the report is taken from over 1,300 hospitals, which are reflective of all geographic locations, hospital sizes and types. To ensure the content is digestible and understandable, Kaufman Hall aggregates the data into larger cohorts and measures a select set of key metrics that are most important for understanding the health of the industry. Industry groups and system leaders use these reports both for peer review purposes but also to paint an overall story for their boards and communities.

Through a detailed review of the Flash Report data, each month Kaufman Hall develops findings that healthcare leaders may find instructive as they determine how to adjust to changing market conditions. In 2024 it was reasonably obvious that there was a widening divide between the highest performing hospitals and the lowest performers. While a significant cadre of hospitals and health systems have recovered to pre-Covid financial success, 37% of American hospitals continue to lose money.

We are often asked what the successful hospitals are doing—and importantly—what the data tell us about those that are less successful. Using 2024 data, we have drawn two important conclusions around the role of leading management teams and what separates their organizations from others. 

These teams have:

  1. A sophisticated and balanced approach to the management of departmental performance: and
  2. An understanding of the management of shared service costs.

A sophisticated and balanced approach to the management of departmental performance

It turns out that current data demonstrate that the management of departmental performance is critical to overall hospital financial performance but in a more nuanced manner than expected.

Our analysis was conducted as follows:

  • First, we looked at data across hospitals nationwide to understand the difference in departmental performance between top and bottom performing hospitals.
  • Second, we ranked each department in a hospital from 0 to 100, with 100 representing the best performance based on expense per unit of service.
  • Third, we then grouped all hospitals based on their bottom-line operating margin into three cohorts: those hospitals that fell into the bottom quartile of financial performance, those between the bottom and top quartile, and those in the top quartile.
  • Finally, we created a histogram of the average composition of departmental performance across each of the three margin cohorts.

The findings demonstrate that organizations with top financial performance have departmental results that look like a normal curve around the median. Said more simply, in top-performing hospitals the number of lower-performing departments is roughly equal to the number of higher-performing departments, with most departments operating near the national departmental medians. In contrast, hospitals with the lowest financial performance show a much greater number of departments operating with high cost per units of service and a few departments that operate extremely efficiently.

It appears that poorer performing hospitals focus on the management of the largest clinical and nursing areas. These are the departments that tend to be the “easiest” to manage because they are the “easiest” to benchmark. But the data show that these same hospitals tend to have poor performance over the remainder of the departments, which leads to poor financial results for the total hospital.

Hospitals with top quartile financial performance tend to manage all departments as close to the benchmark median as possible. Such a result means spending more managerial time on the harder to manage departments, especially those departments that are more “unique” and where overall performance is harder to characterize and benchmark.

The observations that can be drawn here are important and as follows:

  • First, oversight and management of individual departments is critical to the financial success of the entire hospital or system.
  • Second, the overall organizational structure of departmental administration is critical as well. The more complicated your departmental structure and the more individual departments you maintain and administer, the more difficult it will be to manage a majority of departments to “median” results.

The data suggest a perhaps unexpected operational conclusion. The achievement of median national departmental benchmarks is leading to overall positive hospital financial operating margins. This outcome offers significant budgeting advice and over the course of a fiscal year should prove to be a remarkably useful administrative lesson.

Understanding the management of shared service costs

Given the growing costs of shared services and related overhead, Kaufman Hall wanted a closer look at how well hospital organizations were scaling shared service costs related to the organization’s size. Unexpectedly, shared service costs were not highly correlated to the size of the hospital or hospital system. This suggests that the management of shared service costs on a per unit basis is difficult and that this aspect of expense management requires diligent focus to enact and sustain cost change. Our data often indicates a wide variation of cost performance among shared services of similar types within different large organizations. This suggests that standardization of such services is not well developed and that there may be a certain level of wishful thinking that increases in organizational size will automatically correlate to lower per unit costs.

The data did indicate, however, that larger organizations can achieve higher performance over smaller organizations relative to shared service expenses. This is an indication that size can be leveraged for superior performance but that such results are not automatic. The takeaway here is that the total spend for shared service functions is very substantial and growing. In that regard, it is most important to proactively address expenses in these areas, build appropriate management plans, and understand how to focus on the right buttons and levers. To the extent that organizations are assuming that growth (both organic and inorganic) will create economies of scale with the overall shared service apparatus, the data demonstrate that such an outcome is possible but only with strong planning and execution.

Operating hospitals in 2025 is flat-out hard and likely to get harder over the year. Hospital executives right now should use every managerial advantage available. A close look at the National Hospital Flash Report data identifies important relationships that provide for a more nuanced and sophisticated operation of both individual departments and the bundle of shared services. The data clearly demonstrate that better results in both these areas will lead to improved financial performance within the hospital overall. The data also indicate key managerial strategies that will lead to such improvement.

Rating Agencies Upgrade Not-for-Profit Hospital Outlook

https://www.kaufmanhall.com/insights/infographic/rating-agencies-upgrade-not-profit-hospital-outlook

In late 2023, S&P Global and Fitch Ratings viewed the not-for-profit (NFP) hospital sector as negative or deteriorating, reflecting the difficult financial position many were in following the pandemic.

In recent weeks, S&P and Fitch upgraded their 2025 sector outlook for NFP hospitals to stable and neutral respectively, joining Moody’s Ratings, which held stable from last year.

This week’s graphic illustrates the rating agencies’ latest views on NFP hospitals, which point to a promising but uneven recovery for the industry.

Overall, the reports detail that stronger balance sheets, solid revenues, and improved demand have reduced the likelihood of covenant violations and strengthened NFP hospitals’ positions. 

However, challenges persist that could impede further progress. The labor market, payer environment, antitrust enforcement, and a new administration all present complications for the continued recovery of NFP hospitals. Nonetheless, the reports indicate significant improvement for the industry since the post-pandemic ratings downturn.

Fitch’s report noted that the share of NFP hospitals with a stable outlook has reached a three-year high. Meanwhile, S&P reported that there are now almost twice as many NFP hospitals with favorable outlooks compared to unfavorable ones, a dramatic flip from 2023, which had a 3.1:1 ratio of unfavorable to favorable outlooks. 

These ratings changes reflect the hard work put in by NFP hospitals across the country to improve their financial performance and find new ways to serve their communities sustainably. 

However, the recovery remains “shaky” and incomplete, and hospitals still face a long road ahead as they reconfigure to a new normal.

Kaiser Permanente reports $908M in Q2 operating income

Kaiser Permanente showed year-to-year financial improvement in Q2, reporting an operating income of $908 million (up from $741 million in Q2 2023), and an operating margin of 3.1% (up from 2.9% a year ago).

The news comes months after Kaiser Foundation Health plan reported a data breach affecting over 13 million people. Certain online technologies, previously installed on its websites and mobile applications, may have transmitted personal information to third-party vendors Google, Microsoft Bing and X (Twitter) when members and patients accessed its websites or mobile applications, the health system said in April.

Despite that hardship, Kaiser Foundation Health Plan, Kaiser Foundation Hospitals and assorted subsidiaries and affiliates reported operating revenues of $29.1 billion and operating expenses of $28.2 billion, compared to operating revenues of $25.2 billion and operating expenses of $24.4 billion in the same period last year.

According to Kaiser, favorable financial market conditions drove other income (net of other expense) of $1.2 billion in the second quarter of 2024. Other income Q2 2023 was $1.3 billion. For the second quarter of 2024, net income was $2.1 billion, identical to last year. 

Kaiser’s financial results in the second quarter include Geisinger, which joined subsidiary Risant Health on March 31.

WHAT’S THE IMPACT?

Kaiser said that it typically experiences higher operating margins in the first half of the year due to the annual enrollment cycle. Lower operating margins in the second half of the year are not uncommon, because expenses usually increase, in part due to the impact of seasonal care, while revenues stay relatively flat.

Kaiser Permanente membership was more than 12.5 million as of June 30, while membership for Risant Health affiliates was nearly 552,000.

Capital spending in the second quarter was $889 million, compared to $824 million in the same period of the prior year, as the organization continued to invest strategically in facilities and technology.

Though Kaiser logged a strong Q2, in May it announced plans to sell up to $3.5 billion of holdings in private-equity funds due to cash constraints, according to unnamed sources in The Wall Street Journal. Kaiser is reportedly working with investment bank Jefferies Financial Group to offload up to $3.5 billion of stakes to secondary buyers.

However, a Kaiser spokesman said at the time, “None of our decisions have been driven by liquidity needs; we maintain liquidity that is appropriate for a AA- rated organization. We will continue to make prudent, thoughtful investment decisions.”

THE LARGER TREND

Kaiser’s Q1 financial results showed operating income of $935 million, compared to $233 million for Q1 2023.

In March, Kaiser Permanente and Town Hall Ventures said they would be launching an organization called Habitat Health, which is designed to help older adults overcome the challenges of aging at home. Operating as a Program of All-Inclusive Care for the Elderly, Habitat Health is designed to help participants live independently in their homes, with comprehensive care the companies say will lead to better health outcomes.

Habitat Health plans to begin serving older adults in Sacramento and Los Angeles in 2025, and will aim to keep low-income participants in their homes to receive personalized support.

Gulf widens between rich and poor hospitals

Some of America’s largest hospital systems saw their financials soar in the first half of 2024. And yet, more than 700 facilities across the country still are at risk of closing.

Why it matters: 

It’s a familiar tale of the rich getting richer, as big, mostly for-profit health systems see improved margins while smaller facilities in outlying areas are barely hanging on.

  • That could worsen access for some of the most vulnerable Americans — and hasten consolidation in an industry that’s been a magnet for M&A.

The big picture: 

Health systems with big footprints, including large academic medical centers, have weathered the pandemic and economic headwinds and are seeing margins as good or better than before COVID-19.

  • Nashville-based industry behemoth HCA Healthcare posted 23% year-over-year profit growth for the quarter, revising its forecast for the rest of the year, projecting it’ll reach as much as $6 billion. It posted a 10% year-over-year increase in revenue.
  • King of Prussia, Pennsylvania-based Universal Health Services similarly reported a strong quarter, posting nearly 69% growth on its bottom line over the same period last year while Dallas-based Tenet Healthcare reported a 111% jump in its net income over the same quarter last year.

Yes, but: 

Smaller nonprofit hospitals, especially in rural areas, that made it through the crisis with the help of government aid are paring services like maternity wards and struggling to stay open.

  • “There are a lot of hospitals that survived, but their balance sheets are so weakened, their margin for error is basically zero at this point,” said Mike Eaton, senior vice president of strategy at population health company Navvis.
  • Hospitals that once could manage their expenses and the needs of communities are “going to really struggle to invest in what comes next,” he said.

Between the lines: 

The biggest health systems have benefited from less volatility, seeing stabilizing drug prices and more predictable supply chains and labor costs, per a new report from Strata Decision Technology.

  • “It’s at least something you can manage to,” Steve Wasson, Strata’s chief data and intelligence officer, told Axios.
  • Revenues already were up thanks to renegotiated contracts health systems struck with payers last year, Wasson said.
  • There also have been changes on the federal side that boosted Medicare admissions and put some hospitals in line to be reimbursed for billions in underpayments from the 340B drug discount program.

Zoom in: 

It’s all translated to operating margins that are up 17% year-to-date compared with the same time period in 2023, according to the latest Kaufman Hall National Hospital Flash Report.

  • Volumes as measured by hospital discharges per day are up 4% year-to-date.
  • Expenses per day are also up 6% year to date, including labor (4%), supplies (8%) and drugs (8%), but are far less volatile and thus easier to plan for, said Erik Swanson, senior vice president at Kaufman Hall.

But there’s a growing gulf between the top third of U.S. hospitals, which are seeing outsize growth, and the rest, Swanson said.

Threat level: A new report from the Center for Healthcare Quality and Payment Reform estimated 703 hospitals — or more than one-third of rural hospitals — are at risk of closure, based on Centers for Medicare and Medicaid Services financial information from July. Losses on privately insured patients are the biggest culprit.

  • “We’re looking at 50% of rural operating in the red. The situation is very challenging,” Michael Topchik, partner at Chartis Center for Rural Health, told Axios.
  • These smaller hospitals may still be there, but there will continue to be a steady erosion of the kinds of services they offer, such as obstetrics, cancer care and general surgery, he said.

What’s next: 

Private equity investment in rural health care is already booming and with it, prospects for service and staffing cuts.

  • The South generally has the highest concentration of private equity-owned rural hospitals, often with lower patient satisfaction and fewer full-time staff compared with non-acquired hospitals, according to the Private Equity Stakeholder Project.
  • Congress is ramping up oversight of private equity investments in the sector, though most lawmakers are loath to take steps to actually halt deals.

How supply costs have grown at 20 health systems

On average, supply costs comprise about 10.5% of a hospital’s budget, the American Hospital Association said its May 2 “Cost of Caring” report, citing data from Strata Decision Technology. 

Having adequate and up-to-date medical supplies, devices and equipment are necessary for hospitals to deliver high quality care to patients, AHA said, but “most of these items are expensive to acquire and maintain and rely on increasingly volatile global supply chains.”

Here is a look at how supply costs have grown year over year at 20 hospitals for the quarter ended March 31:

Orlando (Fla.) Health

2023: $302,384,000

2024: $366,542,000 

Increase: 21.2%

ProMedica (Toledo, Ohio)

2023: $60,652,000

2024: $70,739,000

Increase: 16.6%

Norton Healthcare (Louisville, Ky.)

2023: $108,786,000

2024: $126,019,000

Increase: 15.8%

Renown Health (Reno, Nev.)

2023: $70,224,000

2024: $80,459,000

Increase: 14.6%

Banner Health (Phoenix)

2023: $547,407,000

2024: $610,207,000 

Increase: 11.5%

Sanford Health (Sioux Falls, S.D.)

2023: $320,412,000

2024: $357,347,000

Increase: 11.5%

Allegheny Health Network (Pittsburgh) 

2023: $265,424,000

2024: $295,289,000 

Increase: 11.3%

Bon Secours Mercy Health (Cincinnati) 

2023: $608,040,000

2024: $671,213,000

Increase: 10.4%

Henry Ford Health (Detroit)

2023: $387,681,000

2024: $426,960,000

Increase: 10.1%

Premier Health (Dayton, Ohio) 

2023: $111,150,000

2024: $121,494,000

Increase: 9.3%

CommonSpirit (Chicago) 

2023: $1,380,000,000

2024: $1,506,000,000

Increase: 9.1%

Cleveland Clinic

2023: $356,084,000

2024: $384,359,000

Increase: 7.9%

Texas Health Resources (Arlington)

2023: $229,059,000

2024: $247,157,000

Increase: 7.9% 

HonorHealth (Scottsdale, Ariz.)

2023: $112,685,000

2024: $121,326,000

Increase: 7.7%

SSM Health (St. Louis)

2023: $399,185,000

2024: $421,995,000 

Increase: 5.7%

Providence (Renton, Wash.)

2023: $1,103,000,000

2024: $1,161,000,000

Increase: 5.3%

Prime Healthcare (Ontario, Calif.) 

2023: $29,381,000

2024: $30,584,000 

Increase: 4.1%

Intermountain Health (Salt Lake City)

2023: $703,000,000

2024: $731,000,000

Increase: 4%

Ascension (St. Louis) 

2023: $1,011,232,000

2024: $1,043,882,000

Increase: 3.2%

Sharp HealthCare (San Diego) 

2023: $147,430,000

2024: $152,206,000

Increase: 3.2%

OHSU to lay off at least 500 employees

Portland-based Oregon Health & Science University told staff June 6 that it plans to lay off at least 500 employees, citing financial issues. 

“Our expenses, including supplies and labor costs, continue to outpace increases in revenue,” top leaders told staff in a message shared with Becker’s. “Despite our efforts to increase our revenue, our financial position requires difficult choices about internal structures, workforce and programs to ensure that we achieve our state-mandated missions and thrive over the long term.”

Willamette Week was first to report the news, which follows Oregon Health & Science University and Portland-based Legacy Health signing a binding, definitive agreement to come together as one health system under OHSU Health. OHSU Health would comprise 12 hospitals and, more than 32,000 employees and will be one of the largest providers of services to Medicaid members in Oregon. 

An Oregon Health & Science University spokesperson told Becker’s more information about the layoffs will be provided in the coming weeks.

In the June 6 message, leaders told staff that “while we work to address short-term financial challenges, we must also plan for an impactful and successful future. We understand that last week’s announcement regarding the Legacy Health definitive agreement, while exciting and potentially transformational, raises questions about how we can afford the required investment in light of our financial situation.”

They added that a capital investment in Legacy “represents a strategic expansion designed to enhance our capacity,” and will be funded by borrowing with 30-year bonds.  

“These capital dollars cannot be used to close gaps in our fiscal year 2025 OHSU budget or to pay our members. The OHSU Strategic Alignment and budgetary work would be necessary with or without the Legacy Health integration,” leaders said.

OHSU has planned a town hall next week to further discuss the combination with Legacy. 

Leaders said discussions between managers and members about workforce reductions will begin after the annual review and contract renewal process, with additional reductions occurring over the next few months.

‘No silver bullets’ to improve margins, OSF CFO says

Peoria, Ill.-based OSF HealthCare has seen drastic improvements to its financial performance over the last two years, a performance that has allowed the health system to see revenue growth and expand its M&A footprint.

OSF was able to turn around a $43.2 million operating loss (-4.5% margin) in the first quarter ended Dec. 31, 2022, to a $0.9 million gain over the same period in 2023.

But the health system didn’t stop there and, in the first six months ended March 31, 2023, transformed a $60.9 million operating loss to an $8.9 million gain for the same period in 2024.

OSF HealthCare CFO Michael Allen connected with Becker’s to discuss the strategies that helped OSF get to a more steady financial place and some of their plans for the future. 

Question: What strategies has OSF HealthCare implemented to help it turn the corner financially? 

Michael Allen: OSF Healthcare has improved operating results by more than $70 million compared to FY2023, after seeing an even larger improvement from FY2022 to FY2023. After a very difficult FY2022, from a financial perspective, the organization launched a series of initiatives to return to positive margins. 

There has been a focus on reducing the reliance on contract labor, nursing and other key clinical positions, with better recruiting and retaining initiatives. The organization is actively implementing automation for repeatable tasks in hard-to-recruit administrative functions and is actively managing supply and pharmaceutical costs against inflationary pressures.

OSF has also seen revenue growth from patient demand, expanding markets, capacity management and improved payment levels from government and commercial payers.

Q: KSB Hospital and OSF HealthCare recently entered into merger negotiations. How do you expect hospital consolidation to evolve in your market as many small, independent providers continue to face financial challenges and struggle to improve their bottom lines?

MA: The economics of the healthcare delivery system model is challenging in most markets, but particularly difficult for small and independent hospitals and clinics. Given the structure of the payment system and the rising operating costs, I don’t see this pressure easing any time soon.  

OSF is looking forward to our opportunity to extend our healthcare ministry to KSB and the greater Dixon area and continue their great legacy of patient care.

Q: What advice would you have for other health system financial leaders looking to get their margins up this year?

MA: There are no silver bullets to improving margins. It’s the daily work of using our costs wisely and executing on important strategies that will win the day. Automation, elimination of non-value-added costs and continuously looking for opportunities to get the best care, patient engagement and workforce engagement is where OSF and other health systems will continue to focus.

Q: An increasing number of hospitals and health systems across the U.S. are dropping some or all of their commercial Medicare Advantage contracts. Where do you see the biggest challenges and opportunities for health systems navigating MA?

MA: As more and more patients and payers are entering Medicare Advantage, we continue to watch our metrics on payment levels to ensure we are being paid fairly and within contract terms for our payer partners. 

There does appear to be a trend of increasing denials that often aren’t justified or are not within our contract terms, and we will continuously work to rectify those issues with our payers to ensure our patients receive the appropriate care and OSF is paid fairly for services provided. 

Financial Literacy: A Leadership Prerequisite

https://www.kaufmanhall.com/insights/blog/financial-literacy-leadership-prerequisite

In last month’s blog, we discussed the importance of financial planning, both for internal audiences—including the leadership team and the board of trustees—and for external audiences—including prospective students and their families, rating agencies, alumni and other stakeholders. This month, in the first of a series of blogs focused on key finance-related issues, we’re turning our attention to a broader and deeper internal audience, asking the question, “What is your institution’s financial literacy?”

The terms described in this blog will be very familiar to members of college and university finance teams and to many institutional leaders as well.

The point is that these terms should be familiar to as many individuals as possible throughout the institution: they form the foundation of a basic financial literacy that every college and university should foster across its faculty and staff.

What is financial literacy?

Financial literacy is the ability to understand where an institution stands at any given time with respect to key elements of its balance sheet and income statement. To state it simply, financial literacy means an understanding of the vital signs that describe the financial health of the institution. In medicine, the basic vital signs are body temperature, pulse rate, respiration rate, and blood pressure. In finance, the vital signs include measures of unrestricted cash, revenue, expenses, debt, and risk.

In medicine, there are professionals whose job is to dig deeper if any of the body’s vital signs are deteriorating. Similarly in finance, it is the job of the CFO and finance team to monitor the vital signs of the institution’s financial health and to seek causes and solutions of current troubles or to use changes in the vital signs to address potential future issues. For most of us—in medicine or finance—the goal should be a basic understanding of what the vital signs measure and whether they point to good health.

There are some key considerations for each financial vital sign:

  • Unrestricted Cash. The critical question related to unrestricted cash (also termed liquidity) is whether the institution has enough accessible liquidity to meet its daily expenses if its cash flow was unexpectedly interrupted. Days cash on hand is a balance sheet metric that is typically used to assess this issue: days cash on hand literally measures how long unrestricted cash reserves could cover the institution’s operating costs if its cash flow suddenly stopped. 

    The emphasis on “accessible liquidity” is an important element of this financial vital sign: it speaks to the ability to distinguish between institutional wealth versus liquidity. In higher education, an endowment can be an important source of the institution’s wealth, but many of the funds within an endowment cannot be easily accessed—they are, by and large, not liquid funds or are highly restricted as to their use. Readily available, unrestricted cash reserves are what an institution must rely on to meet its day-to-day expenses should cash flow be interrupted or reduced.
     
  • Revenue. Because an institution needs to maintain or grow its cash reserves and allocate them sparingly, the amount of revenue coming in—from tuition and fees and from other sources of additional income (see below)—is also an important vital sign. An institution should obviously be taking in enough revenue to cover its expenses without drawing on its cash reserves. 

    Additionally, however, given continued growth in expenses, revenue growth (through enrollment growth, student mix, and/or program mix) is a significant measure of ongoing vitality.

    Financial health is also enhanced if an institution does not rely too heavily on a single revenue source. For schools with an endowment, for example, the amount of income the endowment can generate to support operations is an important source of additional income. More generally, additional income can come from such auxiliary revenue sources as residential fees, fundraising, special events, concessions, and a host of other sources. These additional revenue sources, while potentially small on an individual basis, can be material on a cumulative basis.
     
  • Expenses. How much does it cost to produce the education that a college or university provides to its students? If that cost is approaching—or worse, surpassing—the net tuition revenue and additional income that the institution brings in, what is being done—or could be done—to reduce those costs? Expenses are perhaps most similar to body temperature in medical vital signs; if they get too high, they must be brought down before the health of the institution begins to decline. And the measure of expenses should be viewed overall for the institution as well as on a per student basis to communicate the “value” of different student types to the organization.
     
  • Debt. Debt is an essential component of the funding of significant capital projects that colleges and universities must undertake to maintain updated and competitive facilities. Just as most people need to take out a mortgage to afford a home purchase—spreading the cost of the home over a multiyear payment period—so too do institutions often need debt to finance large capital expenditures. But the amount of debt (also termed “leverage”) can also be an indicator of the institution’s financial health. That health begins to decline if the amount of debt relative to an institution’s assets or annual income grows too large, or if the amount required to pay for the debt (i.e., to meet the scheduled principal and interest payments—the debt service) puts too much of a burden on the cash flow generated from the institution’s day-to-day operations. If the debt service becomes too high relative to cash flow, the institution may face onerous legal requirements, or even default, which may severely constrain its ability to provide the range of programs desired and expected by its student population.
     
  • Risk. Risk is an indicator that identifies potential weaknesses in any of the preceding indicators that could jeopardize the institution’s financial health. For basic financial literacy, only the most significant risks need to be identified: over-reliance on tuition revenue in a market with declining enrollments, for example, or over-reliance on endowment income in the event of market instability. Once an institution consistently measures its risks, it can begin to determine what level of risk is appropriate and address strategies to manage that risk.

Why does financial literacy matter?

Promoting financial literacy throughout an institution cultivates a common understanding of financial health that provides context for leadership’s decisions and a common language to address issues. If tuition revenue is declining, for example, financially literate faculty members should better understand the need to prioritize academic programs that not only meet the academic needs of their students, but also can draw more students or produce healthier margins. If cost-cutting measures are required to reduce expenses, financially literate staff should understand the genesis of the need for reductions and why the institution cannot simply draw on its endowment to close the gap. Furthermore, acknowledging and describing the most significant risks an institution faces using a common language makes clear the need for action if one or more of those risks begins to materialize.

Financial literacy is also an important tool for cultivating the next generation of faculty leaders. When faculty members rise to leadership positions, it is essential that they understand that academic growth and strategic initiatives cannot succeed without sufficient resources to support them, or if they cannot generate the revenue needed to cover—or exceed—their costs.

By promoting financial literacy across the institution, the institution can help ensure that future leaders are acquiring the foundation needed for them to grow into informed decision-makers who understand the need to maintain the institution’s financial health.