New unemployment insurance claims rise for the first time since March

https://www.washingtonpost.com/business/2020/07/23/another-14-million-workers-filed-unemployment-benefits-last-week-pandemic-continues-weigh-labor-market/


Some 1.4 million workers filed for unemployment last week, the first increase in months, as the pandemic continues to weigh on the labor market

The number of new unemployment claims rose for the first time in months last week, to 1.4 million — a troubling sign for the labor market that’s weathering a new round of closures as the pandemic spreads.

For the week ending July 18, about 109,000 more jobless claims were filed compared to the week prior, according to the Department of Labor.

“What you’re seeing is that, as the economy slows, the pace of claims picks back up — which really puts at risk the monthly jobs report over the next few months,” said Joseph Brusuelas, the chief economist at RSM. “The July numbers are going to be tenuous, but it’s August that I’m worried about.”

The number of workers continually claiming unemployment insurance went down, however, a statistic that lags by a week, to 16.1 million workers for the week ending July 11, from 17.4 million for the week ending July 4.

In addition to the 1.4 million seeking unemployment nationwide last week, another 980,000 new Pandemic Unemployment Assistance claims were filed, the benefits offered to self-employed and gig workers.

The numbers come as millions of unemployed workers are about to exhaust stimulus payments from two federal benefits programs whose expiration economists have warned could have dire effects on the economy.

Brusuelas said the numbers are a sign that the burst of economic activity that marked the country’s reopening has waned, and that shrinking consumer demand remained a significant risk for businesses and the workers they employ across the country.

“We are going to see a much slower pace of growth the reset of the year,” he said. “While we still are retaining our call for a swoosh-shaped recovery, one has to acknowledge a w-shaped recovery is possible.”

The extra $600 a week in unemployment benefits that the federal government has offered to supplement more modest state unemployment benefits will end this week, as lawmakers wrangle over legislation that could extend it.

Including the new benefits available to gig workers and the self-employed, more than 53 million applications have been filed for some form of unemployment insurance during the pandemic.


Cartoon – Pandemic Management

Reflections on an Ad Industry at War With Itself | MediaVillage

5 COVID-19 myths politicians have repeated that just aren’t true

https://theconversation.com/5-covid-19-myths-politicians-have-repeated-that-just-arent-true-141972

5 COVID-19 myths politicians have repeated that just aren't true ...

The number of new COVID-19 cases in the U.S. has jumped to around 50,000 a day, and the virus has killed more than 130,000 Americans. Yet, I still hear myths about the infection that has created the worst public health crisis in America in a century.

The purveyors of these myths, including politicians who have been soft peddling the impact of the coronavirus, aren’t doing the country any favors.

Here are five myths I hear as director of health policy at the University of Southern California’s Schaeffer Center that I would like to put to rest.

Myth: COVID-19 is not much worse than the flu

President Donald Trump and plenty of pundits predicted early on that COVID-19 would prove no more lethal than a bad flu. Some used that claim to argue that stay-at-home orders and government-imposed lockdowns were un-American and a gross overreaction that would cost more lives than they saved.

By the end of June, however, the director of the Centers for Disease Control and Prevention announced that national antibody testing indicated 5% to 8% of Americans had already been infected with the virus. With over 130,000 confirmed COVID-19-related deaths – and that’s likely an undercount – the case fatality rate is around 0.49% to 0.78% or about four to eight times that of the flu.

Brazilian President Jair Bolsonaro, who also downplayed COVID-19 as the death toll grew, calling it a “little flu,” announced on July 7 that he had tested positive for the coronavirus.

5 COVID-19 myths politicians have repeated that just aren't true


Myth: Cases are increasing because testing is increasing

At one point, the idea that COVID-19 case numbers were high because of an increase in testing made intuitive sense, especially in the early stages of the pandemic when people showing up for tests were overwhelmingly showing symptoms of possible infection. More testing meant health officials were aware of more illnesses that would have otherwise gone under the radar. And testing predominately sick and symptomatic people can result in an overestimate of its virulence.

Now, with millions of tests conducted and fewer than 10% coming back positive, the U.S. knows what it is facing. Testing today is essential to finding the people who are infected and getting them isolated.

Unfortunately, Trump has been a leading purveyor of the myth that we test too much. Fortunately, his medical advisers disagree.

Myth: Lockdowns were unnecessary

Given the current spike in infections after reopening the economy, more people are arguing that the lockdowns were unsuccessful in crushing the virus and shouldn’t have been implemented at all. But what would the country look like today if state governments had tried to build herd immunity by letting the disease spread rather than promoting social distancing, prohibiting large gatherings and telling the elderly to stay home?

Most epidemiologists who study pandemics believe that reaching herd immunity could only be achieved at enormous cost in terms of illness and death. About 60% or 70% of Americans would have to become infected before the spread of the virus diminished. That would result in 1 to 2 million U.S. deaths and 5 to 10 million hospitalizations.

These are horrific, yet conservative estimates, given that mortality rates would surely rise if that many people were infected and hospitals were overrun.

5 COVID-19 myths politicians have repeated that just aren't true

Myth: The epidemiological models are always wrong

It is not surprising that many people are confused by the proliferation of predictions about the course of the virus. How many people become infected depends on how individuals, governments and institutions respond, which is hard to predict.

Faced with the warning early in the pandemic that 1 to 2 million Americans could die if the U.S. simply let the coronavirus run its course, federal and state governments imposed restrictions to constrain the spread of the virus. Then, they relaxed those restrictions as new cases ebbed and pressure mounted to reopen the economy.

Now, they must consider reimposing some of those restrictions as infection rates rise in a majority of states, including Texas, Arizona, Florida and California. The models were based on data and assumptions at that time, and likely influenced responses which in turn changed underlying conditions. For example, new cases of COVID-19 are rising in the U.S., while fatalities are falling. This reflects a shift in infection rates toward younger populations, as well as improved treatment as providers learn more about the virus.

Just like an investment disclaimer that past returns do not guarantee future performance, modeling a pandemic should be seen as suggestive of what might happen given current information and not a law of nature.

Myth: It’s a second wave

Sadly, the myth here is that we have contained the virus enough to buy time to prepare for a second wave. In fact, the first wave just keeps getting bigger.

A second wave would require a trough in the first wave, but there is little evidence of that from either an epidemiologic or economic perspective.

5 COVID-19 myths politicians have repeated that just aren't true

During the 1918-1919 flu pandemic, the weekly UK death toll from influenza and pneumonia, shown here, reflected three clear waves. Taubenberger JK, Morens DM. 1918 Influenza: the Mother of All Pandemics. Emerg Infect Dis. 2006;12(1)

The U.S. recorded a record number of new cases during the first week of July, exceeding 50,000 per day for four straight days. The rising number of cases led several states to halt or roll back their reopening plans in hopes of stemming the spread of the virus.

Meanwhile, most consumers are reticent to return to “normal” economic activity: Fewer than one-third of adults surveyed by Morning Consult in early July were comfortable going to a shopping mall. Only 35% were comfortable going out to eat, and 18% were comfortable going to the gym. For almost half of the population, an effective treatment or vaccine may be the only way they will feel comfortable returning to “normal” economic activity.

COVID-19 is an immediate threat that requires a unified, science-based response from governments and citizens to be successful. But it is also an opportunity to rethink how we prepare for future pandemics. Some misinformation is inevitable as a new virus emerges, but perpetuating myths for political or other reasons ultimately costs lives.


Trump said more Covid-19 testing ‘creates more cases.’ We did the math

Trump said more Covid-19 testing ‘creates more cases.’ We did the math

Testing silhouette

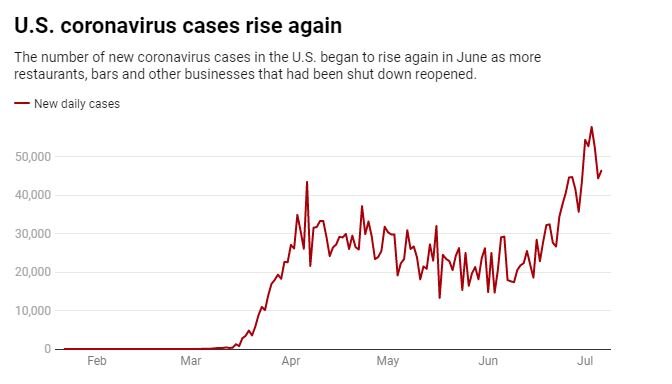
The counter-narrative began almost instantly. After the U.S. count of Covid-19 cases began an inexorable rise in June, the White House sought to assure Americans that the increase was, basically, an illusion, created by an increase in testing for the novel coronavirus.

In a June 15 tweet, President Trump said testing “makes us look bad.” At his campaign rally in Tulsa five days later, he said he had asked his “people” to “slow the testing down, please.” At a White House press conference last week, he told reporters, “When you test, you create cases.”

And in an interview with Fox News that aired Sunday, Trump could not have been clearer: “Cases are up because we have the best testing in the world and we have the most testing.” Basically, the president was arguing that the U.S. had just as many new cases in June and July as it did in May but, with fewer tests being done in May, they weren’t being detected; with more testing now, they are.

A new STAT analysis of testing data for all 50 states and the District of Columbia, however, shows with simple-to-understand numbers why Trump’s claim is wrong. In only seven states was the rise in reported cases from mid-May to mid-July driven primarily by increased testing. In the other 26 states — among the 33 that saw cases increase during that period — the case count rose because there was actually more disease.

May had brought signs of hope that the U.S. had gotten its Covid-19 outbreak under control, with about 20,000 new cases reported per day after April highs closer to 30,000. But by late June, the daily count climbed to about 40,000, and now it’s at about 70,000. The STAT analysis shows that spread of the virus, far more than testing, explains that increase.

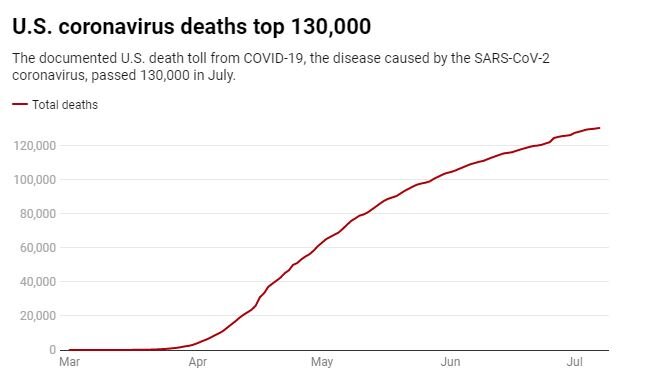
Epidemiologists and infectious disease experts have disputed the White House claims for weeks, citing rising hospitalization numbers and deaths. It’s hard to argue that extremely sick people, let alone dead people, had been obscured by low levels of testing but suddenly revealed by higher levels.

Without a doubt, many cases of Covid-19 in March, April, and May weren’t picked up. In late June, Centers for Disease Control and Prevention Director Robert Redfield told reporters that as many as 90% of cases had been missed; that is, although there were 2.3 million confirmed cases in the U.S. then, some 20 million people had probably been infected. But that reasoning applies today, too: Despite months of government claims to the contrary, not everyone who wants, or should have, a test is getting one.

Simple math belies the “it’s just because of more testing” claim — with some fascinating exceptions.

Using data from Covid Tracking, STAT looked at the number of people tested and the number who tested positive for the disease (cases) in every state and Washington, D.C. We did that for three dates: in mid-May, mid-June, and mid-July. (Due to reporting anomalies, the dates selected sometimes differed by a day or two between states.)

For each date, we calculated the number of cases found per 1,000 tests — a measure of the disease’s prevalence. For example, in Florida on May 13, that rate was 32. On June 13 it was 75. On July 13 it was 193. On May 13, Florida tested 15,159 people; on July 13, it tested 65,567. So indeed, the number of tests has increased.

But the number of cases per thousand, which is independent of the number of tests, has skyrocketed. On May 13, Florida recorded 479 cases; on July 13, it found 12,624. If the prevalence of Covid-19 were the same in July as in May, Florida would have found only 2,098 cases. In other words, 10,526 of the July 13 cases are not due to increased testing, but, instead, to the increased prevalence of disease.

Florida Gov. Ron DeSantis, however, echoes Trump’s explanation, telling a Saturday press briefing that his state’s soaring caseload is largely the result of more testing of people with no or minimal symptoms. “We’re now capturing a lot of those folks,” he said.

In fact, Florida has seen a sevenfold increase in cases in the past month, said Youyang Gu, who developed a well-respected, machine-learning-based model of Covid-19 whose projections have been quite accurate. “In the same time span, the number of tests only increased by a factor of two,” he said. “Obviously, if you double the testing but the number of cases increased sevenfold, then the virus is clearly spreading.”

Testing/cases graphic

The complete data for all 50 states can be found here.


Other states with soaring cases tell the same story as Florida.

In Arizona, the case-finding rate rose from 90 in May to 140 in June to 208 in July. Of its 2,537 cases on July 12, 1,441 were due to increased prevalence.

South Carolina has also experienced a steep rise in prevalence as its case count quintupled: Of the 2,280 cases on July 9, 1,869 were due to rising prevalence, not more testing. Texas and Georgia are similar: rising case counts well beyond increases in testing. In all, 26 states that did more testing in July than in May found more cases because Covid-19 was more prevalent. In 15 of them, the number of cases per 1,000 people tested had more than doubled.

Seven states (Colorado, Indiana, Michigan, Missouri, North Carolina, Ohio, and Wisconsin) meet the three criteria needed to support Trump’s claim that we’re seeing more cases only, or mostly, because we’re doing more testing. The criteria are doing more tests in July than in May, finding more cases on a typical day in July than May, but seeing the number of cases per 1,000 tests decline or remain unchanged from May to July.

Take Missouri. It’s reporting more cases, but not because the virus is exploding there (despite those crowded holiday scenes at Lake of the Ozarks). Its case finding rate has been pretty stable or even declining, from 48 in mid-May to 44 in mid-July. By tripling its number of daily tests, Missouri is finding roughly triple the number of cases.

California comes close to meeting the three criteria, but doesn’t quite. Its number of daily tests more than quadrupled from May to July, from roughly 32,000 to 137,000. But the rate of cases being found has risen, though only about 10%, from 55 to 61 per 1,000 tests. So a big reason — but not the main reason, as in Missouri — more cases are being found is that more testing is being done. Washington is similar: more testing, more cases, but also slightly greater prevalence of disease in mid-July compared to mid-May; its worsening situation is real.

New York tells the opposite story: more testing found fewer cases. The state nearly doubled its daily tests from May 13 (33,794) to July 12 (62,418). But its cases fell from 2,176 to 557. If the case rate had not dropped (by 86 %), New York’s expanded testing would have found 3,995 cases on July 12.

In fact, 16 states plus the District of Columbia are like New York. They tested much more, but found fewer cases in July than May — in most, not only “fewer” in the sense of fewer cases per 1,000 but fewer in absolute terms. New Jersey reported 10,246 tests and 1,144 cases on May 14, and 20,846 tests with a mere 393 new cases on July 14. Again, the virus hasn’t disappeared, but the expansion of testing, far from “creating” cases, has brought good news: In these states, it’s much less prevalent than it was two months ago.


Op-Ed: We Still Don’t Know the Risk Posed by COVID-19

https://www.medpagetoday.com/infectiousdisease/covid19/87629?xid=fb_o&trw=no&fbclid=IwAR2V6CbOCIXDf2K9sJCcRb0PhbqM4inXixe_poOFYudOcoUFZCmU2JzyrDg

Op-Ed: We Still Don't Know the Risk Posed by COVID-19 | MedPage Today

The need for a coordinated national research strategy

Confused about the risks of dying from the coronavirus or of catching it from someone who seems healthy? We all are, and the dizzying differences in scientific opinion are now linked to political perspectives. Progressives cite evidence that loosening restrictions would cost lives and offer little benefit to the economy, while conservatives embrace evidence that the risks are low. We offer a guide to help navigate the tangle of numbers and suggest a way forward.

Google and many others display the number of cases and deaths (3.6 million and 138,840, respectively, by July 17). This invites a simple calculation for understanding the risk: divide the number who have died by the number who have been diagnosed. So, the chance of dying if infected is about 3.9%. Right? Well, not so fast. Six months into the pandemic, neither the number of deaths nor the number of people infected is known.

Some argue that deaths have been overemphasized since people who die of COVID are mostly older and sicker. Others suggest deaths have been overcounted since if a patient tests positive for COVID-19, it will likely be listed as the cause of death even if the person succumbs to another illness or, in some jurisdictions, dies due to an accident or suicide. Others argue that deaths have been undercounted.

Missing from the tally on any given day are those who died before testing was available, those who died shortly before or after but whose death has not yet been reported, or who died as an indirect result of the epidemic such as failing to seek medical care for fear of going to the hospital.

One carefully designed recent analysis compared deaths this year to the number of people who die during a “normal” year. The analysis concluded that through May, almost 100,000 people died from COVID-19 in addition to 30,000 who died from other causes related to the pandemic.

In short, uncertainty remains about the number of deaths due to COVID-19, which is supposed to be the easy part.

Estimating the number of people who have been infected is harder still. Most infected people are never formally diagnosed and never become one of the “cases” in the news. The limitations of the tests and the difficulty of attracting a representative population to be tested make it hard to estimate the true number of infections. The preferred test (reverse transcription polymerase chain reaction-based tests) uses RNA technology to see if the virus is present in nasal or oral swabs. It is a good test, but still may miss infections in up to 30% of cases.

A second type of test uses blood samples to look for an antibody called immunoglobulin (Ig)G that implies the person was previously infected. Based on IgG test results, the CDC assumes that 5% to 8% of the population has been infected. That would mean 24 million Americans have already had COVID-19 or a very similar illness. That is more than 10 times the number of confirmed cases.

The number is consequential: a higher infection rate for the same number of deaths implies that the virus is less deadly.review by a prominent epidemiologist considered 23 population studies with sample sizes of at least 500 people and found the percentage who have positive antibodies ranged from 0.1% to 48% — a 480-fold difference. Although the study was robustly criticized and at odds with highly citedpeer-reviewed research, it has appeared in over 30 news outlets, and the range of estimates allows people to pick a number that justifies their political position.

Contributing to this uncertainty is the FDA decision to, in a hurry to catch up for lost time, temporarily relax its standards for approving tests. Among over 300 antibody tests currently on the market, data on only a handful are publicly available, and some are being recalled.

The other number we need to know is how many people are spreading the infection without knowing it. Estimates are all over the place. Some major employers, including Stanford Healthcare, have systematically tested all of their employees and found very few infected people who do not have symptoms. In contrast, a CDC study of young, healthy adults working on an aircraft carrier found that 20% of those infected reported no symptoms.

So here we are, months into the epidemic without consensus on the basic information about how many people are infected, the risk of death for those infected, or the risk of asymptomatic transmission. In contrast to official agencies that use transparent methods to report the weather or the unemployment rate, trust in our official health statistics agencies has broken down as reports continue to emerge form myriad sources with conflicting methodologies and motivations.

The time has come to activate impartial groups, like the National Academy of Medicine, to build consensus on how to monitor the epidemic. We know the risks are serious. As cases have started to rise, whether or not the number of U.S. deaths is higher or lower than 130,000, the risk of inaction is too high.

We are staying near home, wearing masks, and treating COVID-19 as a serious threat to public health.


How deadly is COVID-19? A biostatistician explores the question

https://theconversation.com/how-deadly-is-covid-19-a-biostatistician-explores-the-question-142253?utm_medium=email&utm_campaign=The%20Weekend%20Conversation%20-%201680716207&utm_content=The%20Weekend%20Conversation%20-%201680716207+Version+A+CID_c211e1b0b6c4b69b3a29a9d1624a2ab6&utm_source=campaign_monitor_us&utm_term=How%20deadly%20is%20COVID-19%20A%20biostatistician%20explores%20the%20question

How deadly is COVID-19? A biostatistician explores the question

The latest statistics, as of July 10, show COVID-19-related deaths in U.S. are just under 1,000 per day nationally, which is down from a peak average of about 2,000 deaths per day in April. However, cases are once again rising very substantially, which is worrisome as it may indicate that substantial increases in COVID-19 deaths could follow. How do these numbers compare to deaths of other causes? Ron Fricker, statistician and disease surveillance expert from Virginia Tech, explains how to understand the magnitude of deaths from COVID-19.

As a disease surveillance expert, what are some of the tools you have to understand the deaths caused by a disease?

Disease surveillance is the process by which we try to understand the incidence and prevalence of diseases across the country, often with the particular goal of looking for increases in disease incidence. The challenge is separating signal from noise, by which I mean trying to discern an increase in disease incidence (the signal) from the day-to-day fluctuations in that disease (the noise). The hope is to identify any increase as quickly as possible so that medical and public health professionals can intervene and try to mitigate the disease’s effects on the population.

A critical tool in this effort is data. Often disease data is collected and aggregated by local and state public health departments and the Centers for Disease Control and Prevention from data that is reported by doctors and medical facilities. Surveillance systems then use this data and a variety of algorithms to attempt to find a signal amidst the noise.

Early on, many people pointed out that the flu has tens of thousands of deaths a year, and so COVID-19 didn’t seem so bad. What’s wrong with that comparison?

The CDC estimates the average number of flu-related deaths since 2010-11 is around 36,000 per year. This varies from a low of 12,000 deaths in 2011-12 to a high of 61,000 deaths in 2017-18. Thus, the number of COVID-19 deaths to date is three to four times greater than the annual average number of flu-related deaths over the past decade; it is 10 times larger when compared to the 2010-11 flu season but only about twice as large compared to 2017-18.

To make this a fair comparison, note that seasonal influenza mostly occurs over a few months, usually in late fall or early winter. So, the time periods are roughly comparable, with most of the COVID-19-related deaths occurring since late March. However, COVID-19 does not appear to be seasonal, and fatalities are a lagging measure because the time from infection to death is weeks if not months in duration, so the multiples in the previous paragraph will be greater by the end of the year.

Furthermore, while death rates have been coming down from a peak of more than 2,700 on April 21, 2020, the United States is now averaging just under 1,000 deaths per day as of July 10, and given the dramatic increase in cases of late, we should expect the fatality rate to further rise. For example, the University of Washington’s IHME model currently predicts slightly more than 208,000 COVID-19-related deaths by November 1.

So, by any comparison, the COVID-19 death rate is significantly higher than the seasonal influenza death rate.

What are some comparisons that could provide some context in understanding the scale of deaths caused by COVID-19?

As of this writing, more than 130,000 people have died of COVID-19, and that total could grow to 200,000 or more by fall. Those numbers are so big, they’re hard to grasp.

Michigan Stadium in Ann Arbor is the largest football stadium in the United States. It holds 107,420 people, so no football stadium in the country is large enough to hold everyone who has died from COVID-19 thus far. By the time bowl season comes along, assuming we have a football season this year, the number of COVID-19 fatalities will likely exceed the capacity of the Rose and Cotton bowl stadiums combined.

The state of Wyoming has a population of slightly less than 600,000 people, so it’s the equivalent of one out of every five people in that state dying in the last four months. By this fall, the COVID-19 death total will be the equivalent of fully one-third of the people in Wyoming dying.

The populations of Grand Rapids, Michigan; Huntsville, Alabama; and Salt Lake City, Utah are each just over 200,000 people. Imagine if everyone in one of those cities died over the course of six months. That’s what COVID-19 may look like by fall.

How do COVID-19 deaths compare to chronic diseases like cancer or heart disease?

Today, COVID-19 ranks as the sixth leading cause of death in the United States, following heart disease, cancer, accidents, lower chronic respiratory diseases and stroke. Heart disease is the leading cause, with just over 647,000 Americans dying from it each year. Alzheimer’s disease, formerly the sixth largest cause of death, kills just over 121,000 people per year. If the University of Washington IHME model’s current prediction of COVID-19-related deaths comes to pass, COVID-19 will be the third leading cause of death in the United States by the end of the year.

The American Cancer Society estimates that in 2020 there will be an estimated 1.8 million new cancer cases diagnosed and 606,520 cancer deaths in the United States. Lung cancer is estimated to kill about 135,000 people in the US in 2020, so the number of COVID-19 deaths is currently equivalent and will exceed it soon. Of course, it is important to note that the COVID-19 deaths have occurred in about the past four months while the number of lung cancer deaths is for a year. So, COVID-19 deaths are occurring at roughly three times the rate of lung cancer deaths.

What are some historical comparisons that you think are useful in understanding the scale of deaths from COVID-19?

The 1918 influenza pandemic was similar in some ways to the current pandemic and different in other ways. One key difference is the age distribution of deaths, where COVID-19 is concentrated among older adults while the the 1918 pandemic affected all ages. In my state of Virginia, only 8% of the people who died in the 1918 pandemic were more than 50 years old, compared to more than 97% for COVID-19.

The CDC estimates that the 1918 pandemic resulted in about 675,000 deaths in the United States, so slightly more than five times the current number of COVID-19 deaths. In October of 1918, the worst month for the influenza pandemic, about 195,000 people died – well more than all who have died so far from COVID-19.

As with any historical comparison, there are important qualifiers. In this case, the influenza pandemic started in early 1918 and continued well into 1919, whereas COVID-19 deaths are for about one-third of a year (March through June). However, today the United States’ population is about three times the size of the population in 1918. These two factors roughly “cancel out,” and so it is reasonable to think about the 1918 epidemic being about five times worse than COVID-19, at least thus far.

In comparison to past wars, the U.S. has now had more deaths from COVID-19 than all the combat-related deaths in all the wars since the Korean War, including the Vietnam War and Operations Desert Shield and Desert Storm. In World War II there were 291,557 combat casualties. So the number of people who have died from COVID-19 thus far is about 45% of the WWII combat casualties. By the fall, it could be more than 70%.

Finally, note that the number of confirmed and probable deaths from COVID-19 in New York City (23,247 on July 10, 2020) is more than eight times the number who died in the 9/11 attack (2,753).


Mask resistance during a pandemic isn’t new – in 1918 many Americans were ‘slackers

https://theconversation.com/mask-resistance-during-a-pandemic-isnt-new-in-1918-many-americans-were-slackers-141687?utm_medium=email&utm_campaign=The%20Weekend%20Conversation%20-%201680716207&utm_content=The%20Weekend%20Conversation%20-%201680716207+Version+A+CID_c211e1b0b6c4b69b3a29a9d1624a2ab6&utm_source=campaign_monitor_us&utm_term=Mask%20resistance%20during%20a%20pandemic%20isnt%20new%20%20in%201918%20many%20Americans%20were%20slackers

Mask resistance during a pandemic isn't new – in 1918 many ...

We have all seen the alarming headlines: Coronavirus cases are surging in 40 states, with new cases and hospitalization rates climbing at an alarming rate. Health officials have warned that the U.S. must act quickly to halt the spread – or we risk losing control over the pandemic.

There’s a clear consensus that Americans should wear masks in public and continue to practice proper social distancing. While a majority of Americans support wearing masks, widespread and consistent compliance has proven difficult to maintain in communities across the country. Demonstrators gathered outside city halls in Scottsdale, ArizonaAustin, Texas; and other cities to protest local mask mandates. Several Washington state and North Carolina sheriffs have announced they will not enforce their state’s mask order.

I’ve researched the history of the 1918 pandemic extensively. At that time, with no effective vaccine or drug therapies, communities across the country instituted a host of public health measures to slow the spread of a deadly influenza epidemic: They closed schools and businesses, banned public gatherings and isolated and quarantined those who were infected. Many communities recommended or required that citizens wear face masks in public – and this, not the onerous lockdowns, drew the most ire.

Mask resistance during a pandemic isn't new – in 1918 many ...

In mid-October of 1918, amidst a raging epidemic in the Northeast and rapidly growing outbreaks nationwide, the United States Public Health Service circulated leaflets recommending that all citizens wear a mask. The Red Cross took out newspaper ads encouraging their use and offered instructions on how to construct masks at home using gauze and cotton string. Some state health departments launched their own initiatives, most notably California, Utah and Washington.

Nationwide, posters presented mask-wearing as a civic duty – social responsibility had been embedded into the social fabric by a massive wartime federal propaganda campaign launched in early 1917 when the U.S. entered the Great War. San Francisco Mayor James Rolph announced that “conscience, patriotism and self-protection demand immediate and rigid compliance” with mask wearing. In nearby Oakland, Mayor John Davie stated that “it is sensible and patriotic, no matter what our personal beliefs may be, to safeguard our fellow citizens by joining in this practice” of wearing a mask.

Health officials understood that radically changing public behavior was a difficult undertaking, especially since many found masks uncomfortable to wear. Appeals to patriotism could go only so far. As one Sacramento official noted, people “must be forced to do the things that are for their best interests.” The Red Cross bluntly stated that “the man or woman or child who will not wear a mask now is a dangerous slacker.” Numerous communities, particularly across the West, imposed mandatory ordinances. Some sentenced scofflaws to short jail terms, and fines ranged from US$5 to $200.

Mask resistance during a pandemic isn't new – in 1918 many ...

Passing these ordinances was frequently a contentious affair. For example, it took several attempts for Sacramento’s health officer to convince city officials to enact the order. In Los Angeles, it was scuttled. A draft resolution in Portland, Oregon led to heated city council debate, with one official declaring the measure “autocratic and unconstitutional,” adding that “under no circumstances will I be muzzled like a hydrophobic dog.” It was voted down.

Utah’s board of health considered issuing a mandatory statewide mask order but decided against it, arguing that citizens would take false security in the effectiveness of masks and relax their vigilance. As the epidemic resurged, Oakland tabled its debate over a second mask order after the mayor angrily recounted his arrest in Sacramento for not wearing a mask.prominent physician in attendance commented that “if a cave man should appear…he would think the masked citizens all lunatics.”

In places where mask orders were successfully implemented, noncompliance and outright defiance quickly became a problem. Many businesses, unwilling to turn away shoppers, wouldn’t bar unmasked customers from their stores. Workers complained that masks were too uncomfortable to wear all day. One Denver salesperson refused because she said her “nose went to sleep” every time she put one on. Another said she believed that “an authority higher than the Denver Department of Health was looking after her well-being.” As one local newspaper put it, the order to wear masks “was almost totally ignored by the people; in fact, the order was cause of mirth.” The rule was amended to apply only to streetcar conductors – who then threatened to strike. A walkout was averted when the city watered down the order yet again. Denver endured the remainder of the epidemic without any measures protecting public health.

Mask resistance during a pandemic isn't new – in 1918 many ...

In Seattle, streetcar conductors refused to turn away unmasked passengers. Noncompliance was so widespread in Oakland that officials deputized 300 War Service civilian volunteers to secure the names and addresses of violators so they could be charged. When a mask order went into effect in Sacramento, the police chief instructed officers to “Go out on the streets, and whenever you see a man without a mask, bring him in or send for the wagon.” Within 20 minutes, police stations were flooded with offenders. In San Francisco, there were so many arrests that the police chief warned city officials he was running out of jail cells. Judges and officers were forced to work late nights and weekends to clear the backlog of cases.

Many who were caught without masks thought they might get away with running an errand or commuting to work without being nabbed. In San Francisco, however, initial noncompliance turned to large-scale defiance when the city enacted a second mask ordinance in January 1919 as the epidemic spiked anew.

Many decried what they viewed as an unconstitutional infringement of their civil liberties. On January 25, 1919, approximately 2,000 members of the “Anti-Mask League” packed the city’s old Dreamland Rink for a rally denouncing the mask ordinance and proposing ways to defeat it. Attendees included several prominent physicians and a member of the San Francisco Board of Supervisors.

It is difficult to ascertain the effectiveness of the masks used in 1918. Today, we have a growing body of evidence that well-constructed cloth face coverings are an effective tool in slowing the spread of COVID-19. It remains to be seen, however, whether Americans will maintain the widespread use of face masks as our current pandemic continues to unfold.

Deeply entrenched ideals of individual freedom, the lack of cohesive messaging and leadership on mask wearing, and pervasive misinformation have proven to be major hindrances thus far, precisely when the crisis demands consensus and widespread compliance.

This was certainly the case in many communities during the fall of 1918. That pandemic ultimately killed about 675,000 people in the U.S. Hopefully, history is not in the process of repeating itself today.


How the coronavirus pandemic became Florida’s perfect storm

https://theconversation.com/how-the-coronavirus-pandemic-became-floridas-perfect-storm-142333

How the coronavirus pandemic became Florida's perfect storm

If there’s one state in the U.S. where you don’t want a pandemic, it’s Florida. Florida is an international crossroads, a magnet for tourists and retirees, and its population is older, sicker and more likely to be exposed to COVID-19 on the job than the country as a whole.

When the coronavirus struck, the conditions there made it a perfect storm.

Florida set a single-day record for new COVID-19 cases in early July, passing 15,000 and rivaling New York’s worst day at the height of the pandemic there. The state has become an epicenter for the spread, with over 300,000 confirmed cases. Its hospital capacity is under stress, and the death toll has been rising.

Despite these strains, Disney World reopened two theme parks on July 11, and Florida Gov. Ron DeSantis announced schools would reopen in August. The governor had shut down alcohol sales in bars in late June as case numbers skyrocketed, but he hasn’t made face masks mandatory or moved to shut down other businesses where the virus can easily spread.

As public health researchers, we have been studying how states respond to the pandemic. Florida stands out, both for its absence of statewide policies that could have stemmed the spread of COVID-19 and for some unique challenges that make those policies both more necessary and more difficult to implement than in many other states.

The challenges of economic pressures

Florida is one of nine states with no income tax on wages, so its tax base relies heavily on tourism and property in its high-density coastal areas. That puts more pressure on the government to keep businesses and social venues open longer and reopen them faster after shutdowns.

If you look closely at Florida’s economy, its vulnerabilities to the pandemic become evident.

The state depends on international trade, tourism and agriculture – sectors that rely heavily on lower-wage, often seasonal, workers. These workers can’t do their jobs from home, and they face financial barriers to getting tested, unless it’s provided through their employer or government testing sites. They also struggle with health care – Florida has a higher-than-average rate of people without health insurance, and it chose not to expand Medicaid.

In the tourism industry, even young, healthy employees typically at lower risk from COVID-19 can unknowingly spread the virus to visitors or vice versa. The tourism industry also encourages crowded bar and club scenes, where the governor has blamed young people for spreading the coronavirus.

The past few weeks have been emblematic of the economic battles facing a state that depends on tourism for both jobs and state revenues.

Even as the public health risks were quickly rising, businesses continued to open their doors. Major cruise lines planned to resume their itineraries in the fall. A note on the Universal Studios website read: “Exposure to COVID-19 is an inherent risk in any public location where people are present; we cannot guarantee you will not be exposed during your visit.”

Disney World reopened on July 11 with face mask requirements. Matt Stroshane via Disney

Reopening guidance has been largely ignored

The Governor’s Re-open Florida Taskforce issued guidelines in late April meant to lower the state’s coronavirus risk, but those guidelines have been largely ignored in practice.

No county in Florida has reduced cases or maintained the health care resources recommended by the task force. The data needed to fully assess progress are also questionable, given a recent scandal regarding the state data’s accuracy, availability and transparency.

Still, the coronavirus’s rapid surge in Florida is evident in the state-reported casesTesting lines are long, and almost 1 in 5 tests have been positive for COVID-19, suggesting the prevalence of infections is still increasing.

Florida’s patchwork of local rules also makes it hard to contain the virus’s spread.

With no statewide mask rules or plans to reverse reopeningother than for bars, communities and businesses have taken their own actions to implement public health precautions. The result is varying mask ordinances and restrictions on large gatherings in some cities but not those surrounding them. Though the Florida Department of Health has issued an advisory recommending face coverings, some local areas have voted down mask mandates.

More warning signs ahead

Late summer and fall will bring new challenges for Florida in terms of the virus’s spread and the state’s response to it.

That’s when Florida’s risk of hurricanes grows, and while Floridians are well-versed in hurricane preparedness, storm shelters aren’t designed for social distancing and will need careful plans for protecting nursing home residents. Storm cleanup could mean lots of people working in close proximity while protective gear is in short supply.

If Florida’s schools reopen fully, the risk of the virus rapidly spreading to teachers, parents and children who are more vulnerable is a real concern being weighed against the costs of keeping schools closed.

Colleges that reopen to classes and sporting events also raise the risk of spreading the virus in Florida communities. And the possible return of retirees who spend their winters in Florida would increase the high-risk population by late fall. One in five Florida residents is over age 65, giving the state one of the nation’s oldest populations – a risk factor, along with chronic illnesses, for severe symptoms with COVID-19.

Florida is also a battleground state for the upcoming presidential election, and that’s likely to mean campaign rallies and more close contact. The Republican National Convention was moved to Jacksonville after President Donald Trump complained that North Carolina might not let the GOP fill a Charlotte arena to capacity due to coronavirus restrictions. Florida organizers recently said they were considering holding parts of the convention outdoors.

The high number of cases being reported in Florida will lead to even more hospitalizations and fatalities in coming weeks and months. Without clear public health messages and precautions implemented and enforced across the state, the coronavirus forecast for the Sunshine State will remain stormy.


Modeling the ominous impact of testing delays

https://mailchi.mp/da2dd0911f99/the-weekly-gist-july-17-2020?e=d1e747d2d8

Sponsors Delay Trials and Shift Toward Using Remote Procedures ...

With delays in getting test results growing in many areas of the country, a new analysis in the Lancet shows just how destructive increased turnaround times for COVID tests can be.

Researchers modeled the impact of the timeliness and completeness of contact tracing, finding that minimizing testing delay—shortening the time between symptom onset and a positive test result—had the greatest impact on reducing future spread of the disease.

Digging into the details, if infected individuals who develop symptoms are isolated within one day of symptom onset, the R0 (“R-naught”) can be reduced to 1—each existing infection seeds one new case—stabilizing the level of infection in a population. With contact tracing, the R0 can be reduced to 0.8, meaning the disease will decline.

And researchers found with a testing delay of three days or more, even the most efficient isolation and contact tracing is essentially futile, powerless to bend the curve of transmission rates.

Ominous findings for many states, where average test turnaround times are again approaching one week, showing just how far we are from being able to implement the basic public health strategy of “test, trace and isolate”, which has proven effective for so many countries around the world.


Anticipating a post-pandemic “Renaissance Era”

https://mailchi.mp/da2dd0911f99/the-weekly-gist-july-17-2020?e=d1e747d2d8

The primary measures we’re using to control the spread of COVID-19—masks, social distancing, isolation—have changed little from those used to mitigate the Spanish Flu in 1918, or even the bubonic plague in the Middle Ages. (In fact, the word “quarantine” comes from the Italian quaranta giorni, the forty-day period of time that arriving ships were required to anchor off the Venetian coast to prevent the spread of the Black Death.)

We were intrigued by a recent piece in the New Yorker that looks at another impact of the plague that ravaged the world in the 14th and 15th centuries: the Black Death likely ushered in an era of unprecedented social change and knowledge advancement. Devastated economies recovered to become stronger than before, with greater equality. With half of the population wiped out, workers’ wages rose, leading to the rise of a new class of artisans and innovators. With a shortage of adult men to fill jobs, women found meaningful employment in many trades.

Science and medicine moved from a spiritual and astrological orientation to a more knowledge-based approach. The “quarantine enforcers” birthed a public health infrastructure. And so the Renaissance was born. But the author also points out that great upheavals, whether caused by disease, depression or war, lead to radical social adjustments—which can be a good thing or a bad thing.

Our current pandemic offers glimpses of both possibilities. Will distrust of science, government ineptitude, and political divisiveness become further entrenched? Or will society emerge stronger, with advances in technology and medicine, a stronger economy and a renewed social system that addresses deep-rooted inequality—our own post-pandemic Renaissance? It’s up to us.