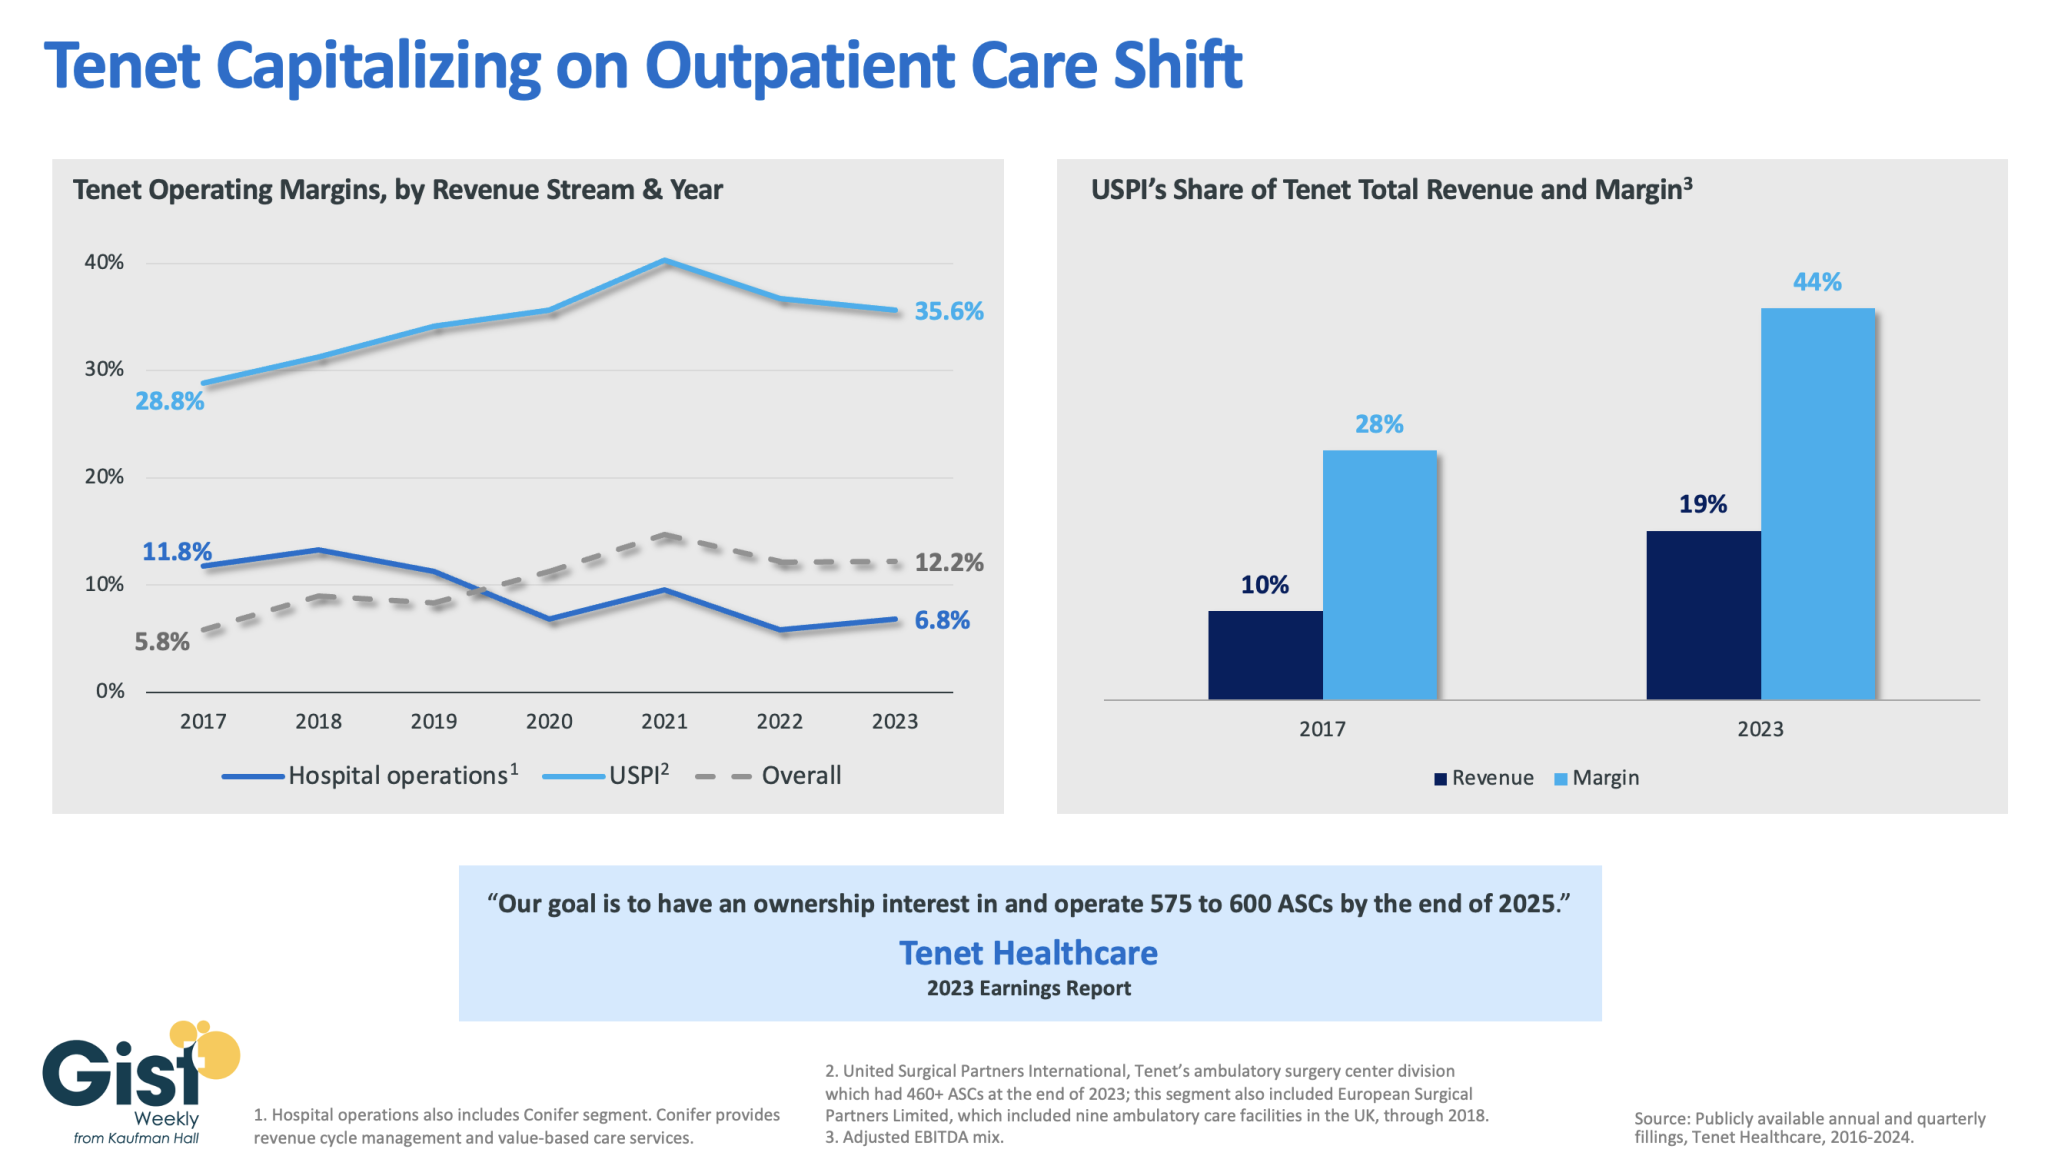
In this week’s graphic, we dive into recently released data on Tenet Healthcare’s 2023 financial performance. While the for-profit healthcare services company’s annual margin on hospital operations has declined since 2017, its overall profitability has more than doubled, thanks to strong performances from its ambulatory surgery center (ASC) chain,
United Surgical Partners International (USPI), which has consistently posted margins above 30 percent. Despite bringing in less than one fifth of Tenet’s total revenue, USPI is now responsible for almost half of Tenet’s overall margin.
Tenet has pursued this growth aggressively since buying USPI in 2015, swelling its ASC footprint from 249 locations in 2015 to more than 460 in 2023, with plans to increase that number to nearly 600 by the end of next year.
Tenet appears to be doubling down on its strategy of pursuing high-margin services over high-revenue services, especially as outpatient volumes are expected to far surpass growth in hospital-based care over the next decade.
Published last week in the New York Times, this piece highlights a growing trend in health system community benefit provision: partnering with developers to build affordable housing.
These partnerships have focused on a range of housing needs, from transitional housing for people experiencing homelessness, to housing for people who need special care, to affordable housing for hospital employees. Many of these projects also include co-located medical clinics to make it easier for residents to access healthcare services, and some are even being planned on health system-owned property.
The Gist: Housing security has long been a significant social determinant of health, something that most providers recognize every day, given that a record number of Americans are currently experiencing homelessness.
Among families with complex medical needs, stable housing was demonstrated to reduce adverse health outcomes in children by 20 percent. In addition to health systems, managed care organizations are also investing in different kinds of housing solutions, and at least 19 states are directing Medicaid dollars toward housing assistance.
On Tuesday, the 8th US Circuit Court of Appeals ruled against the pharmaceutical industry after its PhRMA (The Pharmaceutical Research and Manufacturers of America) trade group sued to prevent Arkansas from requiring drug manufacturers to distribute discounted drugs to 340B contract pharmacies. The judge’s decision, seen as a win for hospitals, affirmed state authority to establish regulations on top of the federal 340B law, which does not actually reference contract pharmacies. A Louisiana law similar to Arkansas’ is currently being challenged.
The Gist:This rulingcould encourage other states to pass laws protecting 340B contract pharmacy discounts. Contract pharmacy sales have swelled in recent years, prompting at least 20 major drug manufacturers to refuse to provide 340B discounts for drugs dispensed through contract pharmacies.
This issue is currently the subject of myriad lawsuits as courts have issued conflicting rulings.
Today is the federal income Tax Day. In 43 states, it’s in addition to their own income tax requirements. Last year, the federal government took in $4.6 trillion and spent $6.2 trillion including $1.9 trillion for its health programs. Overall, 2023 federal revenue decreased 15.5% and spending was down 8.4% from 2022 and the deficit increased to $33.2 trillion. Healthcare spending exceeded social security ($1.351 trillion) and defense spending ($828 billion) and is the federal economy’s biggest expense.
Along with the fragile geopolitical landscape involving relationships with China, Russia and Middle East, federal spending and the economy frame the context for U.S. domestic policies which include its health system. That’s the big picture.
Today also marks the second day of the American Hospital Association annual meeting in DC. The backdrop for this year’s meeting is unusually harsh for its members:
Increased government oversight:
Five committees of Congress and three federal agencies (FTC, DOJ, HHS) are investigating competition and business practices in hospitals, with special attention to the roles of private equity ownership, debt collection policies, price transparency compliance, tax exemptions, workforce diversity, consumer prices and more.
Medicare payment shortfall:
CMS just issued (last week) its IPPS rate adjustment for 2025: a 2.6% bump that falls short of medical inflation and is certain to exacerbate wage pressures in the hospital workforce. Per a Bank of American analysis last week, “it appears healthcare payrolls remain below pre-pandemic trend” with hospitals and nursing homes lagging ambulatory sectors in recovering.”
Persistent negative media coverage:
The financial challenges for Mission (Asheville), Steward (Massachusetts) and others have been attributed to mismanagement and greed by their corporate owners and reports from independent watchdogs (Lown, West Health, Arnold Ventures, Patient Rights Advocate) about hospital tax exemptions, patient safety, community benefits, executive compensation and charity care have amplified unflattering media attention to hospitals.
Physicians discontent:
59% of physicians in the U.S. are employed by hospitals; 18% by private equity-backed investors and the rest are “independent”. All are worried about their income. All think hospitals are wasteful and inefficient. Most think hospital employment is the lesser of evils threatening the future of their profession. And those in private equity-backed settings hope regulators leave them alone so they can survive. As America’s Physician Group CEO Susan Dentzer observed: “we knew we’re always going to need hospitals; but they don’t have to look or operate the way they do now. And they don’t have to be predicated on a revenue model based on people getting more elective surgeries than they actually need. We don’t have to run the system that way; we do run the healthcare system that way currently.”
The Value Agenda in limbo:
Since the Affordable Care Act (2010), the CMS Center for Innovation has sponsored and ultimately disabled all but 6 of its 54+ alternative payment programs. As it turns out, those that have performed best were driven by physician organizations sans hospital control. Last week’s release of “Creating a Sustainable Future for Value-Based Care: A Playbook of Voluntary Best Practices for VBC Payment Arrangements.” By the American Medical Association, the National Association of ACOs (NAACOs) and AHIP, the trade group representing America’s health insurance payers is illustrative. Noticeably not included: the American Hospital Association because value-pursuers think for hospitals it’s all talk.
National insurers hostility:
Large, corporate insurers have intensified reimbursement pressure on hospitals while successfully strengthening their collective grip on the U.S. health insurance sector. 5 insurers control 50% of the U.S. health insurance market: 4 are investor owned. By contrast, the 5 largest hospital systems control 17% of the hospital market: 1 is investor-owned. And bumpy insurer earnings post-pandemic has prompted robust price increases: in 2022 (the last year for complete data and first year post pandemic), medical inflation was 4.0%, hospital prices went up 2.2% but insurer prices increased 5.9%.
Costly capital:
The U.S. economy is in a tricky place: inflation is stuck above 3%, consumer prices are stable and employment is strong. Thus, the Fed is not likely to drop interest rates making hospital debt more costly for hospitals—especially problematic for public, safety net and rural hospitals. The hospital business is capital intense: it needs $$ for technologies, facilities and clinical innovations that treat medical demand. For those dependent on federal funding (i.e. Medicare), it’s unrealistic to think its funding from taxpayers will be adequate. Ditto state and local governments. For those that are credit worthy, capital is accessible from private investors and lenders. For at least half, it’s problematic and for all it’s certain to be more expensive.
Campaign 2024 spotlight:
In Campaign 2024, healthcare affordability is an issue to likely voters. It is noticeably missing among the priorities in the hospital-backed Coalition to Strengthen America’s Healthcare advocacy platform though 8 states have already created “affordability” boards to enact policies to protect consumers from medical debts, surprise hospital bills and more.
Understandably, hospitals argue they’re victims. They depend on AHA, its state associations, and its alliances with FAH, CHA, AEH and other like-minded collaborators to fight against policies that erode their finances i.e. 340B program participation, site-neutral payments and others. They rightfully assert that their 7/24/365 availability is uniquely qualifying for the greater good, but it’s not enough. These battles are fought with energy and resolve, but they do not win the war facing hospitals.
AHA spent more than $30 million last year to influence federal legislation but it’s an uphill battle. 70% of the U.S. population think the health system is flawed and in need of transformative change. Hospitals are its biggest player (30% of total spending), among its most visible and vulnerable to market change.
Some think hospitals can hunker down and weather the storm of these 8 challenges; others think transformative change is needed and many aren’t sure. And all recognize that the future is not a repeat of the past.
For hospitals, including those in DC this week, playing victim is not a strategy. A vision about the future of the health system that’s accessible, affordable and effective and a comprehensive plan inclusive of structural changes and funding is needed. Hospitals should play a leading, but not exclusive, role in this urgently needed effort.
Lacking this, hospitals will be public utilities in a system of health designed and implemented by others.
A new generation of doctors struggling with ever-increasing workloads and crushing student debt is helping drive unionization efforts in a profession that historically hasn’t organized.
Why it matters:
Physicians in training, like their peers in other industries, increasingly see unions as a way to boost their pay and protect themselves against grueling working conditions as they launch their careers.
It also comes amid a wave of unionization and labor actions by nurses and other caregivers across a health care system that’s still dealing with high levels of burnout.
What they’re saying:
“We deserve an increased salary to be able to afford to live in one of the most expensive areas in the United States,” said Ali Duffens, a third-year internal medicine resident at Kaiser Permanente’s San Francisco Medical Center.
She’s among the 400 residents at Kaiser’s Northern California system filing to unionize earlier this month.
Duffens earns about $82,000 per year, while paying $3,000 a month for rent and facing $350,000 in medical school loans.
The big picture:
The Kaiser residents are part of a growing number of younger peers in medicine who have been unionizing in recent years.
The number of medical residents in unions has about doubled to more than 32,000 in three years, per CalMatters.
In the last year, residents at Montefiore Medical Center, Stanford Health Care, George Washington University and the University of Pennsylvania voted to unionize, per WBUR.
“The cost of day care … in a month is about half of my salary in total, and the cost of a nanny is essentially the entirety of my salary,” Leah Rethy, an internal medicine resident with Penn Medicine, told NPR last year.
Residents can work as much as 80 hours per week while earning far less than their older colleagues.
Yes, but: Just about 6%-7% of physicians are estimated to be in unions.
Historically, doctors have thought they could just suck up the long hours and relatively low pay in training as part of the tradition of medicine, said Robert Wachter, chair of the department of medicine at the University of California, San Francisco.
“For a new generation, they look at it and say, ‘That’s crazy. I can’t believe you did that. I want to work hard, but I also want a life and I want a family, and I want a reasonable income,'” he said.
And it’s not just younger doctors.
Those more established in their careers are also unionizing as they see the industry changing in ways that they think undermine their profession.
In recent months, attending physicians at Salem Hospital, owned by Mass General Brigham, and a Cedars Sinai-owned anesthesiology practice filed to unionize.
About 600 doctors at Allina Health in Minnesota and Wisconsin last fall agreed to form what appears to be the largest union of private sector physicians.
Zoom in:
The corporatization of American medicine is seen as a key driver. More than half of all U.S. doctors now work for a health system or large medical group rather than running an independent practice.
This shift has brought heavier workloads and less control over how they care for patients, said John August, director of health care labor relations in the Scheinman Institute on Conflict Resolution at the ILR School at Cornell.
That could mean demands to see more patients, limiting the time that doctors can spend with them.
“What you will hear from them 100% of the time in every conversation they have is they feel that they have lost control over the patient-physician relationship. I mean, every single physician says that now,” August said.
The other side:
Health systems and large practices generally say they value their doctors and the relationships they hold with patients.
Hospitals have also struggled with pandemic-era financial shortfalls, including increasing labor costs.
The bottom line:
While this is a labor issue, it ultimately trickles down to quality and safety for patients, said Rachel Flores, organizing director of the Union of American Physicians and Dentists.
“Patients should care because that’s less time to address their issues,” she said. “Patients should care because there’s not enough staff to support the physician.”
Here are 23 health systems with strong operational metrics and solid financial positions, according to reports from credit rating agencies Fitch Ratings and Moody’s Investors Service released in 2024.
Avera Health has an “AA-” rating and a stable outlook with Fitch. The rating reflects the Sioux Falls, S.D.-based system’s strong operating risk and financial profile assessments, and significant size and scale, Fitch said.
Cedars-Sinai Health System has an “AA-” rating and a stable outlook with Fitch. The rating reflects the Los Angeles-based system’s consistent historical profitability and its strong liquidity metrics, historically supported by significant philanthropy, Fitch said.
Children’s Health has an “Aa3” rating and stable outlook with Moody’s. The rating reflects the Dallas-based system’s continued strong performance from a focus on high margin and tertiary services, as well as a distinctly leading market share, Moody’s said.
Children’s Hospital Medical Center of Akron (Ohio) has an “Aa3” rating and stable outlook with Moody’s. The rating reflects the system’s large primary care physician network, long-term collaborations with regional hospitals and leading market position as its market’s only dedicated pediatric provider, Moody’s said.
Children’s Hospital of Orange County has an “AA-” rating and a stable outlook with Fitch. The rating reflects the Orange, Calif.-based system’s position as the leading provider for pediatric acute care services in Orange County, a position solidified through its adult hospital and regional partnerships, ambulatory presence and pediatric trauma status, Fitch said.
Cook Children’s Medical Center has an “Aa2” rating and stable outlook with Moody’s. The ratings agency said the Fort Worth Texas-based system will benefit from revenue diversification through its sizable health plan, large physician group, and an expanding North Texas footprint.
El Camino Health has an “AA” rating and a stable outlook with Fitch. The rating reflects the Mountain View, Calif.-based system’s strong operating profile assessment with a history of generating double-digit operating EBITDA margins anchored by a service area that features strong demographics as well as a healthy payer mix, Fitch said.
JPS Health Network has an “AA” rating and stable outlook with Fitch. The rating reflects the Fort Worth, Texas-based system’s sound historical and forecast operating margins, the ratings agency said.
Mass General Brigham has an “Aa3” rating and stable outlook with Moody’s. The rating reflects the Somerville, Mass.-based system’s strong reputation for clinical services and research at its namesake academic medical center flagships that drive excellent patient demand and help it maintain a strong market position, Moody’s said.
McLaren Health Care has an “AA-” rating and stable outlook with Fitch. The rating reflects the Grand Blanc, Mich.-based system’s leading market position over a broad service area covering much of Michigan, the ratings agency said.
Med Center Health has an “AA-” rating and stable outlook with Fitch. The rating reflects the Bowling Green, Ky.-based system’s strong operating risk assessment and leading market position in a primary service area with favorable population growth, Fitch said.
Novant Health has an “AA-” rating and stable outlook with Fitch. The ratings agency said the Winston-Salem, N.C.-based system’s recent acquisition of three South Carolina hospitals from Dallas-based Tenet Healthcare will be accretive to its operating performance as the hospitals are highly profited and located in areas with growing populations and good income levels.
Oregon Health & Science University has an “Aa3” rating and stable outlook with Moody’s. The rating reflects the Portland-based system’s top-class academic, research and clinical capabilities, Moody’s said.
Orlando (Fla.) Health has an “AA-” rating and stable outlook with Fitch. The rating reflects the health system’s strong and consistent operating performance and a growing presence in a demographically favorable market, Fitch said.
Presbyterian Healthcare Services has an “AA” rating and stable outlook with Fitch. The Albuquerque, N.M.-based system’s rating is driven by a strong financial profile combined with a leading market position with broad coverage in both acute care services and health plan operations, Fitch said.
Rush University System for Health has an “AA-” rating and stable outlook with Fitch. The rating reflects the Chicago-based system’s strong financial profile and an expectation that operating margins will rebound despite ongoing macro labor pressures, the rating agency said.
Saint Francis Healthcare System has an “AA” rating and stable outlook with Fitch. The rating reflects the Cape Girardeau, Mo.-based system’s strong financial profile, characterized by robust liquidity metrics, Fitch said.
Saint Luke’s Health System has an “Aa2” rating and stable outlook with Moody’s. The Kansas City, Mo.-based system’s rating was upgraded from “A1” after its merger with St. Louis-based BJC HealthCare was completed in January.
Salem (Ore.) Health has an”AA-” rating and stable outlook with Fitch. The rating reflects the system’s dominant marketing positive in a stable service area with good population growth and demand for acute care services, Fitch said.
Seattle Children’s Hospital has an “AA” rating and a stable outlook with Fitch. The rating reflects the system’s strong market position as the only children’s hospital in Seattle and provider of pediatric care to an area that covers four states, Fitch said.
SSM Health has an “AA-” rating and stable outlook with Fitch. The St. Louis-based system’s rating is supported by a strong financial profile, multistate presence and scale with good revenue diversity, Fitch said.
University of Colorado Health has an “AA” rating and stable outlook with Fitch. The Aurora-based system’s rating reflects a strong financial profile benefiting from a track record of robust operating margins and the system’s growing share of a growth market anchored by its position as the only academic medical center in the state, Fitch said.
Willis-Knighton Medical Center has an “AA-” rating and positive outlook with Fitch. The outlook reflects the Shreveport, La.-based system’s improving operating performance relative to the past two fiscal years combined with Fitch’s expectation for continued improvement in 2024 and beyond.
Health system operating margins improved in 2023 after a tumultuous 2022. Increased revenue from rebounding patient volumes helped offset the high costs of labor and supplies for many systems, but some continue to face challenges turning a financial corner.
In a Feb. 21 analysis, Kaufman Hall noted that too many hospitals are losing money but high-performing hospitals are faring far better, “effectively pulling away from the pack.”
Average operating margins have see-sawed over the last 12 months, from a -1.2% low in February 2023 to 5.5% highs in June and December. In February, average operating margins dropped to 3.96% before the Change Healthcare data breach, which has impacted claims processing.
Here are 42 health systems ranked by operating margins in their most recent financial results.
Editor’s note: The following financial results are for the 12 months ending Dec. 31, 2023, unless otherwise stated.
Revenue: $20.55 billion Expenses: $18.31 billion Operating income/loss: $2.5 billion (*Includes grant income and equity in earnings of unconsolidated affiliates) Operating margin: 12.2%
*Results for the first six months ending Dec. 31 Revenue: $2.1 billion Expenses: $2 billion Operating income/loss: $22.9 million Operating margin: 1.1%
Prices for non-trauma inpatient admissions were 4.4 percent higher at trauma center hospitals than at hospitals without a trauma designation.
Hospitals designated as trauma centers charged higher prices for non-trauma inpatient admissions and emergency department visits compared to non-trauma center hospitals, a Health Affairs study found.
Hospital prices are the largest driver of rising healthcare spending in the commercial market and are often influenced by the structure of hospital markets. Trauma centers are a critical aspect of the hospital market as they are highly regulated and endowed by regulators with monopoly power over trauma patients in their service areas.
In most states, regulations are designed to encourage the entry of new trauma centers in areas that do not already have one and restrict new entry into areas that already have a trauma center. Additional regulations often require all trauma patients within an area to be transported or transferred to the designated hospital serving the area.
These restrictions create local monopolies for hospitals that are designated as trauma centers. Those in favor of the regulations argue that the monopolies are necessary to ensure each trauma center has sufficient volume to support high-quality and low-cost care. However, this structure could allow hospitals with market power over trauma services to raise prices for non-trauma services.
Researchers used claims data from 2011 to 2018 to assess whether hospitals designated as trauma centers use their market power for trauma services to receive above-market rates for non-trauma services. The sample included 2,000 hospitals with more than two million inpatient admissions and ten million emergency department visits over the study period.
The share of hospitals included in the sample serving as trauma centers increased from 21 percent in 2012 to 28 percent in 2018, resulting in a net addition of 138 trauma centers. The share of non-trauma inpatient admissions and emergency department visits at hospitals serving as trauma centers also increased between 2012 and 2018.
Hospitals serving as trauma centers every year from 2012 to 2018 were categorized as an always trauma center. Opened trauma centers were those not serving as a trauma center in 2012 but serving as one by 2018. Hospitals serving as a trauma center in 2012 but not in 2018 were closed trauma centers, and hospitals that did not serve as a trauma center at all during the study period were called “never trauma centers.”
The average price for non-trauma inpatient admissions among all hospitals was $21,112. Always trauma center hospitals had a higher average price of $22,568 per inpatient admission. The average price per admission was $22,097 at opened centers, $20,589 at closed centers, and $19,769 at never centers. Emergency department prices were similar, with always and opened center hospitals having higher prices than closed and never trauma center facilities.
Always trauma center hospitals were generally larger compared to the other hospital types and were more likely to be in more concentrated hospital markets. The average new injury severity score among emergency department visits in never trauma center hospitals was smaller compared to scores at other hospitals. The average MS-DRG weight for always trauma center hospitals was 1.61 compared to 1.54 for opened and never trauma center hospitals.
Holding these patient and hospital characteristics constant, prices for non-trauma inpatient admissions were 4.4 percent higher in hospitals with trauma center designation than at non-trauma center hospitals. Prices for non-trauma emergency department visits were 5.2 percent higher in trauma center hospitals.
“The results presented here provide an example of an important challenge: How to ensure access to specialized services and protect public health while also accounting for and possibly managing the effects of concomitant market failure,” researchers wrote.
“Our findings provide empirical support for the notion that provider market power in one area can be leveraged to affect prices in other areas.”
The No Surprises Act limits the amounts that hospitals can charge to out-of-network patients for emergency services, including trauma services. This may help limit trauma emergency cross-service leverage pricing, researchers said.
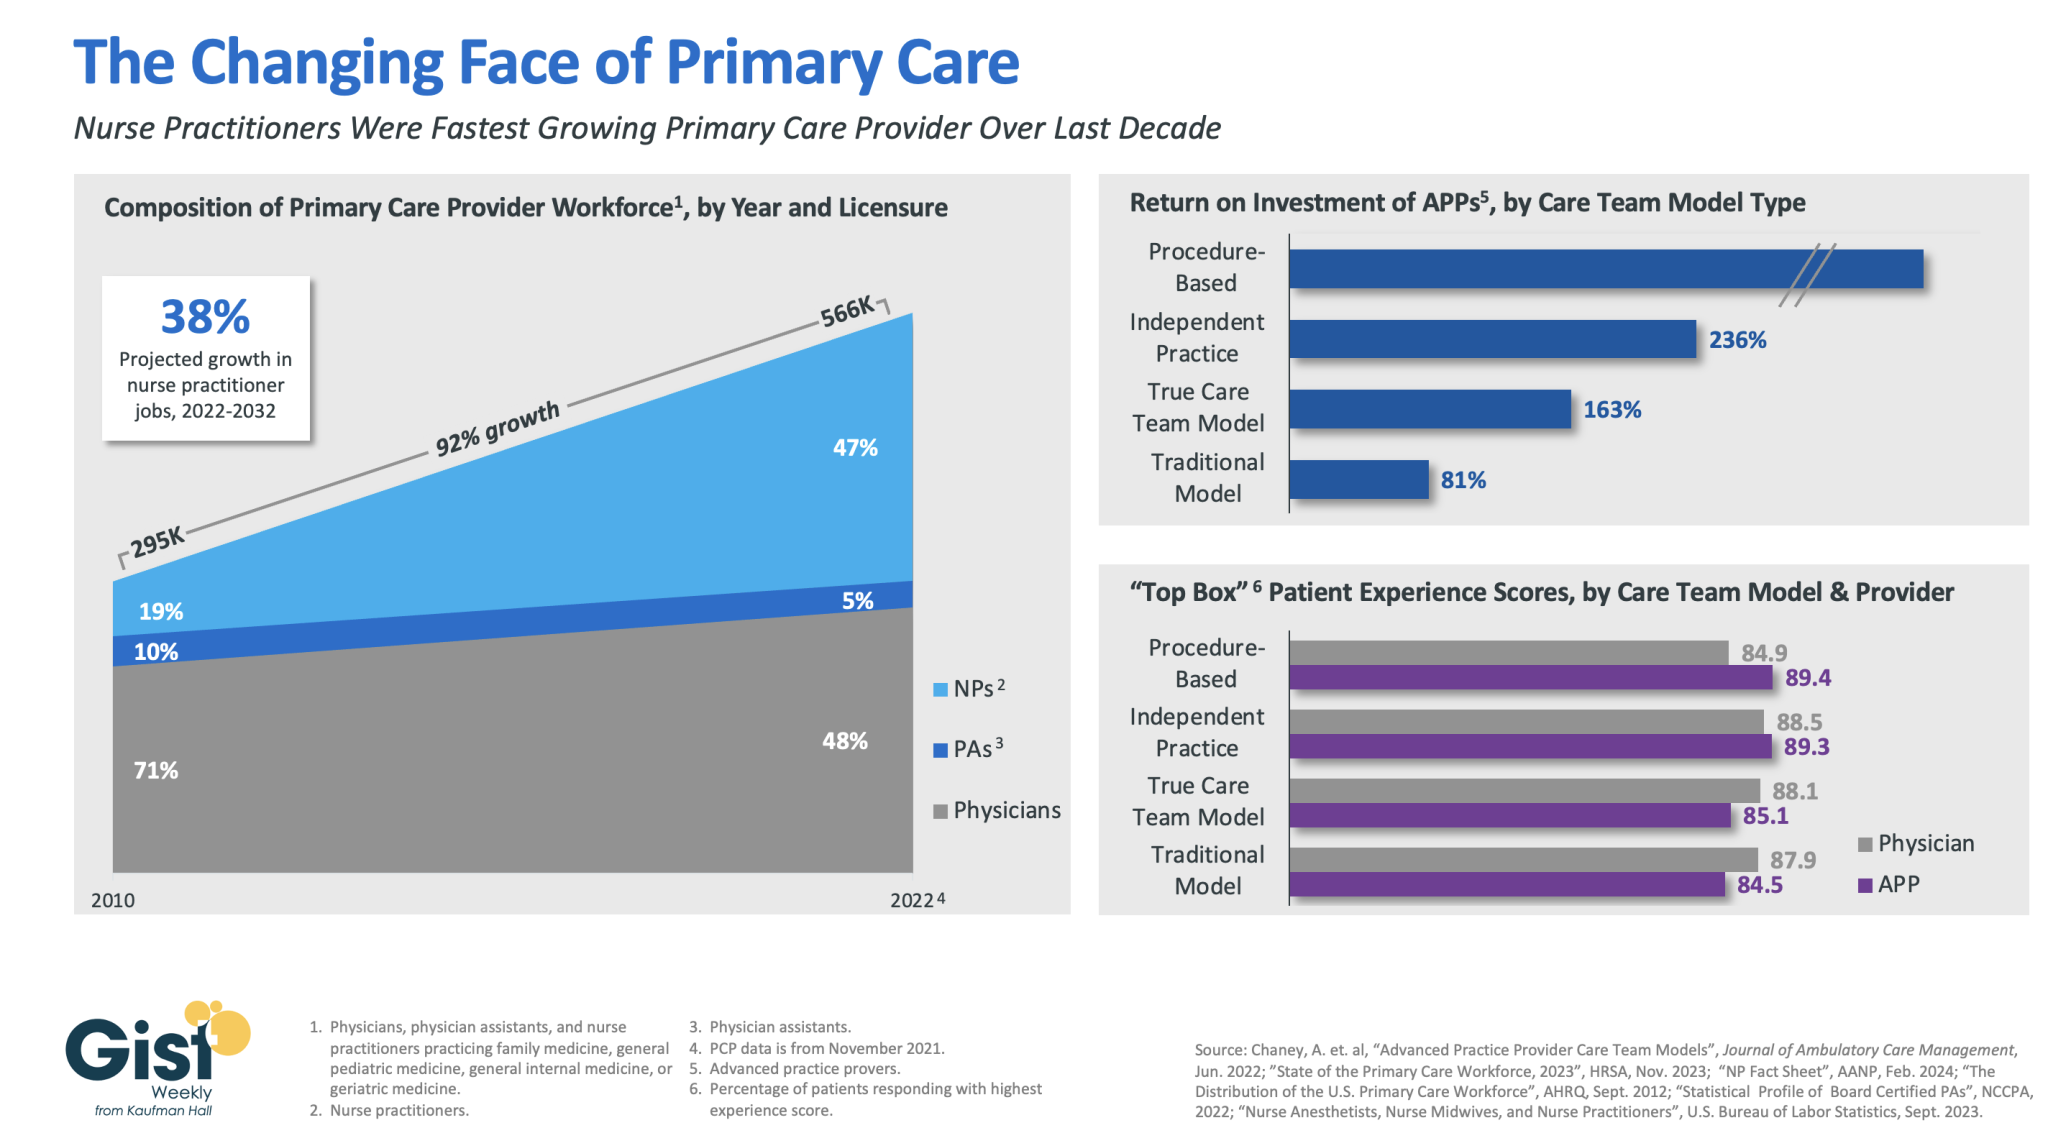
In this week’s graphic, we highlight how the primary care provider workforce has evolved over the past decade in both the pursuit of team-based care models and value-based care, as well as in response to rising labor costs and physician shortages.
In 2010, physicians made up more than 70 percent of the primary care workforce. But over the next 12 years, the number of primary care providers nearly doubled, largely driven by immense growth of nurse practitioners in the workforce.
As of 2022, more than half of primary care providers were advanced practice providers (APPs), who continue to have a strong job outlook across the next decade (especially nurse practitioners).This shift has been beneficial to many provider organizations.
In a study from the Mayo Clinic, the return on investment was positive across a variety of APP practice models, especially in procedural-based specialties but across both independent practice models and full care team models as well.
APPs also receive similar patient experience scores as their physician counterparts.
Continued integration of APPs in team-based care models remains a key strategy for health systems seeking to improve access while lowering costs, especially in primary care.