Asexpected, 2023 saw a material increase in downgrades over 2022 while the number of upgrades declined from the prior year. Volume showed favorable growth for many hospitals during 2023 although some indicators remained below pre-pandemic levels. Other hospitals reported a payer mix shift toward more Medicare as the population continued to age and Medicare Advantage plans gained momentum at the expense of commercial revenues. Continued labor challenges drove expense growth, even with many organizations reporting a reduction in temporary labor, as permanent hires pressured salary and benefit expenses. Some of the downgrades reflected pronounced operating challenges that led to covenant violations while others were due to a material increase in leverage viewed to be too high for the rating category.
Figure1: Downgrades at Moody’s, S&P, and Fitch
Here are five key takeaways:
The ratio of downgrades to upgrades reached a high level for all three rating agencies: Moody’s, 3.2-to-1; S&P: 3.8-to-1; and Fitch: 3.5-to-1. In 2022, the ratio crested just above 2.0-to-1 at the highest among the three firms.
Downgrades covered a wide swath of hospitals, ranging from single-site general acute care facilities to academic medical centers as well as large regional and multistate systems. Many of the hospital downgrades were concentrated in New York, Pennsylvania, Ohio, and Washington. All rating categories saw downgrades, although the majority were clustered in the Baa/BBB and lower categories.
Multi-notch downgrades were mainly relegated to ratings that were already deep into speculative grade. Multi-notch upgrades were due to mergers or acquisitions where the debt was guaranteed by or added to the legal borrowing group of the higher rated system.
Upgrades reflected fundamental improvement in financial performance and debt service coverage along with strengthening balance sheet indicators. Like the downgraded organizations, upgraded hospitals and health systems ranged from single-site hospitals to expansive, super-regional systems. Some of the upgrades reflected mergers into higher-rated systems.
The wide span between downgrades to upgrades in 2023 would suggest that the credit gap between highly rated hospitals (say, the “A” or “Aa/AA” category) compared to “Baa/BBB” and speculative grade is widening. That said, given that rating affirmations remain the predominant rating activity annually, the rating agencies reported only a subtle shift in the overall distribution of ratings since the beginning of the pandemic in their panel discussion at Kaufman Hall’s October 2023 Healthcare Leadership Conference.
One person’s prediction for 2024?
It’s a safe bet that downgrades will outpace upgrades given the persistent challenges, although the ratio may narrow if the improvement in current performanceholds. That said, the rating agencies are maintaining mixed views for 2024. S&P and Fitch are sticking with negative and deteriorating outlooks, respectively, while Moody’s has revised its outlook to stable, anticipating that the rough times of 2022 are behind us.
All three rating agencies predict that we are not out of the woods yet when it comes to covenant challenges, especially in the lower rating categories or for those organizations that report a second year of covenant violations.
Not long ago, I opened a new box of cereal and found a lot fewer flakes than usual. The plastic bag inside was barely three-quarters full.
This wasn’t a manufacturing error. It was an example of shrinkflation.
Following years of escalating prices (to offset higher supply-chain and labor costs), packaged-goods producers began facing customer resistance. So, rather than keep raising prices, big brands started giving Americans fewer ounces of just about everything—from cereal to ice cream to flame-grilled hamburgers—hoping no one would notice.
This kind of covert skimping doesn’t just happen at the grocery store or the drive-thru lane. It’s been present in American healthcare for more than a decade.
What Happened To Healthcare Prices?
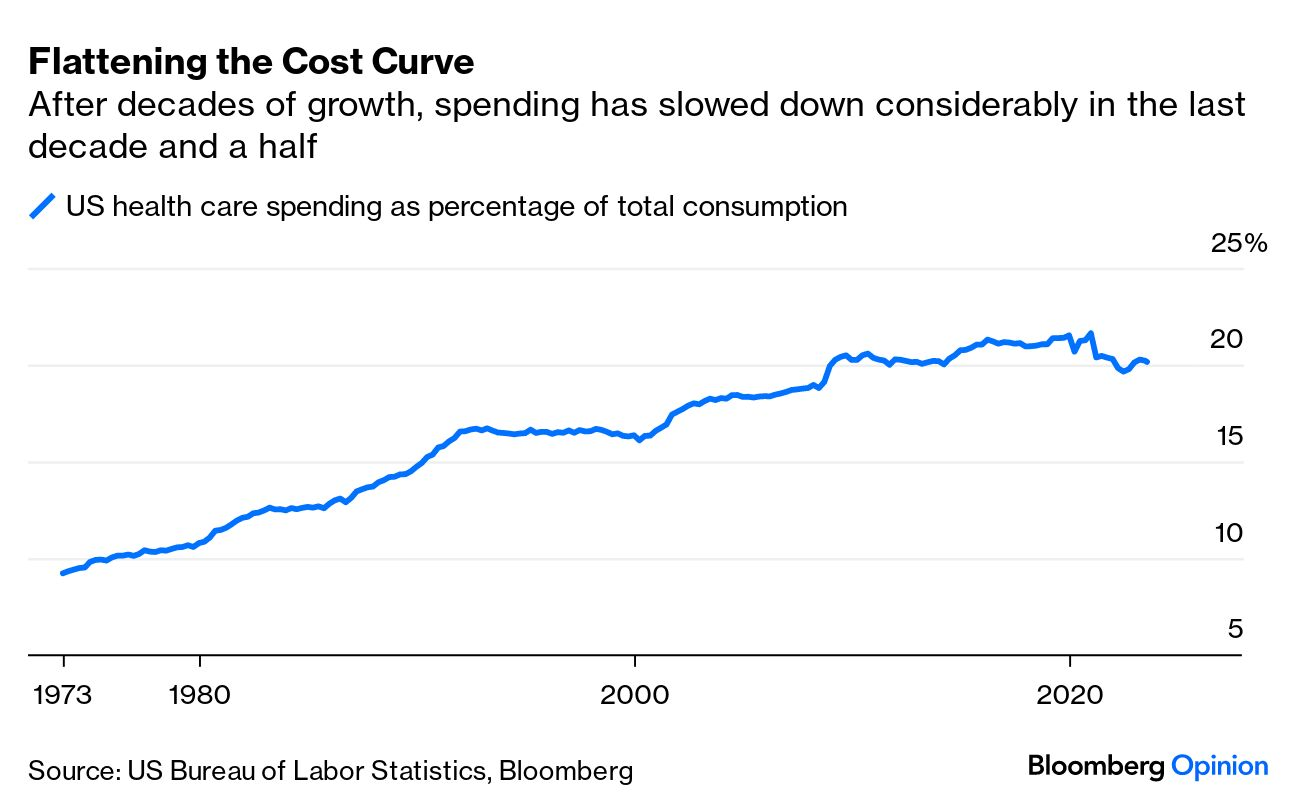
With the passage of the Medicare and Medicaid Act in 1965, healthcare costs began consuming ever-higher percentages of the nation’s gross domestic product.
In 1970, medical spending took up just 6.9% of the U.S. GDP. That number jumped to 8.9% in 1980, 12.1% in 1990, 13.3% in 2000 and 17.2% in 2010.
This trajectory is normal for industrialized nations. Most countries follow a similar pattern: (1) productivity rises, (2) the total value of goods and services increases, (3) citizens demand better care, newer drugs, and more access to doctors and hospitals, (4) people pay more and more for healthcare.
But does more expensive care equate to better care and longer life expectancy? It did in the United States from 1970 to 2010. Longevity leapt nearly a decade as healthcare costs rose (as a percentage of GDP).
Then American Healthcare Hit A Ceiling
Beginning in 2010, something unexpected happened. Both of these upward trendlines—healthcare inflation and longevity—flattened.
Spending on medical care still consumes roughly 17% of the U.S. GPD—the same as 2010. Meanwhile, U.S. life expectancy in 2020 (using pre-pandemic data) was 77.3 years—about the same as in 2010 when the number was 78.7 years.
How did these plateaus occur?
Skimping On U.S. Healthcare
With the passage of the Affordable Care Act of 2010, healthcare policy experts hoped expansions in health insurance coverage would lead to better clinical outcomes, resulting in fewer heart attacks, strokes and cancers. Their assumption was that fewer life-threatening medical problems would bring down medical costs.
That’s not what happened. Although the rate of healthcare inflation did, indeed, slow to match GDP growth, the cost decreases weren’t from higher-quality medical care, drug breakthroughs or a healthier citizenry. Instead, it was driven by skimping.
To illustrate this, here are three ways that skimping reduces medical costs but worsens public health:
1. High-Deductible Health Insurance
In the 20th century, traditional health insurance included two out-of-pocket expenses. Patients paid a modest upfront fee at the point of care (in a doctor’s office or hospital) and then a portion of the medical bill afterward, usually totaling a few hundred dollars.
Both those numbers began skyrocketing around 2010 when employers adopted high-deductible insurance plans to offset the rising cost of insurance premiums (the amount an insurance company charges for coverage). With this new model, workers pay a sizable sum from their own pockets—up to $7,050 for single coverage and $14,100 for families—before any health benefits kick in.
Insurers and businesses argue that high-deductible plans force employees to have more “skin in the game,” incentivizing them to make wiser healthcare choices.
But instead of promoting smarter decisions, these plans have made care so expensive that many patients avoid getting the medical assistance they need.Nearly half of Americans have taken on debt due to medical bills. And 15% of people with employer-sponsored health coverage (23 million people) have seen their health get worse because they’ve delayed or skipped needed care due to costs.
And when it comes to Medicaid, the government-run health program for individuals living in poverty, doctors and hospitals are paid dramatically lower rates than with private insurance.
As a result, even though the nation’s 90 million Medicaid enrollees have health insurance, they find it difficult to access care because an increasing number of physicians won’t accept them as patients.
2. Cost Shifting
Unlike with private insurers, the U.S. government unilaterally sets prices when paying for healthcare. And in doing so, it transfers the financial burden to employers and uninsured patients, which leads to skimping.
To understand how this happens, remember that hospitals pay the same amount for doctors, nurses and medicines, regardless of how much they are paid (by insurers) to care for a patient. If the dollars reimbursed for some patients don’t cover the costs, then other patients are charged more to make up the difference.
Two decades ago, Congress enacted legislation to curb federal spending on healthcare. This led Medicare to drastically reduce how much it pays for inpatient services. Consequently, private insurers and uninsured patients now pay double and sometimes triple Medicare rates for hospital services, according to a Kaiser Family Foundation report.
These higher prices generate heftier out-of-pocket expenses for privately insured individuals and massive bills for the uninsured, forcing millions of Americans to forgo necessary tests and treatments.
3. Delaying, Denying Care
Insurers act as the bridge between those who pay for healthcare (businesses and the government) and those who provide it (doctors and hospitals). To sell coverage, they must design a plan that (a) payers can afford and (b) providers of care will accept.
When healthcare costs surge, insurers must either increase premiums proportionately, which payers find unacceptable, or find ways to lower medical costs. Increasingly, insurers are choosing the latter. And their most common approach to cost reduction is skimping through prior authorization.
Originally promoted as a tool to prevent misuse (or overuse) of medical services and drugs, prior authorization has become an obstacle to delivering excellent medical care. Insurers know that busy doctors will hesitate to recommend costly tests or treatments likely to be challenged. And even when they do, patients weary of the wait will abandon treatment nearly one-third of the time.
This dynamic creates a vicious cycle: costs go down one year, but medical problems worsen the next year, requiring even more skimping the third year.
The Real Cost Of Healthcare Skimping
Federal actuaries project that healthcare expenses will rise another $3 trillion over the next eight years, consuming nearly 20% of the U.S. GDP by 2031.
But given the challenges of ongoing inflation and rapidly rising national debt, it’s more plausible that healthcare’s share of the GDP will remain at around 17%.
This outcome won’t be due to medical advancements or innovative technologies, but rather the result of greater skimping.
For example, consider that Medicare decreased payments to doctors 2% this year with another 3.3% cut proposed for 2024. And this year, more than 10 million low-income Americans have lost Medicaid coverage as states continue rolling back eligibility following the pandemic. And insurers are increasingly using AI to automate denials for payment.
Currently, the competitive job market has business leaders leery of cutting employee health benefits. But as the economy shifts, employees should anticipate paying even more for their healthcare.
The truth is that our healthcare system is grossly inefficient and financially unsustainable. Until someone or something disrupts that system, replacing it with a more effective alternative, we will see more and more skimping as our nation struggles to restrain medical costs.
Late last week, the Congressional Budget Office (CBO) released its analysis of the Center for Medicare and Medicaid Innovation (CMMI)’s spending outlays, revealing that in its first decade of operations it produced a $5.4B net increase in federal spending instead of a projected $2.8B reduction.
Moreover, CBO revised its CMMI projection for 2021-2030 from a $77.5B net spending reduction to a $1.3B increase, predicting CMMI may only begin to generate annual savings in 2031. CBO says its updated projections largely reflect revised expectations on CMMI’s ability to identify and scale models that actually reduce Medicare spending.
CMMI was created by the Affordable Care Act (ACA) in 2010 to test new payment models and other initiatives for reducing the federal government’s healthcare costs, but of the nearly 50 models it has run, only four have become permanent programs.
The Gist: This critical report confirms what many in the healthcare world already believed: the ACA’s value-based care initiatives have largely struggled to reduce Medicare spending.
There are plenty of policy factors to blame, including the lack of mandatory participation for providers and conflicting incentives across care models, but one factor left out of the CBO report is CMMI’s disproportionate emphasis on accountable care organizations (ACOs) to produce meaningful cost savings, even as years of data proved otherwise.
ACOs are designed to reduce spending primarily through utilization management, but research has shown that prices, not utilization, are responsible for the US’s high medical spend relative to other countries.
While CMMI’s mission is still laudable and important, the center must make good on its 2021 “strategic refresh” if it hopes to continue receiving Congressional support.
With Medicare’s Annual Election Period (also known as Open Enrollment) beginning on October 15th, over 65 million adults across the United States will have until December 7th to decide whether they plan to renew or change their Medicare coverage. Beneficiaries choose between Traditional Medicare (TM) and a variety of Medicare Advantage (MA) plans and prescription drug coverage.
For this enrollment cycle, it is estimated that the average beneficiary will have over 40 plans to choose from, leading to complexity. For those who are dually eligible for both Medicare and Medicaid benefits, there is an even greater number of options for them to consider, especially if they live in areas where integrated options such as dual-eligible special needs plans and Medicare-Medicaid plans are available.
As the US population continues to age and the number of Medicare enrollees grow, it is important to understand how beneficiaries make their coverage decisions and ensure they are protected from any misinformation in the process.
Though already complex, the plan selection process for older adults is further complicated by the deceptive marketing tactics that brokers, agents, and third-party marketing organizations (TPMOs) have employed in recent years. In a recent study, the Commonwealth Fund identified how some of these practices are driven by the financial incentives associated with enrolling beneficiaries in particular MA plans.
Between robocalls and misleading television advertisements, many beneficiaries across the country have found themselves enrolled in MA plans they did not intend to enroll in, or that did not cover services or in-network providers that they were initially marketed. In a sweeping review of Medicare Open Enrollment-related television ads, Kaiser Family Foundation found that the majority of Open Enrollment-related advertisements last year promoted the Medicare logo and privately-operated hotlines, misleading beneficiaries into believing these were government sponsored ads and helplines.
Acknowledging the growing concerns and complaints among beneficiaries, the Centers for Medicare and Medicaid Services (CMS) announced that starting in 2024, Medicare-related television ads must be approved in advance of airing and cannot contain plan names or Medicare logos and images that misrepresent their organization or agency. Additional consumer protections included in the 2024 MA and Part D Final Rule will hold brokers, agents, and other TPMOs to higher standards of providing transparent, quality information. These activities include monitoring TPMO behavior, regulating how and when they market to beneficiaries, ensuring brokers review the full list of options and choices available to a beneficiary, and going through a detailed, standardized set of pre-enrollment questions. There is also an increased effort in getting beneficiaries to use some of the federally funded tools and resources available to assist in their coverage decisions.
Some of these tools include the Medicare.gov website, the CMS Medicare Plan Compare tool, and a 1-800-MEDICARE hotline to help inform beneficiaries about their benefits. However, a study by Hernandez et al. revealed that very few Medicare beneficiaries utilized these tools and often felt more comfortable discussing their options in-person with brokers or family members and friends, even though these sources may be biased or potentially inaccurate. Additionally, it is important to recognize that navigating these tools requires some degree of health literacy and technological proficiency, which may disproportionately affect those who are low-income, have lower levels of education, or are non-native English speakers.
The State Health Insurance Assistance Program (SHIP), however, is a free and unbiased resource for Medicare counseling that few beneficiaries are aware of. In 1990, the federal government implemented SHIPs to help support Medicare beneficiaries with free, one-to-one health insurance counseling and education within their communities. It is currently run by the Administration for Community Living (ACL). The ACL administers grants to states, who in turn provide funding to community-level subgrantees to maintain various networks of full-time, part-time, and/or volunteer counselors. The latest available data suggests that SHIPs provided assistance to 2.7 million Medicare beneficiaries from April 2018 through March 2019—just 4.5% of the eligible Medicare population.
While some states had greater success, serving over 10% of their eligible population, others were only able to reach as few as 2%. A 2018 evaluation of California’s SHIP, called HICAP (Health Insurance Counseling & Advocacy Program), highlighted the strengths of this community-based counseling system. HICAP reported high rates of engagement, citing their ability to deliver uniquely tailored counseling to beneficiaries in their native languages and through in-person or hybrid settings depending on the beneficiary’s condition or preferences. Moreover, strong marketing efforts via Spanish radio shows and mailing postcards were particularly effective in reaching “hard-to-locate” populations. However, the program did experience challenges given the variation in operations across locations, citing concerns over the recruitment, training and retention of volunteers and paid staff.
In recognition of SHIP’s potential to provide an unbiased alternative to brokers and combat misinformation, CMS finalized a requirement in the 2024 MA and Part D rule that TPMOs are to provide a disclaimer citing SHIP as an option for beneficiaries to obtain additional help (42 CFR § 422.2267(e )(41)). But despite SHIP’s promise, some beneficiary advocates have worried that the multi-tiered, volunteer, and part-time driven delivery model that characterizes most SHIPs leads to access and quality gaps. This is especially a concern among vulnerable beneficiaries who may live in low-income neighborhoods, have disabilities, or limited English proficiency. Given their historically low utilization rates and limited visibility, others have expressed concern that SHIPs may be ill-equipped to handle an increased demand for services in the coming year, due to more Medicare beneficiaries being advised of their existence through TPMO disclaimers. With the limited evidence about SHIP’s performance and outreach nationally, given the diffuse nature of the program, it will be important to understand some of the barriers and facilitators they face to delivering timely and accurate Medicare counseling.
The free and unbiased nature of the SHIP program presents a promising alternative to helping beneficiaries navigate complex plan choices for Open Enrollment. As MA enrollment increases and as plan choices become more complex, the SHIP program should be monitored for potential inequities in access to and quality of services based on area income.
For more information about your state’s SHIP program and to find a local Medicare counselor, please visit https://www.shiphelp.org/.
A piece published this week in the New York Times documents how Medicare spending per beneficiary has flattened since the early 2010s, coming in below projections by nearly $4T.
While the authors run through possible explanations, including changes made by the Affordable Care Act and to the Medicare Advantage program, the proliferation of effective cholesterol and blood-pressure medications, and fewer breakthroughs in new, expensive drug classes, they acknowledge that scholars have not reached a consensus on the primary drivers of this trend.
Beyond academic debate, there is also no agreement on how long the flattened spending pattern will hold—or what factors might reignite rapid cost growth.
The Gist:
Whatever the causes of this phenomenon, it has helped avert the kind of Medicare austerity measures that dominated political debates on the program in past decades.
We assume some of this flattening has to do with the fact that the average age of Medicare beneficiaries has dropped as Baby Boomers have entered the program in droves, given that younger beneficiaries are much less costly to insure.
In coming decades, the average age of Medicare beneficiaries will increase, along with their care costs, and the total number of Medicare beneficiaries will continue to rise.
By 2053, seniors will make up over 22 percent of the population and over 40 percent of the projected federal budget will be spent on programs for them.
Last Tuesday, the Center for Medicare and Medicaid Services (CMS) announced the first 10 medicines that will be subject to price negotiations with Medicare starting in 2026 per authorization in the Inflation Reduction Act (2022). It’s a big deal but far from a done deal.
Here are the 10:
Eliquis, for preventing strokes and blood clots, from Bristol Myers Squibb and Pfizer
Jardiance, for Type 2 diabetes and heart failure, from Boehringer Ingelheim and Eli Lilly
Xarelto, for preventing strokes and blood clots, from Johnson & Johnson
Januvia, for Type 2 diabetes, from Merck
Farxiga, for chronic kidney disease, from AstraZeneca
Entresto, for heart failure, from Novartis
Enbrel, for arthritis and other autoimmune conditions, from Amgen
Imbruvica, for blood cancers, from AbbVie and Johnson & Johnson
Stelara, for Crohn’s disease, from Johnson & Johnson
Fiasp and NovoLog insulin products, for diabetes, from Novo Nordisk
Notably, they include products from 10 of the biggest drug manufacturers that operate in the U.S. including 4 headquartered here (Johnson and Johnson, Merck, Lilly, Amgen) and the list covers a wide range of medical conditions that benefit from daily medications.
But only one cancer medicine was included (Johnson & Johnson and AbbVie’s Imbruvica for lymphoma) leaving cancer drugs alongside therapeutics for weight loss, Crohn’s and others to prepare for listing in 2027 or later.
And CMS included long-acting insulins in the inaugural list naming six products manufactured by the Danish pharmaceutical giant Novo Nordisk while leaving the competing products made by J&J and others off. So, there were surprises.
To date, 8 lawsuits have been filed against the U.S. Department of Health and Human Services by drug manufacturers and the likelihood litigation will end up in the Supreme Court is high.
These cases are being brought because drug manufacturers believe government-imposed price controls are illegal. The arguments will be closely watched because they hit at a more fundamental question:
what’s the role of the federal government in making healthcare in the U.S. more affordable to more people?
Every major sector in healthcare– hospitals, health insurers, medical device manufacturers, physician organizations, information technology companies, consultancies, advisors et al may be impacted as the $4.6 trillion industry is scrutinized more closely . All depend on its regulatory complexity to keep prices high, outsiders out and growth predictable. The pharmaceutical industry just happens to be its most visible.
The Pharmaceutical Industry
The facts are these:
66% of American’s take one or more prescriptions: There were 4.73 billion prescriptions dispensed in the U.S. in 2022
Americans spent $633.5 billion on their medicines in 2022 and will spend $605-$635 billion in 2025.
This year (2023), the U.S. pharmaceutical market will account for 43.7% of the global pharmaceutical market and more than 70% of the industry’s profits.
41% of Americans say they have a fair amount or a great deal of trust in pharmaceutical companies to look out for their best interests and 83% favor allowing Medicare to negotiate pricing directly with drug manufacturers (the same as Veteran’s Health does).
There were 1,106 COVID-19 vaccines and drugs in development as of March 18, 2023.
The U.S. industry employs 811,000 directly and 3.2 million indirectly including the 325,000 pharmacists who earn an average of $129,000/year and 447,000 pharm techs who earn $38,000.
And, in the U.S., drug companies spent $100 billion last year for R&D.
It’s a big, high-profile industry that claims 7 of the Top 10 highest paid CEOs in healthcare in its ranks, a persistent presence in social media and paid advertising for its brands and inexplicably strong influence in politics and physician treatment decisions.
The industry is not well liked by consumers, regulators and trading partners but uses every legal lever including patents, couponing, PBM distortion, pay-to-delay tactics, biosimilar roadblocks et al to protect its shareholders’ interests. And it has been effective for its members and advisors.
My take:
It’s easy to pile-on to criticism of the industry’s opaque pricing, lack of operational transparency, inadequate capture of drug efficacy and effectiveness data and impotent punishment against its bad actors and their enablers.
It’s clear U.S. pharma consumers fund the majority of the global industry’s profits while the rest of the world benefits.
And it’s obvious U.S. consumers think it appropriate for the federal government to step in. The tricky part is not just government-imposed price controls for a handful of drugs; it’s how far the federal government should play in other sectors prone to neglect of affordability and equitable access.
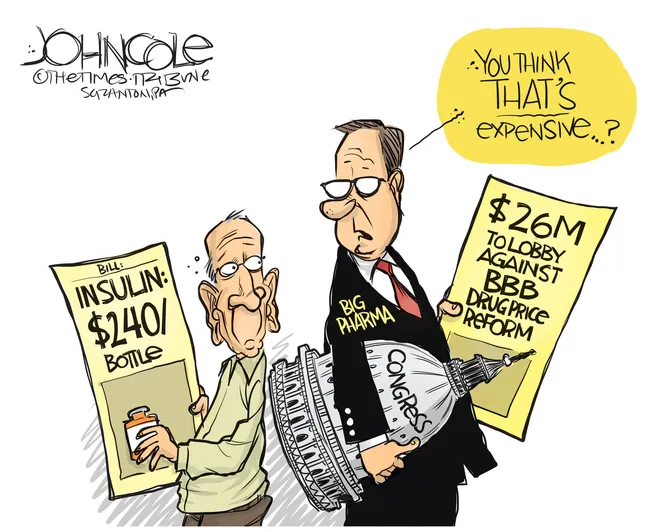
There will be lessons learned as this Inflation Reduction Act program is enacted alongside others in the bill– insulin price caps at $35/month per covered prescription, access to adult vaccines without cost-sharing, a yearly cap ($2,000 in 2025) on out-of-pocket prescription drug costs in Medicare and expansion of the low-income subsidy program under Medicare Part D to 150% of the federal poverty level starting in 2024. And since implementation of these price caps isn’t until 2026, plenty of time for all parties to negotiate, spin and adapt.
But the bigger impact of this program will be in other sectors where pricing is opaque, the public’s suspicious and valid and reliable data is readily available to challenge widely-accepted but flawed assertions about quality, value, access and outcomes. It’s highly likely hospitals will be next.
Two important reports released last Wednesday point to a disconnect in how policymakers are managing the U.S. economy and how the health economy fits.
Report One: The Federal Reserve Open Market Meeting
At its meeting last week, the Governors of the Federal Open Market Committee (FOMC) voted unanimously to keep the target range for the federal funds rate at 5% to 5.25%–the first time since last March that the Fed has concluded a policy meeting without raising interest rates.
In its statement by Chairman Powell, the central bank left open the possibility of additional rate hikes this year which means interest rates could hit 5.6% before trending slightly lower in 2024.
In conjunction with the (FOMC) meeting, meeting participants submitted projections of the most likely outcomes for each year from 2023 to 2025 and over the longer run:
Median
2023
2024
2025
Longer Run
Longer Run Range
% Change in GDP
1.1
1.1
1.8
1.8
1.6-2.5
Unemployment rate &
4.1
4.5
4.5
4.0
3.6-4.4
PCE Inflation rate
3.2
2.5
2.1
2.0
2.0
Core PCE Inflation
3.9
2.6
2.2
*
*
*Longer-run projections for core PCE inflation are not collected.
Notes re: the Fed’s projections based on these indicators:
The GDP (a measure of economic growth) is expected to increase 1% more this year than anticipated in its March 2023 analysis while estimates for 2024 were lowered just slightly by 0.1%. Economic growth will continue but at a slower pace.
The unemployment rate is expected to increase to 4.1% by the end of 2023, a smaller rise in joblessness than the previous estimate of 4.5%. (As of May, the unemployment rate was 3.7%). Unemployment is returning to normalcy impacting the labor supply and wages.
inflation: as measured by the Personal Consumption Expenditures index, will be 3.2% at the end of 2023 vs. 3.3% they previously projected. By the end of 2024, it expects inflation will be 2.5% reaching 2.1% at the end of 2025. Its 2.0% target is within reach on or after 2025 barring unforeseen circumstances.
Core inflation projections, which excludes energy and food prices, increased: the Fed now anticipates 3.9% by the end of 2023–0.3% above the March estimate. Price concerns will continue among consumers.
Based on these projections, two conclusions about nation’s monetary policy may be deduced the Fed’s report and discussion:
The Fed is cautiously optimistic about the U.S. economy in for the near term (through 2025) while acknowledging uncertainty exists.
Interest rates will continue to increase but at a slower rate than 2022 making borrowing and operating costs higher and creditworthiness might also be under more pressure.
Report Two: CMS
On the same day as the Fed meeting, the actuaries at the Centers for Medicare and Medicaid Services (CMS) released their projections for overall U.S. national healthcare spending for the next several years:
“CMS projects that over 2022-2031, average annual growth in NHE (5.4%) will outpace average annual growth in gross domestic product (GDP) (4.6%), resulting in an increase in the health spending share of GDP from 18.3% in 2021 to 19.6% in 2031. The insured percentage of the population is projected to have reached a historic high of 92.3% in 2022 (due to high Medicaid enrollment and gains in Marketplace coverage). It is expected to remain at that rate through 2023. Given the expiration of the Medicaid continuous enrollment condition on March 31, 2023 and the resumption of Medicaid redeterminations, Medicaid enrollment is projected to fall over 2023-2025, most notably in 2024, with an expected net loss in enrollment of 8 million beneficiaries. If current law provisions in the Affordable Care Act are allowed to expire at the end of 2025, the insured share of the population is projected to be 91.2%. In 2031, the insured share of the population is projected to be 90.5%, similar to pre-pandemic levels.”
The report includes CMS’ assumptions for 4 major payer categories:
Medicare Part D: Several provisions from the Inflation Reduction Act (IRA) are expected to result in out-of-pocket savings for individuals enrolled in Medicare Part D. These provisions have notable effects on the growth rates for total out-of-pocket spending for prescription drugs, which are projected to decline by 5.9% in 2024, 4.2% in 2025, and 0.2% in 2026.
Medicare: Average annual expenditure growth of 7.5% is projected for Medicare over 2022-2031. In 2022, the combination of fee-for-service beneficiaries utilizing emergent hospital care at lower rates and the reinstatement of payment rate cuts associated with the Medicare Sequester Relief Act of 2022 resulted in slower Medicare spending growth of 4.8% (down from 8.4% in 2021).
Medicaid: On average, over 2022-2031, Medicaid expenditures are projected to grow by 5.0%. With the end of the continuous enrollment condition in 2023, Medicaid enrollment is projected to decline over 2023-2025, with most of the net loss in enrollment (8 million) occurring in 2024 as states resume annual Medicaid redeterminations. Medicaid enrollment is expected to increase and average less than 1% through 2031, with average expenditure growth of 5.6% over 2025-2031.
Private Health Insurance: Over 2022-2031, private health insurance spending growth is projected to average 5.4%. Despite faster growth in private health insurance enrollment in 2022 (led by increases in Marketplace enrollment related to the American Rescue Plan Act’s subsidies), private health insurance expenditures are expected to have risen 3.0% (compared to 5.8% in 2021) due to lower utilization growth, especially for hospital services.
And for the 3 major recipient/payee categories:
Hospitals: Over 2022-2031, hospital spending growth is expected to average 5.8% annually. In 2023, faster growth in hospital utilization rates and accelerating growth in hospital prices (related to economy wide inflation and rising labor costs) are expected to lead to faster hospital spending growth of 9.3%. For 2025-2031, hospital spending trends are expected to normalize (with projected average annual growth of 6.1%) as there is a transition away from pandemic public health emergency funding impacts on spending.
Physicians and Clinical Services: Growth in physician and clinical services spending is projected to average 5.3% over 2022-2031. An expected deceleration in growth in 2022, to 2.4% from 5.6% in 2021, reflects slowing growth in the use of services following the pandemic-driven rebound in use in 2021. For 2025-2031, average spending growth for physician and clinical services is projected to be 5.7%, with an expectation that average Medicare spending growth (8.1%) for these services will exceed that of average Private Health Insurance growth (4.6%) partly as a result of comparatively faster growth in Medicare enrollment.
Prescription Drugs: Total expenditures for retail prescription drugs are projected to grow at an average annual rate of 4.6% over 2022-2031. For 2025-2031, total spending growth on prescription drugs is projected to average 4.8%, reflecting the net effects of key IRA provisions: Part D benefit enhancements (putting upward pressure on Medicare spending growth) and price negotiations/inflation rebates (putting downward pressure on Medicare and out-of-pocket spending growth).
Thus, CMS Actuaries believe spending for healthcare will be considerably higher than the growth of the overall economy (GDP) and inflation and become 19.6% of the total US economy in 2031. And it also projects that the economy will absorb annual spending increases for hospitals (5.8%) physician and clinical services (5.3%) and prescription drugs (4.6%).
My take:
Side-by-side, these reports present a curious projection for the U.S. economy through 2031: the overall economy will return to a slightly lower-level pre-pandemic normalcy and the healthcare industry will play a bigger role despite pushback from budget hawks preferring lower government spending and employers and consumers frustrated by high health prices today.
They also point to two obvious near-term problems:
1-The Federal Reserve pays inadequate attention to the healthcare economy. In Chairman Powell’s press conference following release of the FOMC report, there was no comment relating healthcare demand or spending to the broader economy nor a question from any of the 20 press corps relating healthcare to the overall economy. In his opening statement (below), Chairman Powell reiterated the Fed’s focus on prices and called out food, housing and transportation specifically but no mention of healthcare prices and costs which are equivalent or more stressful to household financial security:
“Good afternoon. My colleagues and I remain squarely focused on our dual mandate to promote maximum employment and stable prices for the American people…My colleagues and I are acutely aware that high inflation imposes hardship as it erodes purchasing power, especially for those least able to meet the higher costs of essentials like food, housing, and transportation. We are highly attentive to the risks that high inflation poses to both sides of our mandate, and we are strongly committed to returning inflation to our 2% objective.”
2-Congress is reticent to make substantive changes in Medicare and other healthcare programs despite its significance in the U.S. economy. It’s politically risky. In the June 2 Congressional standoff to lift the $31.4 debt ceiling, cuts to Medicare and Social Security were specifically EXCLUDED. Medicare is 12% of mandated spending in the 2022 federal budget and is expected to grow from a rate of 4.8% in 2022 to 8% in 2023—good news for investors in Medicare Advantage but concerning to consumers and employers facing higher prices as a result.
Even simplifying the Medicare program to replace its complicated Parts A, B, C, and D programs or addressing over-payments to Medicare Advantage plans (in 2022, $25 billion per MedPAC and $75 billion per USC) is politically tricky. It’s safer for elected officials to support price transparency (hospitals, drugs & insurers) and espouse replacing fee for service payments with “value” than step back and address the bigger issue: how should the health system be structured and financed to achieve lower costs and better health…not just for seniors or other groups but everyone.
These two realities contribute to the disconnect between the Fed and CMS. Looking back 20 years across 4 Presidencies, two economic downturns and the pandemic, it’s also clear the health economy’s emergence did not occur overnight as the Fed navigated its monetary policy. Consider:
National health expenditures were $1.366 trillion (13.3% of GDP) in 2000 and $4.255 billion in 2021 (18.3% of the GDP). This represents 210% increase in nominal spending and a 37.5% increase in the relative percentage of the nation’s GDP devoted to healthcare. No other sector in the economy has increased as much.
In the same period, the population increased 17% from 282 million to 334 million while per capita healthcare spending increased 166% from $4,845 to $12,914. This disproportionate disconnect between population and health spending growth is attributed by economists to escalating unit costs increases for the pills, facilities, technologies and specialty-provider services we use—their underlying cost escalation notably higher than other industries.
There were notable changes in where dollars were spent: hospitals were unchanged (from $415 billion/30.4% of total spending to $1.323 trillion/31.4% of total spending), physician services shrank (from $288.2 billion/21.1% of total spending to 664.6 billion/15.6% pf total spending), prescription drugs were unchanged (from $122.3 billion/8.95% to $378 billion/8.88% of total spending) and public health increased slightly (from $43 billion/$3.2% of total spending to $187.6 billion/4.4% of total spending).
And striking differences in sources of funding: out of pocket spending shrank from $193.6/14.2% of payments to $433 billion/10.2% % of payments; private insurance shrank from $441 billion/32.3% of payments to $1.21 trillion/28.4% of total payments; Medicare grew from $224.8 billion/16.5% of payments to $900.8 billion/21.2% of payments; Medicaid + CHIP grew from $203.4 billion/14.9% to $756.2 billion/17.8% of payments; and Veterans Health grew from $19.1 billion/1.4% of payments to $106.0 billion/2.5% of payments.
Thus, if these trends continue…
Aggregate payments to providers from government programs will play a bigger role and payments from privately insured individuals and companies will play a lesser role.
Hospital price increases will exceed price increases for physician services and prescription drugs.
Spending for healthcare will (continue to) exceed overall economic growth requiring additional funding from taxpayers, employers and consumers AND/OR increased dependence on private investments that require shareholder return AND/OR a massive restructure of the entire system to address its structure and financing.
What’s clear from these reports is the enormity of the health economy today and tomorrow, the lack of adequate attention and Congressional Action to address its sustainability and the range of unintended, negative consequences on households and every other industry if left unattended. It’s illustrative of the disconnect between the Fed and CMS: one assumes it controls the money supply while delegating to the other spending and policies independent of broader societal issues and concerns.
The health economy needs fresh attention from inside and outside the industry. Its impact includes not only the wellbeing of its workforce and services provided its users. It includes its direct impact on household financial security, community health and the economic potential of other industries who get less because healthcare gets more.
Securing the long-term sustainability of the U.S. economy and its role in world affairs cannot be appropriately addressed unless its health economy is more directly integrated and scrutinized. That might be uncomfortable for insiders but necessary for the greater good. Recognition of the disconnect between the Fed and CMS is a start!
Congressional Republicans and the White House reached a deal over the weekend to raise the debt ceiling that includes healthcare wins for both sides of the aisle, creating a path forward to prevent economic upheaval roughly a week before a potential federal default.
The 99-page agreement released Sunday to suspend the debt ceiling until January 2025 doesn’t include Medicaid work requirements, a key priority for the White House, but it does claw back billions of unspent COVID-19 relief funds.
The bill, which already faces opposition from some hard-right Republicans, could still be halted in Congress. The government could run out of money to meet its payment obligations as early as Monday without a debt ceiling increase, according to the Treasury Department, with a default threatening Medicare and Medicaid reimbursements to states and providers.
What’s in the agreement
The deal claws back roughly $30 billion in unspent pandemic relief fundsfrom dozens of programs under the CMS, National Institutes of Health and Centers for Disease Control and Prevention, among other agencies.
However, the White House did retain money for some COVID priorities. The Biden administration will retain about $5 billion to develop coronavirus vaccines and treatments in Project NextGen, and to cover the cost of those therapies for uninsured people, according to The New York Times.
The deal leaves healthcare-related federal entitlement programs mostly untouched, a key win touted by the White House in its messaging to Democrats. Despite being targeted by Republicans during negotiations, Medicare, Medicaid and the Inflation Reduction Act emerged unscathed.
Medicaid was particularly at risk. Though the final agreement excludes Medicaid work requirements, last month Republicans in the House passed a debt ceiling bill that would have included the controversial policy. Those requirements would have resulted in an estimated 600,000 people being booted from the safety-net insurance coverage, according to the Congressional Budget Office.
“One thing this budget deal suggests: Democrats won’t go along with Republican proposals to cut or impose restrictions on Medicaid,” tweeted Larry Levitt, executive vice president of health policy at the Kaiser Family Foundation.
If passed, however, the deal would enact work rules for people receiving federal food stamps and those on the family welfare benefits program. Veterans and homeless people would be exempt from food stamp work requirements.
Those provisions put food assistance at risk for very low-income older adults, and “will increase hunger and poverty among that group,” nonpartisan think tank the Center on Budget and Policy Priorities said in a statement on the bill.
The agreement also increases funding for the Cost of War Toxic Exposures Fund, created by bipartisan legislation last summer that expanded healthcare and disability benefits for veterans exposed to toxic burn pits.
The House Rules Committee, which includes a number of critics of House Speaker Kevin McCarthy, R-Calif., who spearhead the negotiations for Republicans, will discuss the legislation Tuesday afternoon.
A full House vote on the bill could come as soon as Wednesday. Senate Majority Leader Chuck Schumer, D-N.Y., has said the Senate will immediately move to consider the bill once it leaves the House.
Tomorrow, America’s Physician Groups (APG) will kick-off its Annual Spring Conference “Going the Distance” in San Diego with breakout sessions focused on wide ranging operational issues and 3 general sessions that address restoring trust in the profession, lessons from the pandemic and Medicare Advantage.
Next Thursday, the American Medical Association (AMA) will kick off its 5-day House of Delegates session in Chicago with a plethora of resolutions and votes on the docket and committee reports on issues like the ethical impact of private equity on physicians in private equity owned practices, health insurer payment integrity and much more.
These meetings are coincident with the expected resolution of the debt-ceiling dispute in Congress which essentially leaves current Medicare and Medicaid payments to physicians and others in tact through 2025. So, for at least the time being, surprises in insurer payments to physicians are not anticipated.
Nonetheless, it’s a critical time for APG and AMA as their members face unparalleled market pressures:
Trust in the profession has eroded. Media attention to its bad actors has expanded.
Settings have changed: the majority now work as employees of large groups owned by hospitals or private equity sponsors.
Consumer (patient) expectations about physician quality, access and service are more exacting.
Technologies that improve precision in diagnostics and therapies and integration of social determinants in care planning have altered where, how and by whom care is delivered.
Affordability and lack of price transparency are fundamental concerns for U.S. consumers (and voters), employers and Congress. While drug PBMs, hospitals and health insurers are a focus of attention, physicians are not far behind.
Private equity and retail giants are creatine formidable competition in primary and specialty care.
Media coverage of “bad actors” engaged in fraudulent activity (i.e. unnecessary care, medications, et al) has increased.
Operating losses in hospitals remain significant limiting hospital investments in their employed medical practices.
Both organizations remain steadfast in the belief that the future for U.S. healthcare is physician centric:
For APG, it’s anchored in a core belief that changing payer incentives from fee-for-service to value is the essential means toward the system’s long-term sustainability and effectiveness. (APG represents 335 physician organizations)
For AMA, “true north” is the profession’s designated role as caregivers and stewards of the public’s health and wellbeing. (AMA’s membership includes 22% of the nation’s 1.34 million practicing physicians, medical students and residents).
But market conditions have taken their toll on physician psyche even as CMS has altered its value agenda.
Physicians are highly paid professionals. Per Sullivan Cotter and Kaufman Hall, their finances took a hit during the pandemic and their finances in 2022-2023 has been stymied by inflationary pressures. Thus, most worry about their income and they’re hyper-sensitive to critics of their compensation.
Fueling their frustration, virtually all believe insurance companies are reimbursement bullies, hospitals spend too much on executive salaries (aka suits) and administration and not enough on patient care and patients are increasingly difficult and unreasonable. Most think the profession hasn’t done enough to protect them and 65% say they’re burned out. That’s where APG and AMA find themselves relative to their members.
My take:
The backdrop for the APG and AMA meetings in the next 2 weeks could not be more daunting. Inflationary pressures dog the health economy as each advances an advocacy agenda suitable to their member’s needs.
But something is missing: a comprehensive, coherent, visionary view of the health system’s future in the next 10-20 years wherein physicians will play a key role.
That view should include…
How value and affordability are defined and actualized in policies and practice.
How the caregiver workforce is developed, composed and evaluated based on shifting demand.
How incentives should be set and funding sourced and rationalized across all settings and circumstances of service.
How consumerism can be operationalized.
How prices and costs in every sector (including physician services) can become readily accessible.
How a seamless system of health can be built.
How physician training and performance can be modernized to participate effectively in the system’s future.
The U.S. health system’s future is not a repeat of its past. Recognizing this, physicians and the professional associations like APG and AMA that serve them have an obligation to define its future state NOW.
Some physicians are on the brink of despair; others are at the starting line ready to take on the challenge.
A lack of data about Medicare Advantage plans means there are several unanswered questions about the program, according to an analysis from Kaiser Family Foundation.
The analysis, published April 25, breaks down the kinds of Medicare Advantage data not publicly available. Some missing data is not collected from insurers by CMS, and some data is collected by the agency but not available to the public.
Here are five questions researchers can’t answer without more data, according to Kaiser Family Foundation:
Insurers are not required to report how many enrollees use supplemental benefits and if members incur out-of-pocket costs with their supplemental benefits. Without this data, researchers can’t answer what share of enrollees use their supplemental benefits, how much members spend out of pocket for supplemental benefits, and if these benefits are working to achieve better health outcomes.
CMS does not require Medicare Advantage plans to report prior authorizations by type of service. Without more granular data, researchers can’t determine which services have the highest rates of denial and if prior authorization rates vary across insurers and plans.
Insurers are also not required to report the reasons for prior authorization denials to CMS. This leaves unanswered questions, including what is the most common reason for denials and if rates of denials vary across demographics.
Medicare Advantage plans do not report complete data on denied claims for services already provided. Without this data, researchers cannot determine how often payers deny claims for Medicare-covered services and reasons why these claims are denied.
CMS does not publish the names of employers or unions that receive Medicare funds to provide Medicare Advantage plans to retired employees. Without more data, researchers can’t tell which industries use Medicare Advantage most often and how rebates vary across employers.