6 priorities for health system strategists in 2024

Health systems are recovering from the worst financial year in recent history. We surveyed strategic planners to find out their top priorities for 2024 and where they are focusing their energy to achieve growth and sustainability. Read on to explore the top six findings from this year’s survey.

Research questions

With this survey, we sought the answers to five key questions:

  1. How do health system margins, volumes, capital spending, and FTEs compare to 2022 levels?
  2. How will rebounding demand impact financial performance? 
  3. How will strategic priorities change in 2024?
  4. How will capital spending priorities change next year?

Bigger is Better for Financial Recovery

What did we find?

Hospitals are beginning to recover from the lowest financial points of 2022, where they experienced persistently negative operating margins. In 2023, the majority of respondents to our survey expected positive changes in operating margins, total margins, and capital spending. However, less than half of the sample expected increases in full-time employee (FTE) count. Even as many organizations reported progress in 2023, challenges to workforce recovery persisted.

40%

Of respondents are experiencing margins below 2022 levels

Importantly, the sample was relatively split between those who are improving financial performance and those who aren’t. While 53% of respondents projected a positive change to operating margins in 2023, 40% expected negative changes to margin.

One exception to this split is large health systems. Large health systems projected above-average recovery of FTE counts, volume, and operating margins. This will give them a higher-than-average capital spending budget.

Why does this matter?

These findings echo an industry-wide consensus on improved financial performance in 2023. However, zooming in on the data revealed that the rising tide isn’t lifting all boats. Unequal financial recovery, especially between large and small health systems, can impact the balance of independent, community, and smaller providers in a market in a few ways. Big organizations can get bigger by leveraging their financial position to acquire less resourced health systems, hospitals, or provider groups. This can be a lifeline for some providers if the larger organization has the resources to keep services running. But it can be a critical threat to other providers that cannot keep up with the increasing scale of competitors.

Variation in financial performance can also exacerbate existing inequities by widening gaps in access. A key stakeholder here is rural providers. Rural providers are particularly vulnerable to financial pressures and have faced higher rates of closure than urban hospitals. Closures and consolidation among these providers will widen healthcare deserts. Closures also have the potential to alter payer and case mix (and pressure capacity) at nearby hospitals.

Volumes are decoupled from margins

What did we find?

Positive changes to FTE counts, reduced contract labor costs, and returning demand led the majority of respondents in our survey to project organizational-wide volume growth in 2023. However, a significant portion of the sample is not successfully translating volume growth to margin recovery.

44%

Of respondents who project volume increases also predict declining margins

On one hand, 84% of our sample expected to achieve volume growth in 2023. And 38% of respondents expected 2023 volume to exceed 2022 volume by over 5%. But only 53% of respondents expected their 2023 operating margins to grow — and most of those expected that the growth would be under 5%. Over 40% of respondents that reported increases in volume simultaneously projected declining margins.

Why does this matter?

Health systems struggled to generate sufficient revenue during the pandemic because of reduced demand for profitable elective procedures. It is troubling that despite significant projected returns to inpatient and outpatient volumes, these volumes are failing to pull their weight in margin contribution. This is happening in the backdrop of continued outpatient migration that is placing downward pressure on profitable inpatient volumes.

There are a variety of factors contributing to this phenomenon. Significant inflationary pressures on supplies and drugs have driven up the cost of providing care. Delays in patient discharge to post-acute settings further exacerbate this issue, despite shrinking contract labor costs. Reimbursements have not yet caught up to these costs, and several systems report facing increased denials and delays in reimbursement for care. However, there are also internal factors to consider. Strategists from our study believe there are outsized opportunities to make improvements in clinical operational efficiency — especially in care variation reduction, operating room scheduling, and inpatient management for complex patients.

Strategists look to technology to stretch capital budgets

What did we find?

Capital budgets will improve in 2024, albeit modestly. Sixty-three percent of respondents expect to increase expenditures, but only a quarter anticipate an increase of 6% or more. With smaller budget increases, only some priorities will get funded, and strategists will have to pick and choose.

Respondents were consistent on their top priority. Investments in IT and digital health remained the number one priority in both 2022 and 2023. Other priorities shifted. Spending on areas core to operations, like facility maintenance and medical equipment, increased in importance. Interest in funding for new ambulatory facilities saw the biggest change, falling down two places.

Why does this matter?

Capital budgets for health systems may be increasing, but not enough. With the high cost of borrowing and continued uncertainty, health systems still face a constrained environment. Strategists are looking to get the biggest bang for their buck. Technology investments are a way to do that. Digital solutions promise high impact without the expense or risk of other moves, like building new facilities, which is why strategists continue to prioritize spending on technology.

The value proposition of investing in technology has changed with recent advances in artificial intelligence (AI), and our respondents expressed a high level of interest in AI solutions. New applications of AI in healthcare offer greater efficiencies across workforce, clinical and administrative operations, and patient engagement — all areas of key concern for any health system today.

Building is reserved for those with the largest budgets

What did we find?

Another way to stretch capital budgets is investing in facility improvements rather than new buildings. This allows health systems to minimize investment size and risk. Our survey found that, in general, strategists are prioritizing capital spending on repairs and renovation while deprioritizing building new ambulatory facilities.

When the responses to our survey are broken out by organization type, a different story emerges. The largest health systems are spending in ways other systems are not. Systems with six or more hospitals are increasing their overall capital expenditures and are planning to invest in new facilities. In contrast, other systems are not increasing their overall budgets and decreasing investments in new facilities.

AMCs are the only exception. While they are decreasing their overall budget, they are increasing their spending on new inpatient facilities.

Why does this matter?

Health systems seek to attract patients with new facilities — but only the biggest systems can invest in building outpatient and inpatient facilities. The high ranking of repairs in overall capital expenditure priorities suggests that all systems are trying to compete by maintaining or improving their current facilities. Will renovations be enough in the face of expanded building from better financed systems? The urgency to respond to the pandemic-accelerated outpatient shift means that building decisions made today, especially in outpatient facilities, could affect competition for years to come. And our survey responses suggest that only the largest health system will get the important first-mover advantage in this space.

AMCs are taking a different tack in the face of tight budgets and increased competition. Instead of trying to compete across the board, AMCs are marshaling resources for redeployment toward inpatient facilities. This aligns with their core identity as a higher acuity and specialty care providers.

Partnerships and affiliations offer potential solutions for health systems that lack the resources for building new facilities. Health systems use partnerships to trade volumes based on complexity. Partnerships can help some health systems to protect local volumes while still offering appropriate acute care at their partner organization. In addition, partnerships help health systems capture more of the patient journey through shared referrals. In both of these cases, partnerships or affiliations mitigate the need to build new inpatient or outpatient facilities to keep patients.

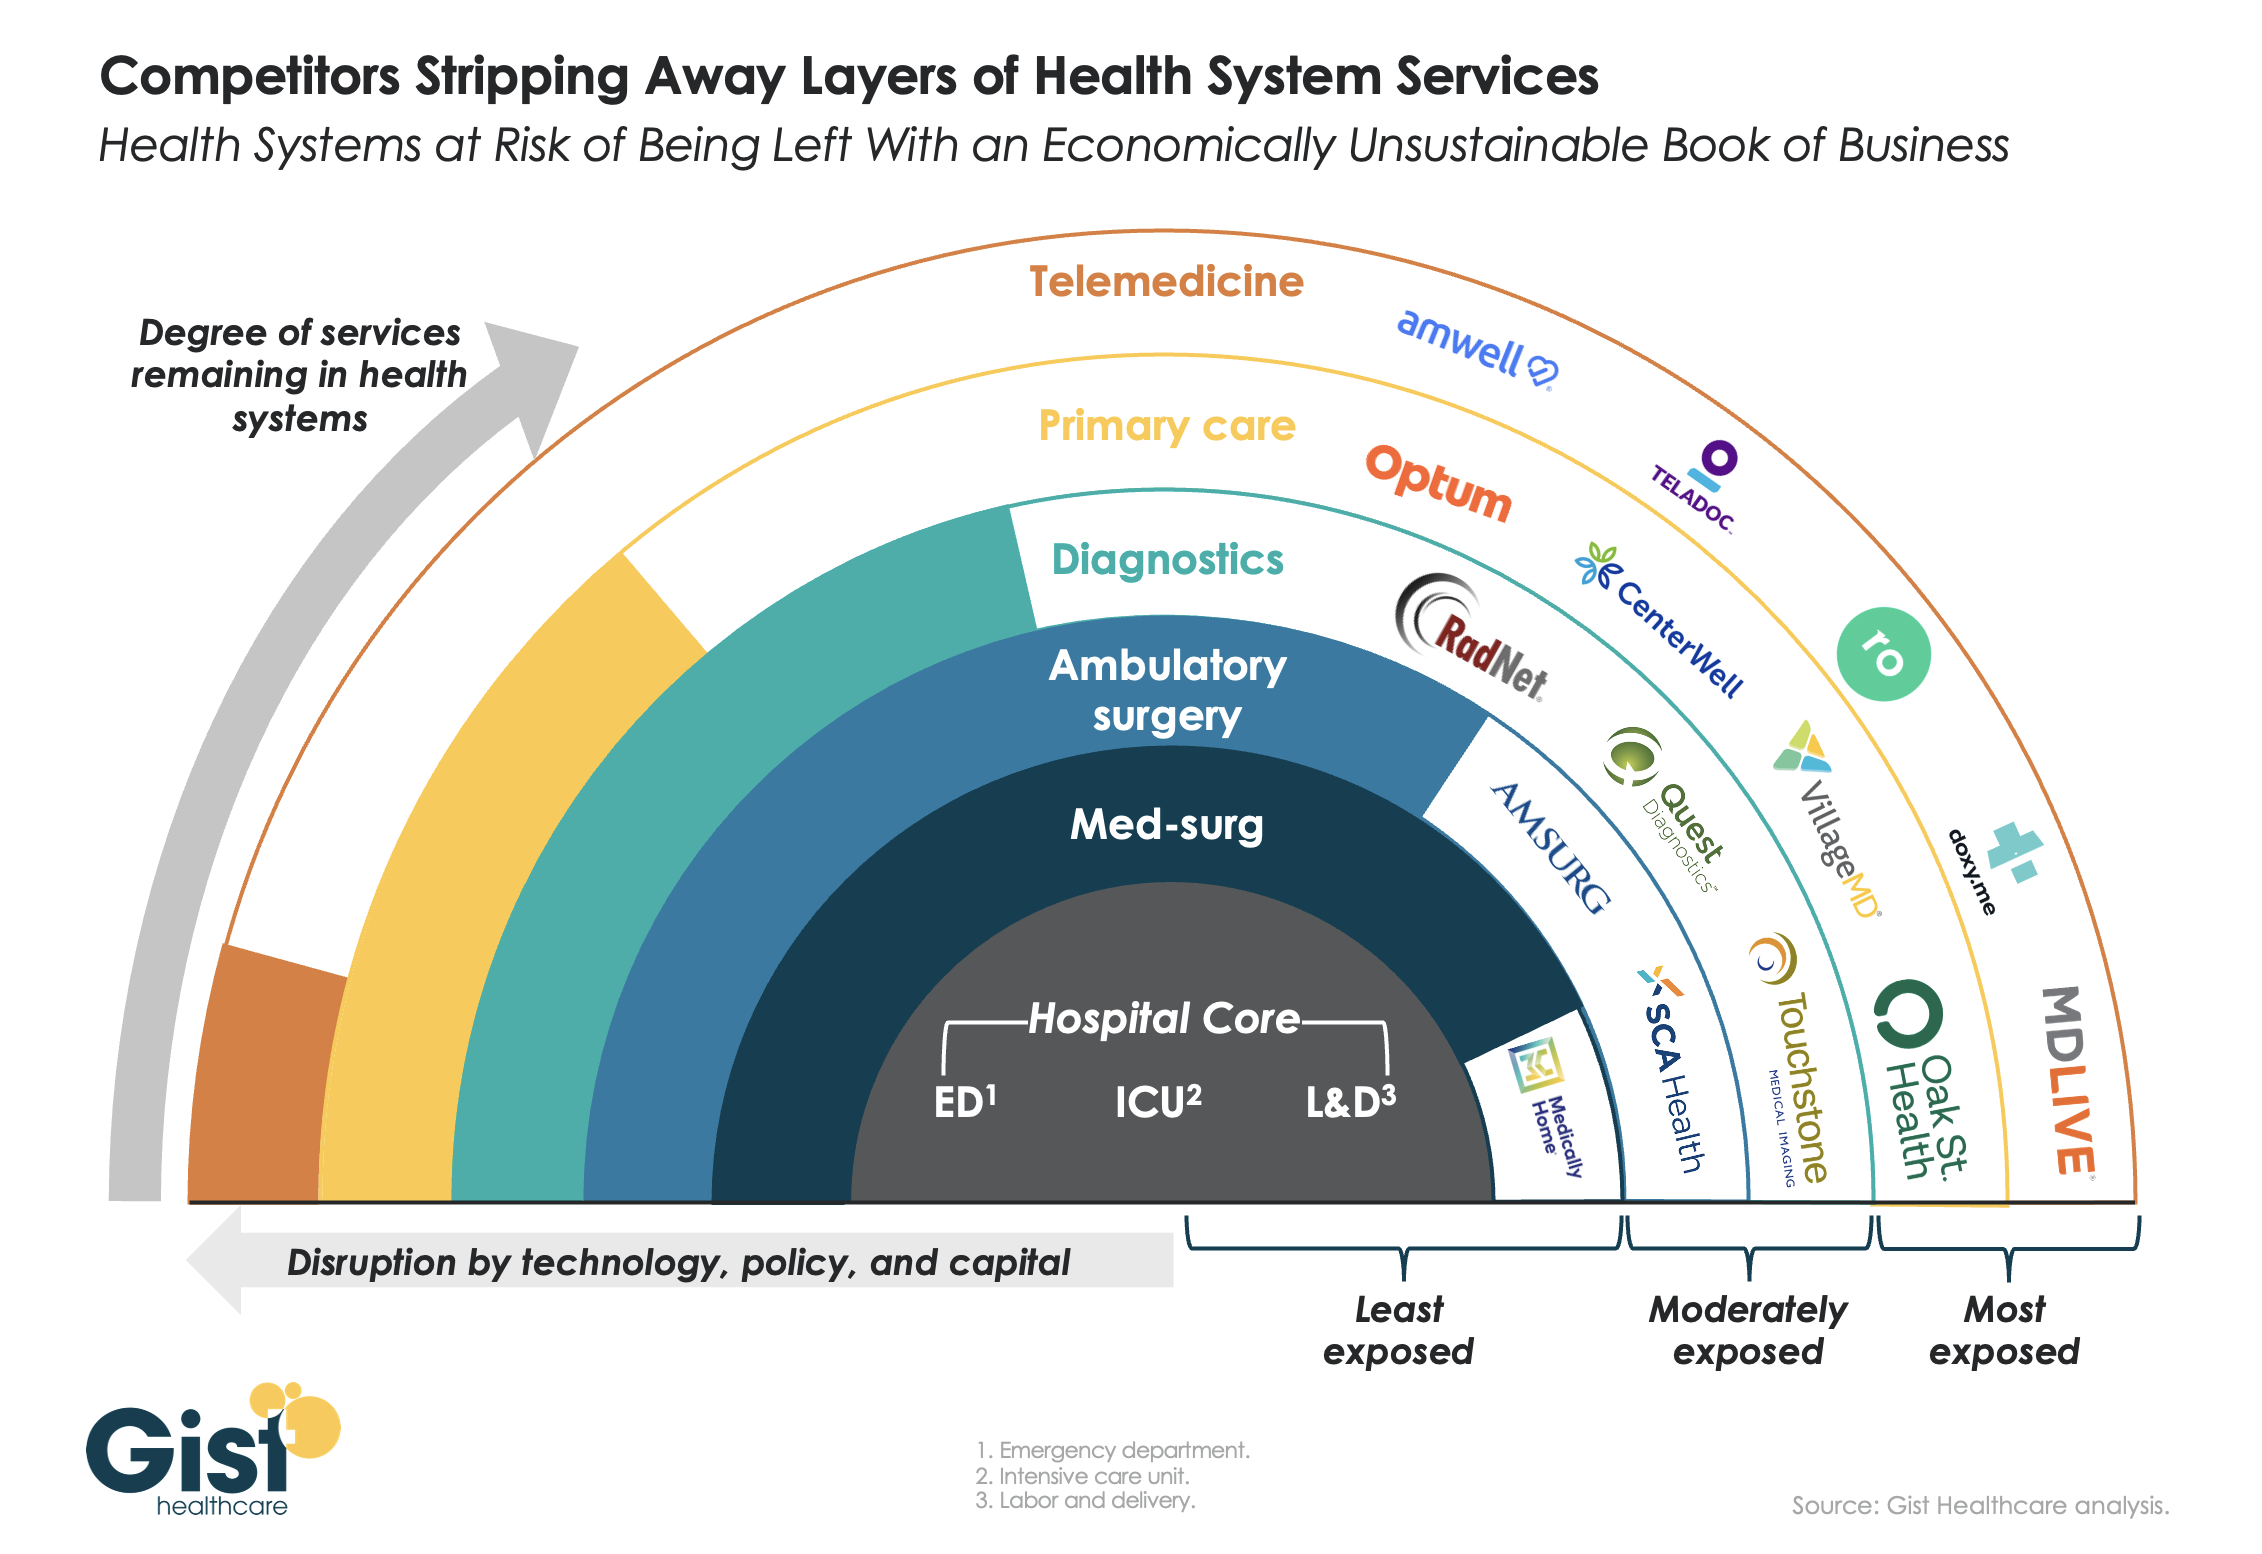
Revenue diversification tactics decline despite disruption

What did we find?

Eighty percent of respondents to our survey continued to lose patient volumes in 2023. Despite this threat to traditional revenue, health systems are turning from revenue diversification practices. Respondents were less likely to operate an innovation center or invest in early-stage companies in 2023. Strategists also reported notably less participation in downside risk arrangements, with a 27% decline from 2022 to 2023.

Why does this matter?

The retreat from revenue diversification and risk arrangements suggests that health systems have little appetite for financial uncertainty. Health systems are focusing on financial stabilization in the short term and forgoing practices that could benefit them, and their patients, in the long term.

Strategists should be cautious of this approach. Retrenchment on innovation and value-based care will hold health systems back as they confront ongoing disruption. New models of care, patient engagement, and payment will be necessary to stabilize operations and finances. Turning from these programs to save money now risks costing health systems in the future.

Market intelligence and strategic planning are essential for health systems as they navigate these decisions. Holding back on initiatives or pursuing them in resource-constrained environments is easier when you have a clear course for the future and can limit reactionary cuts.

Advisory Board’s long-standing research on developing strategy suggests five principles for focused strategy development:
 

  1. Strategic plans should confront complexity. Sift through potential future market disruptions and opportunities to establish a handful of governing market assumptions to guide strategy.
  2. Ground strategy development in answers to a handful of questions regarding future competitive advantage. Ask yourself: What will it take to become the provider of choice?
  3. Communicate overarching strategy with a clear, coherent statement that communicates your overall health system identity.
  4. A strategic vision should be supported by a limited number of directly relevant priorities. Resist the temptation to fill out “pro forma” strategic plan.
  5. Pair strategic priorities with detailed execution plans, including initiative roadmaps and clear lines of accountability.

Strategists align on a strategic vision to go back to basics

What did we find?

Despite uneven recovery, health systems widely agree on which strategic initiatives they will focus more on, and which they will focus less on. Health system leaders are focusing their attention on core operations — margins, quality, and workforce — the basics of system success. They aim to achieve this mandate in three ways. First, through improving efficiency in care delivery and supply chain. Second, by transforming key elements of the care delivery system. And lastly, through leveraging technology and the virtual environment to expand job flexibility and reduce administrative burden.

Health systems in our survey are least likely to take drastic steps like cutting pay or expensive steps like making acquisitions. But they’re also not looking to downsize; divesting and merging is off the table for most organizations going into 2024.

Why does this matter?

The strategic priorities healthcare leaders are working toward are necessary but certainly not easy. These priorities reflect the key challenges for a health system — margins, quality, and workforce. Luckily, most of strategists’ top priorities hold promise for addressing all three areas.

This triple mandate of improving margins, quality, and workforce seems simple in theory but is hard to get right in practice. Integrating all three core dimensions into the rollout of a strategic initiative will amplify that initiative’s success. But, neglecting one dimension can diminish returns. For example, focusing on operational efficiency to increase margins is important, but it’ll be even more effective if efforts also seek to improve quality. It may be less effective if you fail to consider clinicians’ workflow.

Health systems that can return to the basics, and master them, are setting a strong foundation for future growth. This growth will be much more difficult to attain without getting your house in order first.

Vendors and other health system partners should understand that systems are looking to ace the basics, not reinvent the wheel. Vendors should ensure their products have a clear and provable return on investment and can map to health systems’ strategic priorities. Some key solutions health systems will be looking for to meet these priorities are enhanced, easy-to-follow data tools for clinical operations, supply chain and logistics, and quality. Health systems will also be interested in tools that easily integrate into provider workflow, like SDOH screening and resources or ambient listening scribes.

Going back to basics

Craft your strategy

1. Rebuild your workforce.

One important link to recovery of volume is FTE count. Systems that expect positive changes in FTEs overwhelmingly project positive changes in volume. But, on average, less than half of systems expected FTE growth in 2023. Meanwhile, high turnover, churn, and early retirement has contributed to poor care team communication and a growing experience-complexity gap. Prioritize rebuilding your workforce with these steps:

  • Recover: Ensure staff recover from pandemic-era experiences by investing in workforce well-being. Audit existing wellness initiatives to maximize programs that work well, and rethink those that aren’t heavily utilized.
  • Recruit: Compete by addressing what the next generation of clinicians want from employment: autonomy, flexibility, benefits, and diversity, equity, and inclusion (DEI). Keep up to date with workforce trends for key roles such as advance practice providers, nurses, and physicians in your market to avoid blind spots.
  • Retain: Support young and entry-level staff early and often while ensuring tenured staff feel valued and are given priority access to new workforce arrangements like hybrid and gig work. Utilize virtual inpatient nurses and virtual hubs to maintain experienced staff who may otherwise retire. Prioritize technologies that reduce the burden on staff, rather than creating another box to check, like ambient listening or asynchronous questionnaires.

2. Become the provider of choice with patient-centric care.

Becoming the provider of choice is crucial not only for returning to financial stability, but also for sustained growth. To become the provider of choice in 2024, systems must address faltering consumer perspectives with a patient-centric approach. Keep in mind that our first set of recommendations around workforce recovery are precursors to improving patient-centered care. Here are two key areas to focus on:

  • Front door: Ensure a multimodal front door strategy. This could be accomplished through partnership or ownership but should include assets like urgent care/extended hour appointments, community education and engagement, and a good digital experience.
  • Social determinants of health: A key aspect of patient-centered care is addressing the social needs of patients. Our survey found that addressing SDOH was the second highest strategic priority in 2023. Set up a plan to integrate SDOH screenings early on in patient contact. Then, work with local organizations and/or build out key services within your system to address social needs that appear most frequently in your population. Finally, your workforce DEI strategy should focus on diversity in clinical and leadership staff, as well as teaching clinicians how to practice with cultural humility.

3. Recouple volume and margins.

The increasingly decoupled relationship between volume and margins should be a concern for all strategists. There are three parts to improving volume related margins: increasing volume for high-revenue procedures, managing costs, and improving clinical operational efficiency.

  • Revenue growth: Craft a response to out-of-market travel for surgery. In many markets, the pool of lucrative inpatient surgical volumes is shrinking. Health systems are looking to new markets to attract patients who are willing to travel for greater access and quality. Read our findings to learn more about what you need to attract and/or defend patient volumes from out-of-market travel. 
  • Cost reduction: Although there are many paths health systems can take to manage costs, focusing on tactics which are the most likely to result in fast returns and higher, more sustainable savings, will be key. Some tactics health systems can deploy include preventing unnecessary surgical supply waste, making employees accountable for their health costs, and reinforcing nurse-led sepsis protocols.
  • Clinical operational efficiency: The number one strategic priority in 2023, according to our survey, was clinical operational efficiency, no doubt in response to faltering margins. Within this area, the top place for improvement was care variation reduction (CVR). Ensure you’re making the most out of CVR efforts by effectively prioritizing where to spend your time. Improve operational efficiency outside of CVR by improving OR efficiency and developing protocols for complex inpatient management. 

From -10.6% to 11.1%: 34 systems ranked by operating margins

Hospitals began 2023 with a median operating margin of -0.9%, but that figure has increased steadily month over month to hit 2% in November — the ninth consecutive month of positive margins. Despite a modest positive turning point for some hospitals and health systems this year, Fitch Ratings projects 2024 to be another “make or break” year for a significant portion of the sector.

Editor’s note: Operating margins are based on health systems’ most recent financial documents and vary by reporting periods, such as the three months ending Sept. 30, the nine months ending Sept. 30 and the 12 months ending Sept. 30.

1. Tenet Healthcare (Dallas)
*For the three months ending Sept 30

Revenue: $5.1 billion
Expenses: $4.99 billion
Operating income/loss: $568 million
Operating margin: 11.1%

2. HCA Healthcare (Nashville, Tenn.)
*For the three months ending Sept 30

Revenue: $16.21 billion
Expenses: $14.58 billion
Operating income/loss: $1.63 billion
Operating margin: 10.1%

3. Universal Health Services (King of Prussia, Pa.)
For the three months ending Sept. 30 

Revenue: $3.6 billion
Expenses: $3.3 billion
Operating income/loss: $285.4 million
Operating margin: 7.9%

4. Mayo Clinic (Rochester, Minn.)
*For the three months ending Sept 30

Revenue: $4.5 billion
Expenses: $4.2 billion 
Operating income/loss: $302 million
Operating margin: 6.7%

5. Stanford Health Care (Palo Alto, Calif.)
*For the 12 months ending Aug. 31

Revenue: $7.87 billion
Expenses: $7.46 billion
Operating income/loss: $414.9 million 
Operating margin: 5.3%

6. Community Health Systems (Franklin, Tenn.)
*For the three months ending Sept 30

Revenue: $3.09 billion
Expenses: $2.91 billion
Operating income/loss: $173 million
Operating margin: 5.6%

7. Christus Health (Irving, Texas) 
*For the 12 months ending June 30 

Revenue: $7.8 billion
Expenses: $7.5 billion
Operating income/loss: $324.5 million
Operating margin: 4.2%

8. Northwestern Medicine (Chicago) 
*For the 12 months ending Sept. 30

Revenue: $8.7 billion
Expenses: $8.4 billion
Operating income/loss: $352.3 million
Operating margin: 4.1%

9. IU Health (Indianapolis)
*For the three months ending Sept 30

Revenue: $2.12 billion
Expenses: $2.06 billion
Operating income/loss: $59.6 million
Operating margin: 2.8%

10. Sanford Health (Sioux Falls, S.D.)
*For the nine months ending Sept. 30

Revenue: $5.39 billion
Expenses: $5.27 billion
Operating income/loss: $123.2 million
Operating margin: 2.3%

11. BJC HealthCare (St. Louis)
*For the nine months ending Sept. 30

Revenue: $5.17 billion
Expenses: $5.06 billion
Operating income/loss: $113.2 million
Operating margin: 2.2%

12. Vanderbilt University Medical Center (Nashville, Tenn.)
*For the three months ending Sept 30

Revenue: $1.8 billion
Expenses: $1.77 billion
Operating income/loss: $28 million
Operating margin: 1.6%

13. Banner Health (Phoenix)
*For the nine months ending Sept. 30

Revenue: $10.3 billion
Expenses: $10.2 billion
Operating income/loss: $149.4 million
Operating margin: 1.5%

14. Intermountain Health (Salt Lake City)
*For the nine months ending Sept. 30

Revenue: $11.9 billion
Expenses: $11.2 billion
Operating income/loss: $157 million
Operating margin: 1.3%

15. Prisma Health (Greenville, S.C.)*For the 12 months ending Sept. 30

Revenue: $6 billion
Expenses: $5.9 billion
Operating income/loss: $67.1 million
Operating margin: 1.1%

16. Kaiser Permanente (Oakland, Calif.)
*For the three months ending Sept. 30 2023

Revenue: $24.9 billion
Expenses: $24.7 billion
Operating income/loss: $156 million
Operating margin: 0.6%

17. Advocate Health (Charlotte, N.C.)
*For the nine months ending Sept. 30

Revenue: $22.83 billion
Expenses: $22.75 billion
Operating income/loss: $79.4 million
Operating margin: 0.4%

18. Mercy (St. Louis-based)
*For the 12 months ending June 30 

Revenue: $8.02 billion
Expenses: $8.01 billion
Operating income/loss: $11.8 million
Operating margin: 0.1%

19. OSF HealthCare (Peoria, Ill.) 
*For the 12 months ending Sept. 30

Revenue: $4.1 billion
Expenses: $4.1 billion
Operating income/loss: $1.2 million
Operating margin: 0%

20. Northwell Health (New Hyde Park, N.Y.) 
*For the three months ending Sept. 30 

Revenue: $4.1 billion
Expenses: $4.2 billion
Operating income/loss: ($11.6 million)
Operating margin: (0.3%)

21. Mass General Brigham (Boston)
*For the 12 months ending Sept. 30

Revenue: $18.8 billion (includes $143 million revenue related to federal COVID-19 relief) 
Expenses: $18.7 billion
Operating income/loss: ($48 million)
Operating margin: (0.3% margin)

22. Cleveland Clinic
*For the three months ending Sept. 30 2023

Revenue: $3.6 billion
Expenses: $3.4 billion
Operating income/loss: ($14.9 million)
Operating margin: (0.4%)

23. Montefiore (New York City) 
*For the nine months ending Sept. 30

Revenue: $5.61 billion
Expenses: $5.64 billion
Operating income/loss: ($28.6 million)
Operating margin: (0.5%)

24. SSM Health (St. Louis)
*For the three months ending Sept 30

Revenue: $2.61 billion
Expenses: $2.63 billion
Operating income/loss: ($21.1 million) 
Operating margin: (0.8%)

25. UPMC (Pittsburgh)
*For the nine months ending Sept. 30

Revenue: $20.6 billion
Expenses: $20.8 billion
Operating income/loss: ($177 million)
Operating margin: (0.9%)

26. Scripps Health (San Diego) 
*For the 12 months ending Sept. 30

Revenue: $4.3 billion
Expenses: $4.3 billion
Operating income/loss: ($36.6 million)
Operating margin: (0.9%)

27. Trinity Health (Livona, Mich.) 
*For the three months ending Sept 30

Revenue: $5.6 billion
Expenses: $5.7 billion
Operating income/loss: ($58.6 million)
Operating margin: (1%)

28. UnityPoint Health (West Des Moines, Iowa)
*For the three months ending Sept 30

Revenue: $1.16 billion
Expenses: $1.18
Operating income/loss: ($16.4 million)
Operating margin: (1.4%)

29. Novant Health (Winston-Salem, N.C.) 
*For the three months ending Sept. 30

Revenue: $1.94 billion
Expenses: $1.97 billion
Operating income/loss: (28.6 million)
Operating margin: (1.5%)

30. Geisinger (Danville, Pa.)
*For the nine months ending Sept. 30

Revenue: $5.66 billion
Expenses: $5.76 billion
Operating income/loss: ($104.4 million)
Operating margin: (1.8%)

31. CommonSpirit (Chicago) 
*For the three months ending Sept. 30

Revenue: $8.58 billion
Expenses: $9.02 billion
*Adjusted operating income/loss: ($291 million)
Operating margin: (3.4%)

32. Tower Health (West Reading, Pa.)
*For the three months ending Sept. 30 

Revenue: $457.4 million
Expenses: $476.5 million
Operating income/loss: $19.1 million
Operating margin: (4.2%)

33. Providence (Renton, Wash.) 
*For the three months ending Sept. 30

Revenue: $7.18 billion
Expenses: $7.49 billion
Operating income/loss: ($310 million)
Operating margin: (4.3%)

34. Ascension (St. Louis)
*For the 12 months ending June 30 

Revenue: $28.35 billion
Expenses: $29.9 billion
Operating income/loss: ($3 billion)
Operating margin: (10.6%)

Is the Medicare Advantage “gold rush” ending?

https://mailchi.mp/79ecc69aca80/the-weekly-gist-december-15-2023?e=d1e747d2d8

Published last week in the Wall Street Journal, this piece predicts that the era of immense profitability for Medicare Advantage (MA) insurers may be drawing to a close.

MA has experienced rapid growth over the past decade, due both to the pace of Baby Boomers aging into Medicare, and the increasing numbers of beneficiaries choosing MA plans. In 2023, MA surpassed 50 percent of total Medicare enrollment.

Payers readily embraced the MA market because they found they could earn gross margins two to three times higher than from a commercial life.

However, as the rate of enrollment growth begins to slow (the last of the Boomers will turn 65 in 2030), competition between payers increases, and government payments become less generous, the MA business—while still profitable—is poised to become less of a jackpot. 

The Gist: While MA has been an outsized driver of profits for insurance companies in recent years, the nation’s two largest MA payers, UnitedHealth Group (UHG) and Humana, have been signaling growing concerns to the market. 

UHG announced late last month that its 2024 MA enrollment growth will be less than half of its 2023 rate, and Humana has been engaged in merger talks with Cigna. 

As the “gold rush” period ends, MA payers will have to earn their keep by better integrating their various care and data assets, and more carefully managing spending for an aging cohort of seniors with increasingly complex needs, both much harder than riding a demographic wave to easy profits.

For-profit hospital operators strained by physician fees, payer relations in Q3

The nation’s largest for-profit hospital systems by revenue — HCA Healthcare, Community Health Systems, Tenet Healthcare and Universal Health Services — reported mixed results during the third quarter of 2023, despite announcing strong demand for patient services.

With the exception of HCA, each operator reported lower profits in the third quarter compared with the same period last year. Health systems CHS and HCA reported earnings that fell short of Wall Street expectations for revenue.

Major operators posted declining profits in the third quarter compared to the same period in 2022

Q3 net income in millions, by operator

Health SystemProfitPercent Change YOY
Community Health Systems$−91−117%
HCA Healthcare$1,80059%
Tenet Healthcare$101−23%
Universal Health Services$167−9%

Admissions rose across the board compared to the same period last year: Same facility equivalent admissions rose 4.1% at HCA , 3.7% at CHS and 0.6% at Tenet, and adjusted admissions at acute hospitals rose 6.8% at UHS. 

Although the for-profit operators began cost containment strategies earlier this year — recognizing that rising expenses, including costs of salary and wages, were pressuring hospital profitability post-pandemic — expenses also rose, with growth in salaries and benefit costs once again pressuring most operators’ revenue.

Hospital operators faced new challenges this quarter, executives said, including increased physician staffing fees and what hospital executives characterized as aggressive behavior from payers.

Hospitals highlight rising physician fees

Rising physician fees were a topic of concern on earnings calls this quarter, with executives reporting fees that were 15% to 40% higher compared with the same period last year.

Third-party staffing firms charge hospitals physician fees, a percentage of physicians’ salaries, on top of the salaries themselves. Physician fees are separate but related to contract labor costs, which plagued hospitals during the COVID-19 pandemic as they attempted to stem staffing shortages.

Hospitals typically contract specialty hospitalist roles — like anesthesiologists, radiologists and emergency department physicians — and incur associated staffing costs.

Physician fees at HCA, the country’s largest hospital chain, grew 20% year over year in the third quarter, according to CFO Bill Rutherford.

Physician fees were up by as much as 40% at UHS — making up 7.6% of total operating expenses this quarter and surpassing the company’s initial projections for the year, CEO Marc Miller said during an earnings call. Historically, physician fees accounted for about 6% of UHS’ total expenses.

Likewise, Franklin, Tennessee-based CHS attributed some of its third-quarter losses to “increased rates for outsourced medical specialists,” according to a release on the operator’s earnings.

Tenet CEO Saum Sutaria noted that physician fee expenses were up 15% year over year, but said on an earnings call that the operator had spied rising physician fees during the pandemic, and had begun efforts to contain costs — including restructuring staffing contracts and in-sourcing critical physician services.

As a result, physician fee costs at Tenet had remained “relatively flat” from the second quarter to the third quarter this year, according to the Sutaria.

Physician fee increases may be a delayed consequence of the No Surprises Act, which went into effect in January of last year, experts say.

On an earnings call, UHS CFO Steve Filton said “the industry has largely had to reset itself” in wake of the law. Tenet and CHS executives echoed the sentiment, noting that the law had disrupted staffing firms’ business models and complicated payment processes.

The No Surprises Act prevents patients who unknowingly receive out-of-network care at an in-network facility from being stuck with unexpected bills. However, the act has had unintended ripple effects, experts say.

Staffing firms and hospitals allege that the arbitration process created to resolve disputes between providers and insurers is unbalanced and incentivizes insurers to withhold reimbursement for care. In an August survey, over half of doctors reported insurers have either ignored decisions made by arbitrators or declined to pay claims in full.

In other cases, a backlog prevents claims from being adjudicated at all. Last year, the CMS found the federal arbitration process had only reached a payment determination in 15% of cases. Federal regulators have been forced to pause and restart the arbitration process multiple times in the wake of federal court decisions challenging arbitration methodology.

Although the act went into effect more than a year ago, many hospitals are just now feeling the strain, said Loren Adler, associate director at the Brookings Institute’s Schaeffer Initiative on Health Policy.

That’s because most insurers, hospitals and medical groups operate on three-year contracts, according to Adler. Staffing firms, which have struggled since the No Surprises Act was enacted, have passed on costs to hospitals as contracts come up for negotiation and insurers charge firms higher rates.

In the face of rising costs, some hospitals may opt to follow Tenet and CHS and in-source physicians — either to retain contracts with physicians who worked with firms that have folded or because the passing of the No Surprises Act makes outsourcing less attractive.

CHS hired 500 physicians from staffing firm American Physician Partners after the company collapsed in July. CFO Kevin Hammons said on an earnings call that hiring the physicians had saved CHS “approximately $4 million sequentially compared to the subsidy payments previously paid” to the staffing firm. 

However, in-sourcing may not be an effective cost containment strategy for all operators. HCA reported it was hemorrhaging money following its first-quarter majority stake purchase of staffing firm Valesco, which brought about 5,000 physicians onto its payroll. HCA CEO Sam Hazen said the system expects to lose $50 million per quarter on the venture through 2024, citing low payments as the primary issue.

Payer problems

Hospital executives also tied quarterly losses to aggressive behavior from insurers during third-quarter earnings calls.

UHS executives said payers were improperly denying high volumes of claims and disrupting payments to its hospitals, with UHS’ Miller characterizing insurers as “increasingly aggressive” during the third quarter. Though insurers had reduced their number of claims audits, denials and patient status changes during the early stages of the pandemic, payers were increasing denials and reviews, according to UHS’ Filton.

Tenet’s Sutaria said that claims denials were “excessive and inappropriate” during a third-quarter earnings call, adding that the hospital system was working to push back on the volume of claims denials.

Their number one strategy is to provide “excellent documentation” to refute denials quickly, Sutaria said.

Still, excessive claims denials can drive up administrative costs for hospitals, according to Matthew Bates, managing director at Kaufman Hall.

“That denial creates a lot more work, because now I have to deal with that bill two, three, four times to get through the denial process,” Bates said. “It starts to rapidly eat into the operating margins… [becoming] both a cashflow problem and an administrative costs burden.”

Executives across the four for-profit operators said they planned to negotiate with insurers to receive more favorable rates and limit the number of denials in subsequent quarters.

HCA’s Hazen said that it was important for HCA to maintain its in-network status with insurers “to avoid the surprise billing and that [independent dispute resolution] process,” but that it would work with its payers to get “reasonable rates” going forward.

68 health systems with strong finances

Here are 68 health systems with strong operational metrics and solid financial positions, according to reports from credit rating agencies Fitch Ratings, Moody’s Investors Service and S&P Global in 2023. 

AdventHealth has an “AA” rating and stable outlook with Fitch. The rating reflects the  Altamonte Springs, Fla.-based system’s strong financial profile, characterized by still-adequate liquidity and moderate leverage, typically strong and highly predictable profitability, Fitch said. 

Advocate Aurora Health has an “AA” rating and stable outlook with Fitch. The Downers Grove, Ill.- and Milwaukee-based system’s rating reflects a very strong financial profile in the context of an already sound market position and geographic reach that was enhanced after merging with Charlotte, N.C.-based Atrium Health, Fitch said.    

AnMed Health has an “AA-” rating and stable outlook with Fitch. The Anderson, S.C.-based system has maintained strong performance through the COVID-19 pandemic and current labor market pressures, Fitch said.  

AtlantiCare has an “AA-” rating and stable outlook with Fitch. The Atlantic City, N.J.-based system has a strong balance sheet with solid liquidity position and low debt burden, Fitch said. 

Atrium Health has an “AA-” rating and stable outlook with S&P Global. The Charlotte, N.C.-based system’s rating reflects a robust financial profile, growing geographic diversity and expectations that management will continue to deploy capital with discipline. 

Banner Health has an “AA-” and stable outlook with Fitch. The Phoenix-based system’s rating highlights the strength of its core hospital delivery system and growth of its insurance division, Fitch said. 

BayCare Health System has an “AA” rating and stable outlook with Fitch. The Tampa, Fla.-based system’s rating reflects its excellent financial profile supported by its leading market position in a four-county area and the ability to sustain a solid operating outlook in the face of inflationary sector headwinds, Fitch said. 

Bayhealth has an “AA” rating and stable outlook with Fitch. The rating reflects the strength of the Dover, Del.-based system’s market positions and the stability of its financial profile, Fitch said.  

Beacon Health System has an “AA-” rating and stable outlook with Fitch. The rating reflects the strength of the South Bend, Ind.-based system’s balance sheet, the rating agency said.   

Berkshire Health has an “AA-” rating and stable outlook with Fitch. The Pittsfield, Mass.-based system has a strong financial profile, solid liquidity and modest leverage, according to Fitch. 

Bryan Health has an “AA-” rating and stable outlook with Fitch. The rating reflects the Lincoln, Neb., system’s leading and growing market position as a regional referral center with strong expense flexibility and cash flow, Fitch said.  

Cape Cod Healthcare has an “AA-” and stable outlook with Fitch. The Hyannis, Mass.-based system’s rating reflects a dominant market position in its service area and historically solid operating results, the rating agency said. 

Carle Health has an “AA-” rating and stable outlook with Fitch. The rating reflects the Urbana, Ill.-based system’s distinctly leading market position over a broad service area, Fitch said. 

CaroMont Health has an “AA-” rating and stable outlook with S&P Global. The Gastonia, N.C.-based system has a healthy financial profile and robust market share in a competitive region.  

CentraCare has an “AA-” rating and stable outlook with Fitch. The St. Cloud, Minn.-based system has a leading market position, and its management’s focus on addressing workforce pressures, patient access and capacity constraints will improve operating margins over the medium term, Fitch said. 

Children’s Health System of Texas has an “AA” and stable outlook with Fitch. The Dallas-based system’s rating reflects its solid operating performance in 2022, resulting from inpatient, outpatient and surgical volume growth, as well as one-time support from pandemic-era stimulus funding, Fitch said. 

Children’s Minnesota has an “AA” rating and stable outlook with Fitch. The Minneapolis-based system’s broad reach within the region continues to support long-term sustainability as a market leader and preferred provider for children’s health care, Fitch said. 

Concord (N.H.) Hospital has an “AA-” rating and stable outlook with Fitch. The rating reflects the strength of Concord’s leverage and liquidity assessment and Fitch’s assessment that two recently acquired hospitals will be strategically and financially accretive. 

Cone Health has an “AA” rating and stable outlook with Fitch. The rating reflects the expectation that the Greensboro, N.C.-based system will gradually return to stronger results in the medium term, the rating agency said.

Cottage Health has an “AA-” rating and stable outlook with Fitch. The rating reflects the Santa Barbara, Calif.-based system’s leading market position and broad reach in a service area that exhibits modest population growth but consistently high demand for acute care services, Fitch said. 

Deaconess Health System has an “AA” rating and stable outlook with Fitch. The Evansville, Ind.-based system demonstrated operating cost flexibility through the pandemic and recent labor and inflationary pressure, Fitch said. 

Duke University Health System has an “AA-” rating and stable outlook with Fitch. Fitch projects the Durham, N.C.-based system will benefit from the integration of the former Private Diagnostic Clinic and from North Carolina’s recently enacted Medicaid expansion and Healthcare Access and Stabilization Program. 

El Camino Health has an “AA-” rating and stable outlook with Fitch. The Mountain View, Calif.-based system has a history of generating double-digit operating EBITDA margins, driven by a solid market position that features strong demographics and a very healthy payer mix, Fitch said. 

Franciscan Health has an “AA” rating and stable outlook with Fitch. The rating reflects the Mishawaka, Ind.-based system’s strong and stable balance sheet, favorable payer mix, and leading or near leading market share in its service areas, Fitch said. 

Froedtert Health has an “AA” rating and stable outlook with Fitch. The rating reflects the Milwaukee-based system’s maintenance of a strong, albeit compressed, operating performance and a robust liquidity position, Fitch said. 

Geisinger has an “AA-” credit rating and stable outlook with S&P. The Danville, Pa.-based system enjoys strong integration and value-based care experience, the ratings agency said.

Hackensack Meridian Health has an “AA-” rating and stable outlook with Fitch. The Edison, N.J.-based system’s rating is supported by its strong presence in its large and demographically favorable market, Fitch said.  

Harris Health System has an “AA” rating and stable outlook with Fitch. The Houston-based system has a “very strong” revenue defensibility, primarily based on the district’s significant taxing margin that provides support for operations and debt service, Fitch said.

Hoag Memorial Hospital Presbyterian has an “AA” rating and stable outlook with Fitch. The Newport Beach, Calif.-based system’s rating is supported by a leading market position in its immediate area and very strong financial profile, Fitch said.  

Intermountain Health has an “Aa1” rating and stable outlook with Moody’s. The Salt Lake City-based system’s rating is reflected by its distinctly leading market position in Utah and strong absolute and relative cash levels, Moody’s said.   

Inspira Health has an “AA-” rating and stable outlook with Fitch. The Mullica Hill, N.J.-based system’s rating reflects its leading market position in a stable service area and a large medical staff supported by a growing residency program, Fitch said. 

IU Health has an “AA” rating and stable outlook with Fitch. The Indianapolis-based system has a long track record of strong operating margins and an overall credit profile that is supported by a strong balance sheet, the rating agency said. 

Lucile Packard Children’s Hospital has an “AA-” rating and stable outlook with Fitch. The rating reflects the Palo Alto, Calif.-based hospital’s role as a nationally known, leading children’s hospital, Fitch said. It also benefits from resilient clinical volumes and a solid market position, as well as its relationship with Stanford University and Stanford Health Care. 

Kaiser Permanente has an “AA-” and stable outlook with Fitch. The Oakland, Calif.-based system’s rating is driven by a strong financial profile, which is maintained despite a challenging operating environment in fiscal year 2022. 

Mayo Clinic has an “Aa2” rating and stable outlook with Moody’s. The Rochester, Minn.-based system’s credit profile characterized by its excellent reputations for clinical services, research and education, Moody’s said.

McLaren Health Care has an “AA-” rating and stable outlook with Fitch. The Grand Blanc, Mich.-based system has a leading market position over a broad service area covering much of Michigan and a track-record of profitability despite sector-wide market challenges in recent years, Fitch said.

McLeod Regional Medical Center has an “AA-” rating and stable outlook with Fitch. The rating reflects the Florence, S.C.-based system’s very strong financial profile assessment, historically strong operating EBITDA margins and its solid market position, Fitch said.   

MemorialCare has an “AA-” rating and stable outlook with Fitch. The rating reflects the Fountain Valley, Calif.-based system’s strong financial profile and excellent leverage metrics despite its weaker operating performance, Fitch said. 

Memorial Sloan-Kettering Cancer Center has an “AA” rating and stable outlook with Fitch. The rating reflects Fitch’s expectation that the New York City-based system’s national and international reputation as a premier cancer hospital will continue to support growth in its leading and increasing market share for its specialty services. 

Midland (Texas) Health has an “AA-” rating and stable outlook with Fitch. The rating reflects Midland’s exceptional market position and limited competition for acute-care services and growing outpatient services, Fitch said.  

Monument Health has an “AA-” rating and stable outlook with Fitch. The rating reflects the Rapid City, S.D.-based system’s dominant inpatient market share and excellent market position across its geographically broad service area, Fitch said. 

Munson Healthcare has an “AA” rating and stable outlook with Fitch. The rating reflects the strength of the Traverse City, Mich.-based system’s market position and its leverage and liquidity profiles.  

MyMichigan Health has an “AA-” rating and stable outlook with Fitch. The Midland-based system reflects the system’s market position as the largest provider of acute care services and its leading market position in a sizable geographic area covering 25 counties in mid and northern Michigan, the rating agency said. 

North Mississippi Health Services has an “AA” rating and stable outlook with Fitch. The Tupelo-based system’s rating reflects its very strong cash position and strong market position, Fitch said. 

NewYork-Presbyterian Hospital has an “AA” rating and stable outlook with Fitch. The rating reflects the New York City-based system’s market position as one of New York’s major academic healthcare systems with a reputation that extends beyond the region, Fitch said. 

Novant Health has an “AA-” rating and stable outlook with Fitch. The Winston-Salem, N.C.-based system has a highly competitive market share in three separate North Carolina markets, Fitch said, including a leading position in Winston-Salem (46.8 percent) and second only to Atrium Health in the Charlotte area.  

NYC Health + Hospitals has an “AA-” rating with Fitch. The New York City system is the largest municipal health system in the country, serving more than 1 million New Yorkers annually in more than 70 patient locations across the city, including 11 hospitals, and employs more than 43,000 people. 

OhioHealth has an “AA+” rating and stable outlook with Fitch. The Columbus-based system has an exceptionally strong credit profile, very favorable leverage metrics and reliably strong profitability, Fitch said.    

Orlando (Fla.) Health has an “AA-” rating and stable outlook with Fitch. The system’s upgrade from “A+” reflects the continued strength of the health system’s operating performance, growth in unrestricted liquidity and excellent market position in a demographically favorable market, Fitch said.  

Phoenix Children’s Hospital has an “AA-” and stable outlook with Fitch. The rating reflects its position as a distinct leading provider of pediatric health services in a growing primary service area, Fitch said. 

The Queen’s Health System has an “AA” rating and stable outlook with Fitch. The Honolulu-based system’s rating reflects its leading state-wide market position, historically strong operating performance and diverse revenue streams, the rating agency said. 

Rush System for Health has an “AA-” and stable outlook with Fitch. The Chicago-based system has a strong financial profile despite ongoing labor issues and inflationary pressures, Fitch said. 

Saint Francis Healthcare System has an “AA” rating and stable outlook with Fitch. The Cape Girardeau, Mo.-based system enjoys robust operational performance and a strong local market share as well as manageable capital plans, Fitch said. 

Salem (Ore.) Health has an “AA-” rating and stable outlook with Fitch. The system has a “very strong” financial profile and a leading market share position, Fitch said. 

Sanford Health has an “AA-” rating and stable outlook with Fitch. The Sioux Falls, S.D.-based system rating reflects its leading inpatient market share positions in multiple markets and strong overall financial profile, the rating agency said. 

Stanford Health Care has an “AA” rating and stable outlook with Fitch. The Palo Alto, Calif.-based system’s rating is supported by its extensive clinical reach in the greater San Francisco and Central Valley regions and nationwide/worldwide destination position for extremely high-acuity services, Fitch said. 

SSM Health has an “AA-” rating and stable outlook with Fitch. The St. Louis-based system has a strong financial profile, multi-state presence and scale, with solid revenue diversity, Fitch said.  

St. Clair Health has an “AA-” rating and stable outlook with Fitch. The rating reflects the Pittsburgh-based system’s strong financial profile assessment, solid market position and historically strong operating performance, the rating agency said. 

St. Tammany Parish Hospital has an “AA-” rating and stable outlook with Fitch. The rating reflects the Covington, La.-based system’s strong operating risk assessment and very strong financial profile supported by consistently robust operating cash flows, Fitch said.  

Texas Medical Center has an “AA-” rating and stable outlook with Fitch. The rating reflects the Houston-based system’s profitable service enterprise, its long and collaborative relationship with strong university, nonprofit and medical industry partners, and sizable financial reserve levels, Fitch said. 

TriHealth has an “AA-” rating and stable outlook with Fitch. The Cincinnati-based system’s rating reflects its broad reach, high-acuity services and stable market position in a highly fragmented and competitive market, Fitch said.  

UChicago Medicine has an “AA-” rating and stable outlook with Fitch. The rating reflects the system’s broad and growing reach for high-acuity services and the considerable benefits it receives from its high degree of integration with the University of Chicago, Fitch said.   

UCHealth has an “AA” rating and stable outlook with Fitch. The Aurora, Colo.-based system’s margins are expected to remain robust, and the operating risk assessment remains strong, Fitch said.  

University of Kansas Health System has an “AA-” rating and stable outlook with S&P Global. The Kansas City-based system has a solid market presence, good financial profile and solid management team, though some balance sheet figures remain relatively weak to peers, the rating agency said. 

Virtua Health has an “AA-” rating and stable outlook with Fitch. The rating is supported by the Marlton, N.J.-based system’s leading market position in a stable service area and the successful integration of the Lourdes Health System, Fitch said.  

VHC Health has an”AA-” rating and stable outlook with Fitch. The Arlington-based system has demonstrated strong operating cost flexibility, growth in high acuity service lines and an expanding outpatient footprint, Fitch said.  

WellSpan Health has an “Aa3” rating and stable outlook with Moody’s. The York, Pa.-based system has a distinctly leading market position across several contiguous counties in central Pennsylvania, and management’s financial stewardship and savings initiatives will continue to support sound operating cash flow margins when compared to peers, Moody’s said.

Willis-Knighton Health System has an “AA-” rating and stable outlook with Fitch. The Shreveport, La.-based system has a “dominant inpatient market position” and is well positioned to manage operating pressures, Fitch said.

Health systems risk being reduced to their core

https://mailchi.mp/9b1afd2b4afb/the-weekly-gist-december-1-2023?e=d1e747d2d8

This week’s graphic features our assessment of the many emerging competitive challenges to traditional health systems.

Beyond inflation and high labor costs, health systems are struggling because competitors—ranging from vertically integrated payers to PE-backed physician groups—are effectively stripping away profitable services and moving them to lower-cost care sites. The tandem forces of technological advancement, policy changes, and capital investment have unlocked the ability of disruptors to enter market segments once considered safely within health system control. 

While health systems’ most-exposed services, like telemedicine and primary care, were never key revenue sources (although they are key referral drivers), there are now more competitors than ever providing diagnostics and ambulatory surgery, which health systems have relied on to maintain their margins. 

Moving forward, traditional systems run the risk of being “crammed down” into a smaller portfolio of (largely unprofitable) services: the emergency department, intensive care unit, and labor and delivery. 

Health systems cannot support their operations by solely providing these core services, yet this is the future many will face if they don’t emulate the strategies of disruptors by embracing the site-of-care shift, prioritizing high-margin procedures, rethinking care delivery within the hospital, and implementing lower-cost care models that enable them to compete on price.

Tower turnaround continues as operating margin hits -4.2%

West Reading, Pa.-based Tower Health continues to make progress on its performance improvement plan as its operating margin for the three months ended Sept. 30 rose to -4.2% from -8% during the same period in 2022. Its operating cash flow margin also increased from -0.9% to 2.3%. 

During the first quarter of fiscal 2024, the three months ending Sept. 30, revenue decreased 2.9% year over year to $457.4 million. Expenses decreased 6.4% to $476.5 million. 

Tower’s operating loss for the period was $19.1 million, compared with a loss of $37.6 million for the prior-year period. 

As of Sept. 30, total balance sheet unrestricted cash and board-designated investment funds for capital improvements totalled $154 million — a decrease of $54 million from June 30, 2023. The main factors for the decrease were $15 million of debt service payments, physician incentive compensation payments of $9 million, capital expenditures of $6 million, negative changes in working capital of $32 million, partially offset by EBITDA of $10 million.

Total days of cash on hand for the system was 30 on Sept. 30.

After including the performance of its investment portfolio and other nonoperating items, the health system ended the three-month period with a net loss of $20.9 million, compared with a net loss of $37.6 million for the same period in 2022. 

National Hospital Flash Report: October 2023

While hospitals’ overall performance declined slightly in September compared to the previous month, the median Kaufman Hall Calendar Year-To-Date Operating Margin Index reflecting actual margins was 1.4% in September. This slight increase was due to the historical variation in the performance of hospitals across 2023.

Volume decreased across the board, but data indicate improvement in the overall financial picture compared to 2022.

The October issue of the National Hospital Flash Report covers these and other key performance metrics.

Download