Hospitals’ forced makeover

Hospitals’ business models are being upended by fundamental changes within the health care system, including one that presents a pretty existential challenge: People have far more options to get their care elsewhere these days.

Why it matters: 

Health systems’ responses to major demographic, social and technological change have been controversial among policymakers and economists concerned about the impact on costs and competition.

  • Communities depend on having at least some emergency services available, making the survival of hospitals’ core services crucial.
  • But without adaptation — which is already underway in some cases — hospitals may be facing deep red balance sheets in the not-too-distant future, leading to facility closures and shuttered services.

The big picture: 

Many hospitals have recovered from the sector’s post-pandemic financial slump, which was driven primarily by staffing costs and inflation. But systemic, long-term trends will continue to challenge their traditional business model.

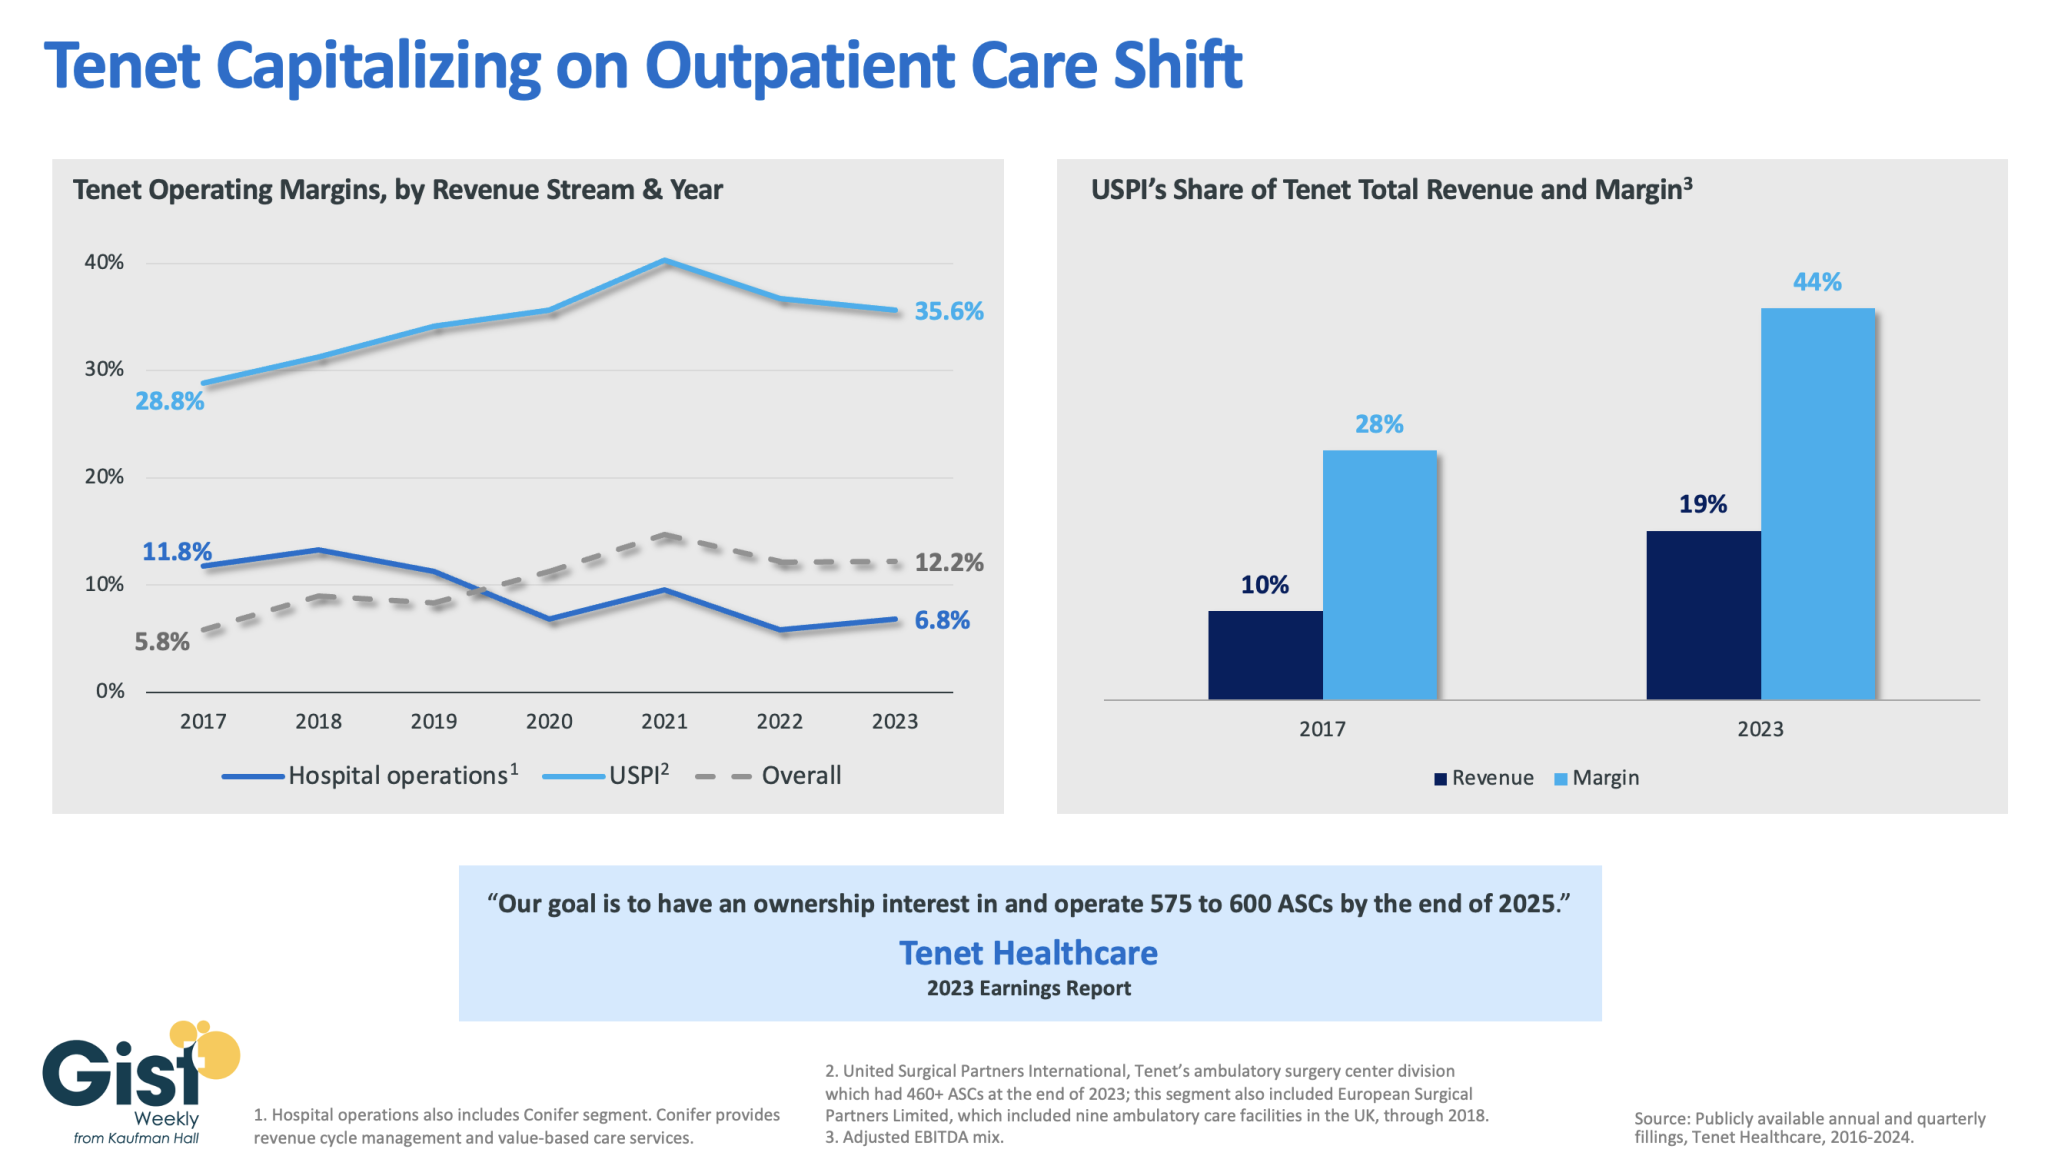
  • Many of the services that are shifting toward outpatient settings — like oncology, diagnostics and orthopedic care — are the ones that typically make hospitals the most money and effectively subsidize less profitable departments.
  • When hospitals lose these higher-margin services, “you’re starving the system that needs profits to provide services that we all might need, but particularly uninsured or underinsured people might need,” said UCLA professor Jill Horwitz.

And hospitals have long claimed that much higher commercial insurance rates make up for what they say are inadequate government rates.

  • But as the population ages and moves out of employer-sponsored health plans, fewer people will have commercial insurance, forcing hospitals to either cut costs or find new sources of revenue.

By the numbers: 

Consulting firms are projecting a bleak decade for health systems.

  • Oliver Wyman recently predicted that under the status quo, hospitals will need to reduce their expenses by 15-20% by 2030 “to stay viable.”
  • Boston Consulting Group last year projected that health systems’ annual financial shortfall will total more than $200 billion by 2027, and their operating margins will have dropped by 10 percentage points.
  • To break even in 2027, a “typical” health system would need payment rate increases of between 5-8% annually — twice the rate growth over the last decade, according to BCG. If the load is borne solely by private insurers, hospitals will need a 10-16% year-over-year increase.

Between the lines: 

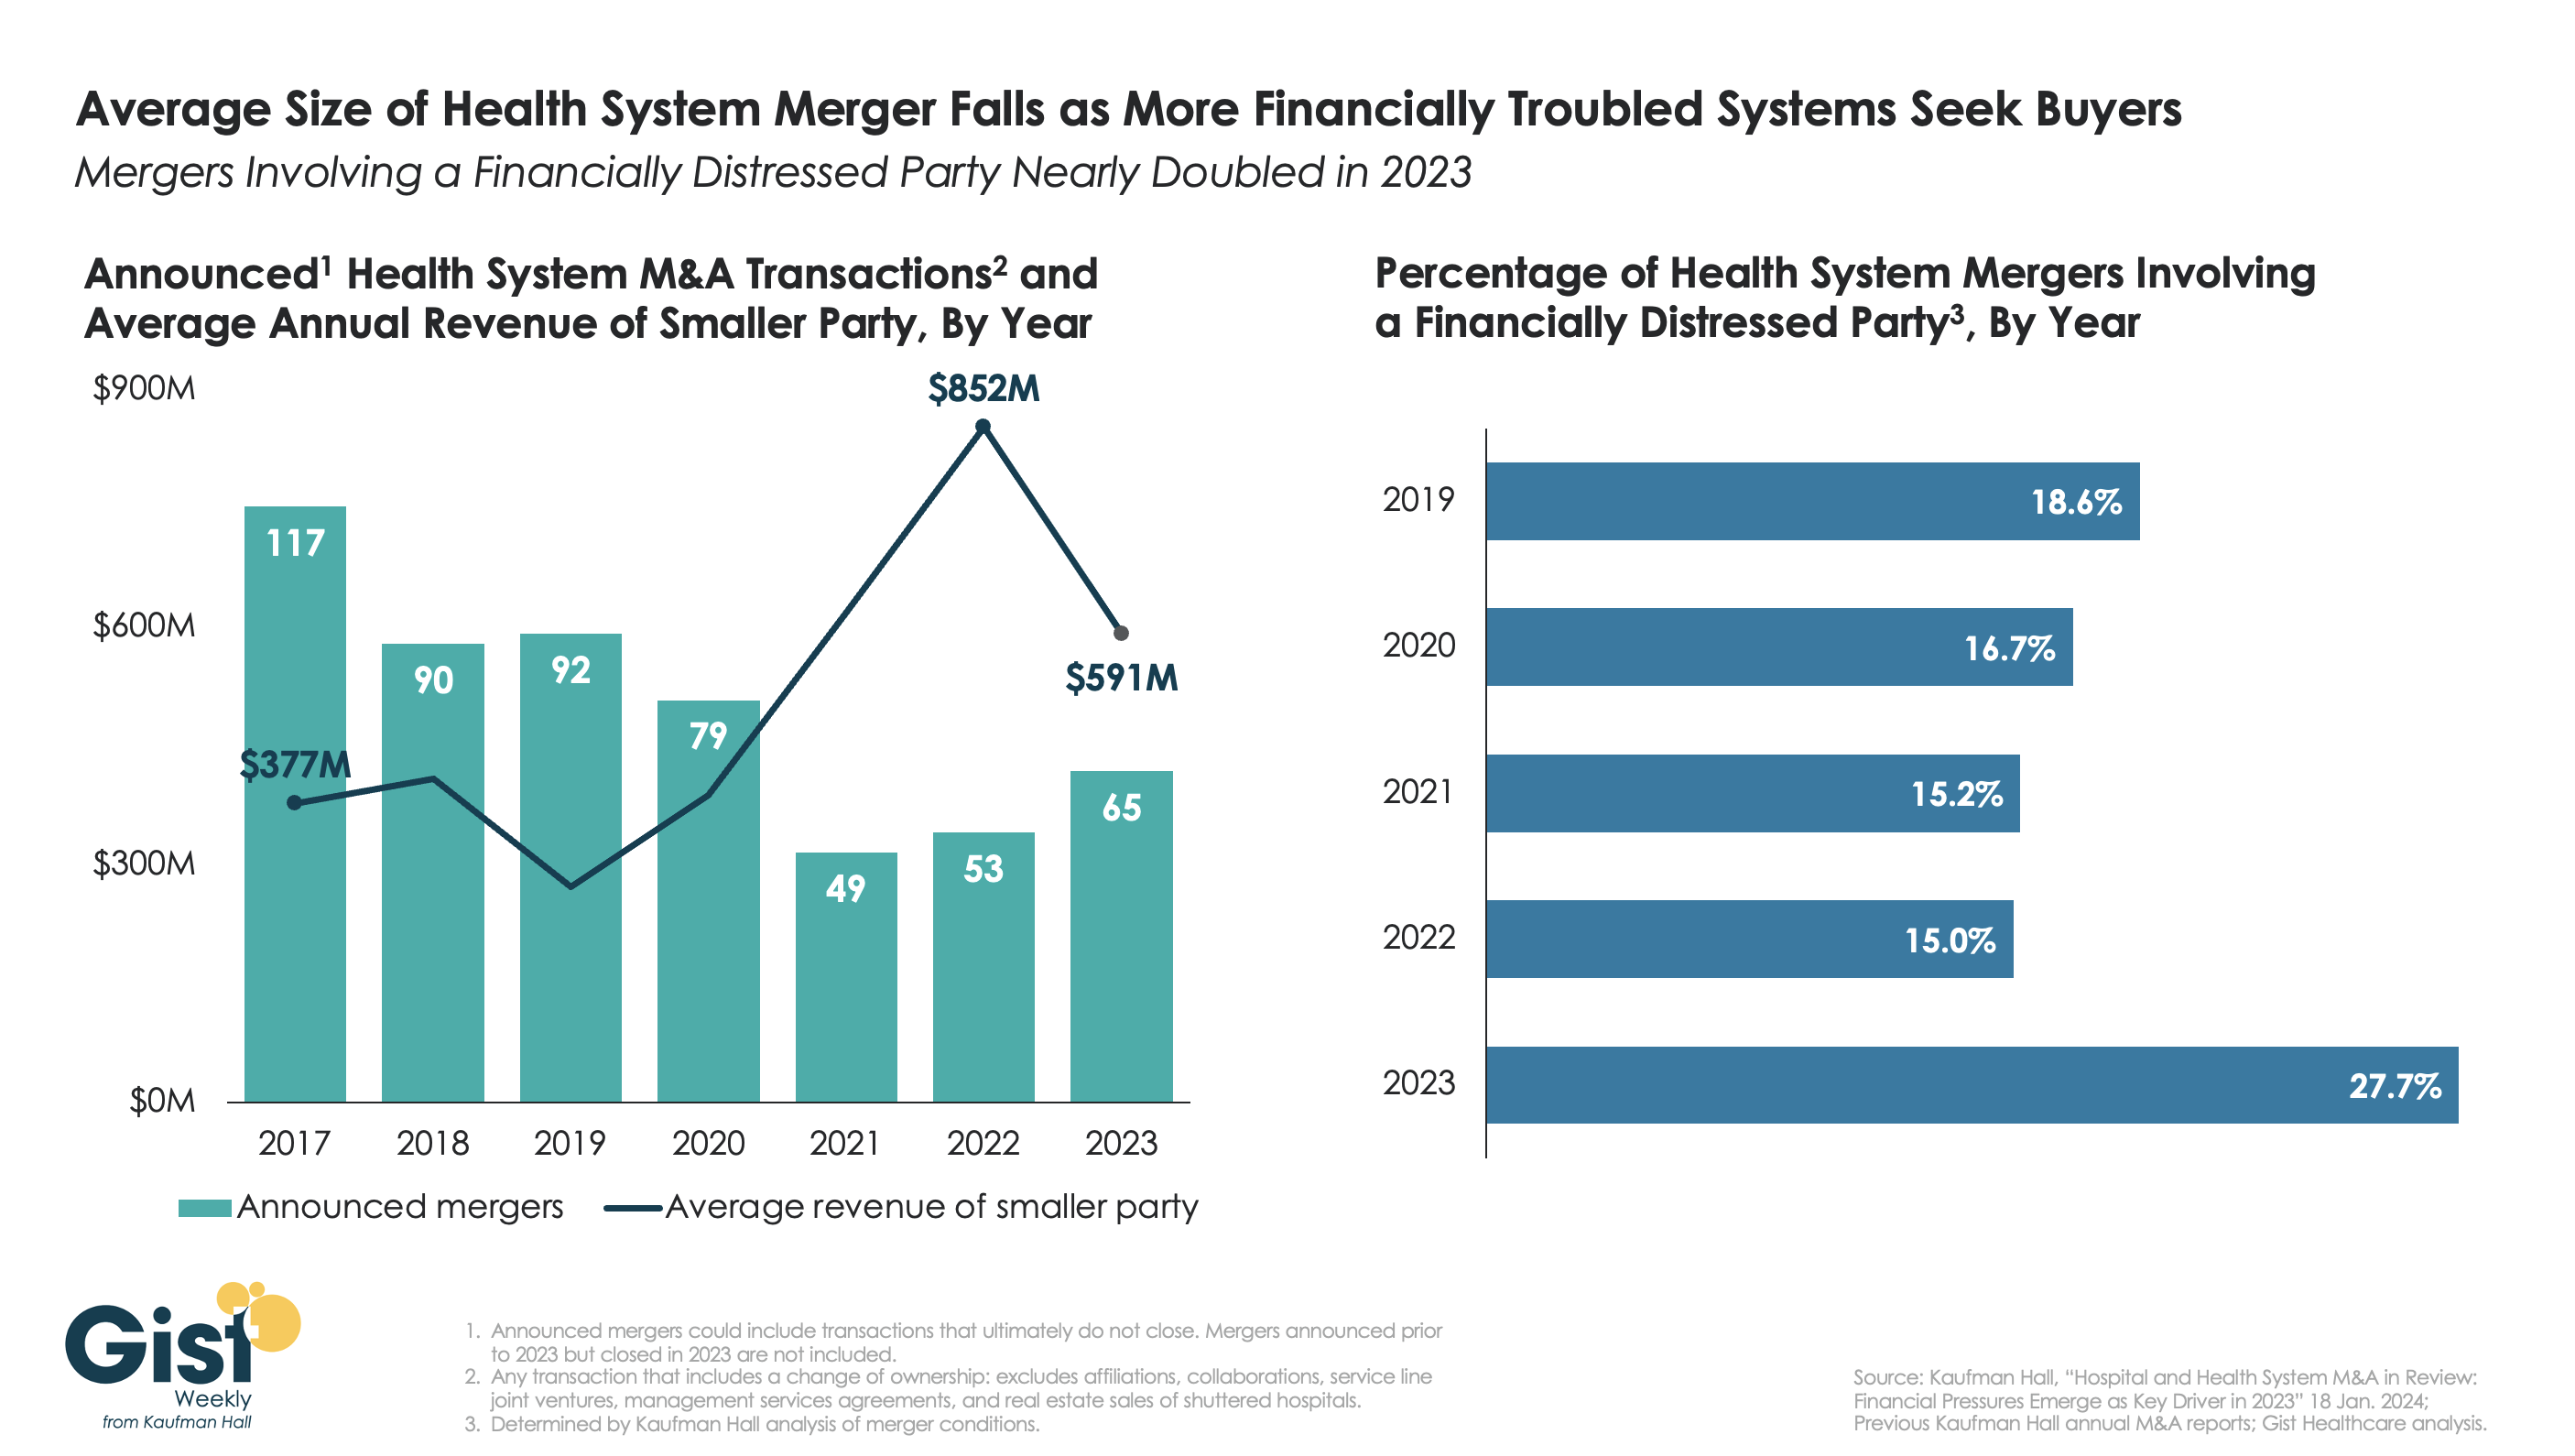
This is the lens through which to view health systems’ spree of mergers and acquisitions, which have increasingly drawn criticism from policymakers, regulators and economists as being anticompetitive.

  • For better or worse, when hospitals have a larger market share, they are in a better position to negotiate and bring in more patients, and they can dilute some of the financial pain of poorer-performing facilities.
  • And when they acquire physician practices or other outpatient clinics, they’re still getting paid for delivering care even when patients aren’t receiving it in a traditional hospital setting.
  • “I think the hospitals have sort of said … ‘We can keep doing things the same way and we can just merge and get higher markups,'” said Yale economist Zack Cooper. “That push to consolidate is saying, ‘Let’s not move forward, let’s dig in.'”

Yes, but: 

A big bonus of outpatient care is that it’s supposed to be cheaper. But when hospitals charge more for care than an independent physician’s office would have, or they tack on facility fees, costs don’t go down.

  • And there’s a growing body of research showing that when hospitals consolidate, costs go up.
  • “They’ve protected their portfolio, and that’s added to the cost of health care,” said Johns Hopkins professor Gerard Anderson.

The other side: 

Hospitals are typically on the losing end of negotiations with insurers right now, thanks to how large insurers have become, and are “in an extremely difficult competitive position,” said Ken Kaufman, co-founder of consulting agency Kaufman Hall.

  • Criticizing their mergers and acquisitions as anticompetitive is a “complete misunderstanding of the situation,” he said, and moving toward a new care model will take “an incredible amount of resources.”

Reality check: 

Hospitals account for 30% of the country’s massive health spending tab, and they’ll have to be at the forefront of any real efforts to contain costs.

  • They’re also anchors in their communities and are powerful lobbyists, which helps explain why Congress has struggled to modestly reduce what Medicare pays hospital outpatient departments.

Tenet driving growth and profitability through ASC segment 

https://mailchi.mp/ea16393ac3c3/gist-weekly-march-22-2024?e=d1e747d2d8

In this week’s graphic, we dive into recently released data on Tenet Healthcare’s 2023 financial performanceWhile the for-profit healthcare services company’s annual margin on hospital operations has declined since 2017, its overall profitability has more than doubled, thanks to strong performances from its ambulatory surgery center (ASC) chain,

United Surgical Partners International (USPI), which has consistently posted margins above 30 percent. Despite bringing in less than one fifth of Tenet’s total revenue, USPI is now responsible for almost half of Tenet’s overall margin. 

Tenet has pursued this growth aggressively since buying USPI in 2015, swelling its ASC footprint from 249 locations in 2015 to more than 460 in 2023, with plans to increase that number to nearly 600 by the end of next year. 

Tenet appears to be doubling down on its strategy of pursuing high-margin services over high-revenue services, especially as outpatient volumes are expected to far surpass growth in hospital-based care over the next decade.   

8 Reasons Hospitals must Re-think their Future

Today is the federal income Tax Day. In 43 states, it’s in addition to their own income tax requirements. Last year, the federal government took in $4.6 trillion and spent $6.2 trillion including $1.9 trillion for its health programs. Overall, 2023 federal revenue decreased 15.5% and spending was down 8.4% from 2022 and the deficit increased to $33.2 trillion. Healthcare spending exceeded social security ($1.351 trillion) and defense spending ($828 billion) and is the federal economy’s biggest expense.

Along with the fragile geopolitical landscape involving relationships with China, Russia and Middle East, federal spending and the economy frame the context for U.S. domestic policies which include its health system. That’s the big picture.

Today also marks the second day of the American Hospital Association annual meeting in DC. The backdrop for this year’s meeting is unusually harsh for its members:

Increased government oversight:

Five committees of Congress and three federal agencies (FTC, DOJ, HHS) are investigating competition and business practices in hospitals, with special attention to the roles of private equity ownership, debt collection policies, price transparency compliance, tax exemptions, workforce diversity, consumer prices and more.

Medicare payment shortfall: 

CMS just issued (last week) its IPPS rate adjustment for 2025: a 2.6% bump that falls short of medical inflation and is certain to exacerbate wage pressures in the hospital workforce. Per a Bank of American analysis last week, “it appears healthcare payrolls remain below pre-pandemic trend” with hospitals and nursing homes lagging ambulatory sectors in recovering.”

Persistent negative media coverage:

The financial challenges for Mission (Asheville), Steward (Massachusetts) and others have been attributed to mismanagement and greed by their corporate owners and reports from independent watchdogs (Lown, West Health, Arnold Ventures, Patient Rights Advocate) about hospital tax exemptions, patient safety, community benefits, executive compensation and charity care have amplified unflattering media attention to hospitals.

Physicians discontent: 

59% of physicians in the U.S. are employed by hospitals; 18% by private equity-backed investors and the rest are “independent”. All are worried about their income. All think hospitals are wasteful and inefficient. Most think hospital employment is the lesser of evils threatening the future of their profession. And those in private equity-backed settings hope regulators leave them alone so they can survive. As America’s Physician Group CEO Susan Dentzer observed: “we knew we’re always going to need hospitals; but they don’t have to look or operate the way they do now. And they don’t have to be predicated on a revenue model based on people getting more elective surgeries than they actually need. We don’t have to run the system that way; we do run the healthcare system that way currently.”

The Value Agenda in limbo:

Since the Affordable Care Act (2010), the CMS Center for Innovation has sponsored and ultimately disabled all but 6 of its 54+ alternative payment programs. As it turns out, those that have performed best were driven by physician organizations sans hospital control. Last week’s release of “Creating a Sustainable Future for Value-Based Care: A Playbook of Voluntary Best Practices for VBC Payment Arrangements.” By the American Medical Association, the National Association of ACOs (NAACOs) and AHIP, the trade group representing America’s health insurance payers is illustrative. Noticeably not included: the American Hospital Association because value-pursuers think for hospitals it’s all talk.

National insurers hostility:  

Large, corporate insurers have intensified reimbursement pressure on hospitals while successfully strengthening their collective grip on the U.S. health insurance sector. 5 insurers control 50% of the U.S. health insurance market: 4 are investor owned. By contrast, the 5 largest hospital systems control 17% of the hospital market: 1 is investor-owned. And bumpy insurer earnings post-pandemic has prompted robust price increases: in 2022 (the last year for complete data and first year post pandemic), medical inflation was 4.0%, hospital prices went up 2.2% but insurer prices increased 5.9%.

Costly capital: 

The U.S. economy is in a tricky place: inflation is stuck above 3%, consumer prices are stable and employment is strong. Thus, the Fed is not likely to drop interest rates making hospital debt more costly for hospitals—especially problematic for public, safety net and rural hospitals. The hospital business is capital intense: it needs $$ for technologies, facilities and clinical innovations that treat medical demand. For those dependent on federal funding (i.e. Medicare), it’s unrealistic to think its funding from taxpayers will be adequate.  Ditto state and local governments. For those that are credit worthy, capital is accessible from private investors and lenders. For at least half, it’s problematic and for all it’s certain to be more expensive.

Campaign 2024 spotlight:

In Campaign 2024, healthcare affordability is an issue to likely voters. It is noticeably missing among the priorities in the hospital-backed Coalition to Strengthen America’s Healthcare advocacy platform though 8 states have already created “affordability” boards to enact policies to protect consumers from medical debts, surprise hospital bills and more.

Understandably, hospitals argue they’re victims. They depend on AHA, its state associations, and its alliances with FAH, CHA, AEH and other like-minded collaborators to fight against policies that erode their finances i.e. 340B program participation, site-neutral payments and others. They rightfully assert that their 7/24/365 availability is uniquely qualifying for the greater good, but it’s not enough. These battles are fought with energy and resolve, but they do not win the war facing hospitals.

AHA spent more than $30 million last year to influence federal legislation but it’s an uphill battle. 70% of the U.S. population think the health system is flawed and in need of transformative change. Hospitals are its biggest player (30% of total spending), among its most visible and vulnerable to market change.

Some think hospitals can hunker down and weather the storm of these 8 challenges; others think transformative change is needed and many aren’t sure. And all recognize that the future is not a repeat of the past.

For hospitals, including those in DC this week, playing victim is not a strategy. A vision about the future of the health system that’s accessible, affordable and effective and a comprehensive plan inclusive of structural changes and funding is needed. Hospitals should play a leading, but not exclusive, role in this urgently needed effort.

Lacking this, hospitals will be public utilities in a system of health designed and implemented by others.

42 health systems ranked by operating margins

Health system operating margins improved in 2023 after a tumultuous 2022. Increased revenue from rebounding patient volumes helped offset the high costs of labor and supplies for many systems, but some continue to face challenges turning a financial corner. 

In a Feb. 21 analysis, Kaufman Hall noted that too many hospitals are losing money but high-performing hospitals are faring far better, “effectively pulling away from the pack.” 

Average operating margins have see-sawed over the last 12 months, from a -1.2% low in February 2023 to 5.5% highs in June and December. In February, average operating margins dropped to 3.96% before the Change Healthcare data breach, which has impacted claims processing.

Here are 42 health systems ranked by operating margins in their most recent financial results.

Editor’s note: The following financial results are for the 12 months ending Dec. 31, 2023, unless otherwise stated. 

1. Tenet Healthcare (Dallas)

Revenue: $20.55 billion
Expenses: $18.31 billion
Operating income/loss: $2.5 billion 
(*Includes grant income and equity in earnings of unconsolidated affiliates)
Operating margin: 12.2%

2. HCA Healthcare (Nashville, Tenn.)

Revenue: $65 billion
Expenses: $57.3 billion
Operating income/loss: $7.7 billion
Operating margin: 11.8%

3. Universal Health Services (King of Prussia, Pa.)

Revenue: $14.3 billion
Expenses: $13.1 billion
Operating income/loss: $1.2 billion
Operating margin: 8.4% 

4. Baylor Scott & White (Dallas)

*Results for the first six months ending Dec. 31
Revenue: $7.6 billion
Expenses: $7 billion
Operating income/loss: $634 million
Operating margin: 8.3%

5. NYU Langone (New York City)

*Results for the 12 months ending Aug. 31
Revenue: $8.3 billion
Expenses: $7.7 billion
Operating income/loss: $686.2 million
Operating margin: 8.3%

6. Orlando (Fla.) Health

*Results for the 12 months ending Sept. 30
Revenue: $6.1 billion
Expenses: $5.6 billion
Operating income/loss: $491.3 million
Operating margin: 8.1%

7. Community Health Systems (Franklin, Tenn.)

Revenue: $12.5 billion
Expenses: $11.5 billion
Operating income/loss: $957 million
Operating margin: 7.7% 

8. Mayo Clinic (Rochester, Minn)

Revenue: $17.9 billion
Expenses: $16.8 billion
Operating income/loss: $1.1 billion 
Operating margin: 6%

9. Sanford Health (Sioux Falls, S.D.)

Revenue: $7.2 billion
Expenses: $6.8 billion
Operating income/loss: $402.2 million
Operating margin: 5.6%

10. Stanford Health Care (Palo Alto, Calif.)

*Results for the 12 months ending Aug. 31
Revenue: $7.9 billion
Expenses: $7.5 billion
Operating income/loss: $414.9 million
Operating margin: 5.3%

11. Christus Health (Irving, Texas)

*For the 12 months ending June 30 
Revenue: $7.8 billion
Expenses: $7.5 billion
Operating income/loss: $324.5 million
Operating margin: 4.2%

12. IU Health (Indianapolis)

Revenue: $8.6 billion
Expenses: $8.3 billion
Operating income/loss: $343 million
Operating margin: 4%

13. Northwestern Medicine (Chicago)

*Results for the 12 months ending Sept. 31
Revenue: $8.7 billion
Expenses: $8.4 billion
Operating income/loss: $352.3 million
Operating margin: 4%

14. BJC HealthCare (St. Louis)

Revenue: $6.9 billion
Expenses: $6.8 billion
Operating income/loss: $141.6 million
Operating margin: 2%

15. Banner Health (Phoenix)

Revenue: $14.1 billion
Expenses: $13.8 billion
Operating income/loss: $282.8 million
Operating margin: 2%

16. Norton Healthcare (Louisville, Ky.)

Revenue: $4 billion
Expenses: $3.8 billion
Operating income/loss: $76.3 million
Operating margin: 1.9%

17. Montefiore Health (New York City)

Revenue: $7.7 billion
Expenses: $7.6 billion
Operating income/loss: $93.9 million
Operating margin: 1.2%

18. Penn State Health (Hershey, Pa.)

*Results for the first six months ending Dec. 31
Revenue: $2.1 billion
Expenses: $2 billion
Operating income/loss: $22.9 million
Operating margin: 1.1%

19. Prisma Health (Greenville, S.C.)

*For the 12 months ending Sept. 30
Revenue: $6 billion
Expenses: $5.9 billion
Operating income/loss: $67.1 million
Operating margin: 1.1%

20. HonorHealth (Scottsdale, Ariz.)

Revenue: $3.1 billion
Expenses: $3 billion
Operating income/loss: $32.8 million
Operating margin: 1.1%

21. Henry Ford Health (Detroit)

Revenue: $7.8 billion
Expenses: $7.7 billion
Operating income/loss: $80.5 million
Operating margin: 1%

22. Intermountain Health (Salt Lake City)

Revenue: $16.1 billion
Expenses: $15.2 billion
Operating income/loss: $137 million
Operating margin: 0.9%

23. Advocate Health (Charlotte, N.C.)

*For the nine months ending Sept. 30
Revenue: $22.83 billion
Expenses: $22.75 billion
Operating income/loss: $79.4 million
Operating margin: 0.4%

24. Cleveland Clinic

Revenue: $14.5 billion
Expenses: $13.7 billion
Operating income/loss: $64.3 million
Operating margin: 0.4%

25. OSF HealthCare (Peoria, Ill.)

*For the 12 months ending Sept. 30
Revenue: $4.1 billion
Expenses: $4.1 billion
Operating income/loss: $1.2 million
Operating margin: 0%

26. CommonSpirit (Chicago) 

*Results for the first six months ending Dec. 31
Revenue: $18.69 billion
Expenses: $18.63 billion
Operating income/loss: ($46 million)
Operating margin: (0.2%)

27. Kaiser Permanente (Oakland, Calif.)

Revenue: $100.8 billion
Expenses: $100.5 billion
Operating income/loss: $329 million
Operating margin: (0.3% margin) 

28. Mass General Brigham (Boston)

*Results for the 12 months ended Sept. 30
Revenue: $18.8 billion
Expenses: $18.7 billion
Operating income/loss: ($48 million)
Operating margin: (0.3%)

29. Geisinger Health (Danville, Pa.)

Revenue: $7.7 billion
Expenses: $7.8 billion
Operating income/loss: ($37 million)
Operating margin: (0.5%)

30. SSM Health (St. Louis)

Revenue: $10.5 billion
Expenses: $10.6 billion
Operating income/loss: ($58.5 million)
Operating margin: (0.6%)

31. UPMC (Pittsburgh)

Revenue: $27.7 billion
Expenses: $27.9 billion
Operating income/loss: ($198 million)
Operating margin: (0.7%)

32. Scripps Health (San Diego)

*For the 12 months ending Sept. 30
Revenue: $4.3 billion
Expenses: $4.3 billion
Operating income/loss: ($36.6 million)
Operating margin: (0.9%)

33. Ascension (St. Louis)

*Results for the first six months ending Dec. 31
Revenue: $15.01 billion
Expenses: $15.03 billion
Operating income/loss: ($155.2 million)
Operating margin: (1%)

34. Bon Secours Mercy Health (Cincinnati)

Revenue: $12.2 billion
Expenses: $12.4 billion
Operating income/loss: ($123.9 million)
Operating margin: (1%)

35. ProMedica (Toledo, Ohio)

Revenue: $3.3 billion
Expenses: $3.1 billion
Operating income/loss: ($44.5 million)
Operating margin: (1.3%)

36. Beth Israel Lahey Health (Cambridge, Mass.)

*Results for the 12 months ending Sept. 30
Revenue: $7.7 billion
Expenses: $7.8 billion
Operating income/loss: ($131.2 million)
Operating margin: (1.7%)

37. Geisinger (Danville, Pa.)

*Results for the nine months ending Sept. 30,
Revenue: $5.7 billion
Expenses: $2.3 billion
Operating income/loss: ($104.4 million)
Operating margin: (1.8%)

38. Premier Health (Dayton, Ohio)

Revenue: $2.3 billion
Expenses: $2.4 billion
Operating income/loss: ($85.3 million)
Operating margin: (3.7%)

39. Allegheny Health Network (Pittsburgh)

Revenue: $4.7 billion
Expenses: $4.2 billion
Operating income/loss: ($172.7 million)
Operating margin: (3.7% margin) 

40. Providence (Renton, Wash.)

Revenue: $28.7 billion
Expenses: $29.9 billion
Operating income/loss: ($1.2 billion)
Operating margin: (4.2%)

41. Tufts Medicine (Boston)

*Results for the 12 months ending Sept. 30
Revenue: $2.6 billion
Expenses: $2.8 billion
Operating income/loss: ($171 million)
Operating margin: (6.6%)

42. Allina Health (Minneapolis)

Revenue: $5.2 billion
Expenses: $5.5 billion
Operating income/loss: ($352.6 million)
Operating margin: (6.8%)

Chasing downstream margin over downstream revenue

https://mailchi.mp/fc76f0b48924/gist-weekly-march-1-2024?e=d1e747d2d8

A recent engagement with a health system executive team to discuss an underperforming service line uncovered a serious issue that’s becoming more common across the industry. 

“Our providers are more productive than ever,” the CFO informed our team, “and yet we keep losing money on the service line.” 

After digging into their physician compensation model, we came upon one source of the system’s issue. Because it was incentivizing physician RVUs equally across all payers, its providers responded, quite rationally, by picking up market share where growth was easiest: Medicaid patients, who weren’t generating any margin. 

“We recognize that we’ve been employing these physicians as loss leaders in order to generate downstream revenue,” the CFO shared, “but what’s the point of that revenue if there’s no longer any downstream margin?”


The economics of physician employment becomes a tough conversation very quickly; it’s a sensitive topic to many, and one with myriad facets. 

But the loss leader physician employment model obviously only works when it produces positive downstream margins. 

We’re in a critical window of time, where hospital margins are just beginning to recover as volumes return—but those volumes are not necessarily in the same places as before. 

The opportunity is ripe for systems to work closely with their aligned physicians to reexamine the post-pandemic margin picture for individual service lines and ensure incentives are aligning all parties to hit operating margin goals. 

Are these kinds of conversations taking place at your health system?

Healthcare Spending 2000-2022: Key Trends, Five Important Questions

Last week, Congress avoided a partial federal shutdown by passing a stop-gap spending bill and now faces March 8 and March 22 deadlines for authorizations including key healthcare programs.

This week, lawmakers’ political antenna will be directed at Super Tuesday GOP Presidential Primary results which prognosticators predict sets the stage for the Biden-Trump re-match in November. And President Biden will deliver his 3rd State of the Union Address Thursday in which he is certain to tout the economy’s post-pandemic strength and recovery.

The common denominator of these activities in Congress is their short-term focus: a longer-term view about the direction of the country, its priorities and its funding is not on its radar anytime soon. 

The healthcare system, which is nation’s biggest employer and 17.3% of its GDP, suffers from neglect as a result of chronic near-sightedness by its elected officials. A retrospective about its funding should prompt Congress to prepare otherwise.

U.S. Healthcare Spending 2000-2022

Year-over-year changes in U.S. healthcare spending reflect shifting demand for services and their underlying costs, changes in the healthiness of the population and the regulatory framework in which the U.S. health system operates to receive payments. Fluctuations are apparent year-to-year, but a multiyear retrospective on health spending is necessary to a longer-term view of its future.

The period from 2000 to 2022 (the last year for which U.S. spending data is available) spans two economic downturns (2008–2010 and 2020–2021); four presidencies; shifts in the composition of Congress, the Supreme Court, state legislatures and governors’ offices; and the passage of two major healthcare laws (the Medicare Modernization Act of 2003 and the Affordable Care Act of 2010).

During this span of time, there were notable changes in healthcare spending:

  • In 2000, national health expenditures were $1.4 trillion (13.3% of gross domestic product); in 2022, they were $4.5 trillion (17.3% of the GDP)—a 4.1% increase overall, a 321% increase in nominal spending and a 30% increase in the relative percentage of the nation’s GDP devoted to healthcare. No other sector in the economy has increased as much.
  • In the same period, the population increased 17% from 282 million to 333 million, per capita healthcare spending increased 178% from $4,845 to $13,493 due primarily to inflation-impacted higher unit costs for , facilities, technologies and specialty provider costs and increased utilization by consumers due to escalating chronic diseases.
  • There were notable changes where dollars were spent: Hospitals remained relatively unchanged (from $415 billion/30.4% of total spending to $1.355 trillion/31.4%), physician services shrank (from $288.2 billion/21.1% to $884.8/19.6%) and prescription drugs were unchanged (from $122.3 billion/8.95% to $405.9 billion/9.0%).
  • And significant changes in funding Out-of-pocket shrank from 14.2% ($193.6 billion in 2020) to (10.5% ($471 billion) in 2020, private insurance shrank from $441 billion/32.3% to $1.289 trillion/29%, Medicare spending grew from $224.8 billion/16.5% to $944.3billion/21%; Medicaid and the Children’s Health Insurance Program spending grew from $203.4 billion/14.9% to $7805.7billion/18%; and Department of Veterans Affairs healthcare spending grew from $19.1 billion/1.4% to $98 billion/2.2%.

Looking ahead (2022-2031), CMS forecasts average National Health Expenditures (NHE) will grow at 5.4% per year outpacing average GDP growth (4.6%) and resulting in an increase in the health spending share of Gross Domestic Product (GDP) from 17.3% in 2021 to 19.6% in 2031.

The agency’s actuaries assume

“The insured share of the population is projected to reach a historic high of 92.3% in 2022… Medicaid enrollment will decline from its 2022 peak of 90.4M to 81.1M by 2025 as states disenroll beneficiaries no longer eligible for coverage. By 2031, the insured share of the population is projected to be 90.5 percent. The Inflation Reduction Act (IRA) is projected to result in lower out-of-pocket spending on prescription drugs for 2024 and beyond as Medicare beneficiaries incur savings associated with several provisions from the legislation including the $2,000 annual out-of-pocket spending cap and lower gross prices resulting from negotiations with manufacturers.”

My take:

The reality is this: no one knows for sure what the U.S. health economy will be in 2025 much less 2035 and beyond. There are too many moving parts, too much invested capital seeking near-term profits, too many compensation packages tied to near-term profits, too many unknowns like the impact of artificial intelligence and court decisions about consolidation and too much political risk for state and federal politicians to change anything.

One trend stands out in the data from 2000-2022: The healthcare economy is increasingly dependent on indirect funding by taxpayers and less dependent on direct payments by users. 

In the last 22 years, local, state and federal government programs like Medicare, Medicaid and others have become the major sources of funding to the system while direct payments by consumers and employers, vis-à-vis premium out-of-pocket costs, increased nominally but not at the same rate as government programs. And total spending has increased more than the overall economy (GDP), household wages and  costs of living almost every year.

Thus, given the trends, five questions must be addressed in the context of the system’s long-term solvency and effectiveness looking to 2031 and beyond:

  • Should its total spending and public funding be capped?
  • Should the allocation of funds be better adapted to innovations in technology and clinical evidence?
  • Should the financing and delivery of health services be integrated to enhance the effectiveness and efficiency of the system?
  • Should its structure be a dual public-private system akin to public-private designations in education?
  • Should consumers play a more direct role in its oversight and funding?

Answers will not be forthcoming in Campaign 2024 despite the growing significance of healthcare in the minds of voters. But they require attention now despite political neglect.

PS: The month of February might be remembered as the month two stalwarts in the industry faced troubles:

United HealthGroup, the biggest health insurer, saw fallout from a cyberattack against its recently acquired (2/22) insurance transaction processor by ALPHV/Blackcat, creating havoc for the 6000 hospitals, 1 million physicians, and 39,000 pharmacies seeking payments and/or authorizations. Then, news circulated about the DOJ’s investigation about its anti-competitive behavior with respect to the 90,000 physicians it employs. Its stock price ended the week at 489.53, down from 507.14 February 1.

And HCA, the biggest hospital operator, faced continued fallout from lawsuits for its handling of Mission Health (Asheville) where last Tuesday, a North Carolina federal court refused to dismiss a lawsuit accusing it of scheming to restrict competition and artificially drive-up costs for health plans. closed at 311.59 last week, down from 314.66 February 1.

UPMC back in the red with $198M operating loss, -0.7% margin

Pittsburgh-based UPMC reported a $198 million operating loss (-0.7% margin) in 2023, down from a $162 million gain (0.6% margin) in 2022, according to financial documents published Feb. 28.

UPMC attributed the swing from operating income to loss to various factors, including increased labor and supply costs, increases in medical claims expense due to higher utilization and certain legal settlements. 

Revenue for the health system increased 8.5% year over year to $27.7 billion and expenses rose 10% to $27.9 billion. Under expenses, labor costs increased 6.4% to $9.7 billion and supply costs were up 11% to $7.4 billion.

After accounting for nonoperating items, such as investment returns, UPMC ended 2023 with a $31 million net loss, compared to a $1 billion net loss the previous year. 

As of Dec. 31, UPMC had more than $9.5 billion in cash and investments, $3.2 billion of which was held by its regulated health and captive insurance companies.

The Numbers Behind the Numbers

https://www.kaufmanhall.com/insights/thoughts-ken-kaufman/numbers-behind-national-hospital-flash-report

U.S. Hospital YTD Operating Margin Index November 2021-December 2023

The observations and questions from this chart are both interesting and required reading for hospital executives:

  • Why were hospitals profitable at the 4% plus level through the worst of the 2021 Covid period?
  • What exactly happened between December of 2021 and January of 2022 that resulted in a profitability decrease from a positive 4.2% to a negative 3.4%?
  • Despite the best efforts of hospital executives, overall operating margins were negative throughout calendar year 2022 and did not return to positive territory until March of 2023.
  • Hospital margins remained positive throughout 2023 and into 2024. However, overall margins have remained below those experienced in both 2021 and in the pre-Covid year of 2019.

The above questions and observations have proven interesting, and the ongoing numbers have proven quite useful in many quarters of healthcare. But recently I was talking with Erik Swanson, who is the leader of the Kaufman Hall Flash Report and our executive behind the data, numbers, and statistics. Erik and I were speculating about all of the above observations, but our key speculation was whether the 2023 operating margin results actually reflected a hospital financial turnaround or, in fact, were there “numbers behind the numbers” that told a different and much more nuanced story. So Erik and I asked different questions and took a much deeper dive into the Flash Report numbers. The results of that dive were quite telling:

  1. Too many hospitals are still losing money. Despite the fact that the Operating Margin Index median for 2023 and into 2024 was over 2%, when you look harder at the Flash Report data, you find that 40% of American hospitals continue to lose money from operations into 2024.
  2. There is a group of hospitals that have substantially recovered financially. Interestingly, the data shows over time that the high-performing hospitals in the country are doing better and better. They are effectively pulling away from the pack.
  3. This leads to the key question: Why are high-performing hospitals doing better? It turns out that several key strategic and managerial moves are responsible for high-performing hospitals’ better and growing operating profitability:
    • Outpatient revenue. Hospitals with higher and accelerating outpatient revenue were, in general, more profitable.
    • Contract labor. Hospitals that have lowered their percentage of contract labor most quickly are now showing better operating profitability.
    • An important managerial fact. The Flash Report found that hospitals with aggressive reductions in contract labor were also correlated to rising wage rates for full-time employees. In other words, rising wage rates have appeared to attract and retain full-time staff which, in turn, has allowed those hospitals to reduce contract labor more quickly, all of which has led to higher profitability.
    • Average length of stay. No surprise here. A lower average length of stay is correlated to improved profitability. Those hospitals that have hyper-focused on patient throughput, which has led to appropriate and prompt patient discharge, have also proven this to be a positive financial strategy.
  4. Lower financial performers have financially stagnated throughout the pandemic. The data shows that throughout the pandemic, hospitals with good financial results improved those results, but of more consequence, hospitals with poor financial performance saw that performance worsen. The Flash Report documents that the poorest financially performing hospitals currently show negative operating margins ranging from negative 4% to negative 19%. Continuation of this level of financial performance is not only unstainable but also makes crucial re-investment in community healthcare impossible.
  5. The urban hospital/rural hospital myth. A popular and often quoted hospital comparison is that there is an observable financial divide between urban and rural hospitals. Erik Swanson and I found that recent data does not support this common perception. When you compare “all rurals” to “all urbans” on the basis of average operating margin, no statistically significant difference emerges. However, what does emerge—and is a very important statistical observation—is that the lowest performing 20% of rural hospitals are, in fact, generating much lower margins then their urban counterparts this year. It is at this lowest level of rural hospital performance where the real damage is being done. 
  6. Rural hospitals and obstetrics. The data does confirm one very important American healthcare issue: Obstetrics and delivery services are one of the leading money losers of all hospital service offerings. And the data further confirms that rural hospitals are closing obstetric departments with more frequency in order to protect the financial viability of the overall rural hospital enterprise. This is a health policy issue of major and growing consequence.

The point here is that data, numbers, and statistics matter both to setting long-term social health policy agendas and to the strategic management of complex provider organizations. But the other point is that the quality and depth of the analysis is an equally important part of the process. A first glance at the numbers may suggest one set of outcomes. However, a deeper, more careful and penetrating analysis may reveal critical quantitative conclusions that are much more telling and sophisticated and can accurately guide first-class organizational decision-making. Hopefully the analytics here are a good example of this very point.

Financial distress increasingly prevalent in health system M&A deals

https://mailchi.mp/1e28b32fc32e/gist-weekly-february-9-2024?e=d1e747d2d8

This week’s graphic highlights data from Kaufman Hall’s recently released 2023 Hospital and Health System M&A Report on the current dynamics in health system mergers and acquisitions (M&A) activity.

After a slowdown during the pandemic, 2023 saw an uptick in M&A activity with 65 announced transactions, the most since 2020. Continuing the trend of the past two years, the number of announced “mega mergers,” in which the smaller party had at least $1B in annual revenue, represented more than a tenth of total announced transactions. 

However, the average size of mergers fell in 2023, as financial distress emerged as a key driver of M&A activity. The percent of mergers involving a financially distressed party spiked to nearly 28 percent in 2023, almost double the level seen in prior years. 

CARES Act funding had buoyed some health systems’ balance sheets through the pandemic, but with the end of federal aid, more systems needed to seek shelter through scale. 

With the median hospital operating margin still barely hitting two percent, we anticipate this heightened level M&A activity to continue in 2024 as health systems search for stronger partners that can help them stabilize financially. 

Fitch says lower operating margins may be the new normal for nonprofit hospitals

https://mailchi.mp/09f9563acfcf/gist-weekly-february-2-2024?e=d1e747d2d8

On Monday, Fitch Ratings, the New York City-based credit rating agency, released a report predicting that the US not-for-profit hospital sector will see average operating margins reset in the one-to-two percent range, rather than returning to historical levels of above three percent. 

Following disruptions from the pandemic that saw utilization drop and operating costs rise, hospitals have seen a slower-than-expected recovery.

But, according to Fitch, these rebased margins are unlikely to lead to widespread credit downgrades as most hospitals still carry robust balance sheets and have curtailed capital spending in response. 

The Gist: As labor costs stabilize and volumes return, the median hospital has been able to maintain a positive operating margin for the past ten months. 

But nonprofit hospitals are in a transitory period, one with both continued challenges—including labor costs that rebased at a higher rate and ongoing capital restraints—and opportunities—including the increase in outpatient demand, which has driven hospital outpatient revenue up over 40 percent from 2020 levels.

While the future margin outlook for individual hospitals will depend on factors that vary greatly across markets, organizations that thrive in this new era will be the ones willing to pivot, take risks, and invest heavily in outpatient services.