

Cartoon – Vote for Dave


Several factors will shape the financial performance of physician- and hospital-led organizations under total cost of care payment models.
Broad consensus has long existed among public- and private-sector leaders in US healthcare that improvements in healthcare affordability will require, among other changes, a shift away from fee-for-service (FFS) payments to alternative payment models that reward quality and efficiency. The alternative payment model that has gained broadest adoption over the past ten years is the accountable care organization (ACO), in which physicians and/or hospitals assume responsibility for the total cost of care for a population of patients.
Launched by the Centers for Medicare & Medicaid Services (CMS) Innovation Center in 2012, Pioneer ACO was the first such model design to generate savings for Medicare. In this incarnation, Medicare set a benchmark for total cost of care per attributed ACO beneficiary: If total cost of care was kept below the benchmark, ACOs were eligible to share in the implied savings, as long as they also met established targets for quality of care. If total cost of care exceeded the benchmark, ACOs were required to repay the government for a portion of total cost of care above the benchmark.
Payment models similar to the one adopted by Pioneer ACOs also have been extended to other Medicare ACO programs, with important technical differences in estimates for savings and rules for the distribution of savings or losses as well as some models offering gain sharing without potential for penalties for costs exceeding the benchmark. State Medicaid programs as well as private payers (across Commercial, Medicare Advantage, and Medicaid Managed Care) also have adopted ACO-like models with similar goals and payment model structures. Of the roughly 33 million lives covered by an ACO in 2018, more than 50 percent were commercially insured and approximately 10 percent were Medicaid lives.2
On the whole, ACOs in the Medicare Shared Savings Program (MSSP) have delivered high-quality care, with an average composite score of 93.4 percent for quality metrics. However, cost savings achieved by the program have been limited: ACOs that entered MSSP during the period from January 1, 2012 to December 31, 2014, were estimated to have reduced cumulative Medicare FFS spending by $704M by 2015; after bonuses were accounted for, net savings to the Medicare program were estimated to be $144M.3 Put another way, in aggregate, savings from Medicare ACOs in 2015 represented only 0.02 percent of total Medicare spending. The savings achieved were largely concentrated among physician-led ACOs (rather than hospital-led ACOs). In fact, after accounting for bonuses, hospital-led ACOs actually had higher total Medicare spending by $112M on average over three years.4
While savings from MSSP have been relatively limited, in aggregate, numerous examples exist of ACOs that have achieved meaningful savings—in some cases in excess of 5 percent of total cost of care—with significant rewards to both themselves as well as sponsoring payers (for example, Millennium, Palm Beach, BCBSMA AQC).5 6 7 The wide disparity of performance among ACOs (and across Medicare, Medicaid, and Commercial ACO programs) raises the question of whether certain provider organizations are better suited than others to succeed under total cost of care arrangements, and whether success is dictated more by ACO model design or by structural characteristics of participating providers.
In the pages that follow, we examine these questions in two ways. First, we analyze “the math of ACOs” by isolating four factors that contribute to overall ACO profitability: bonus payments, “demand destruction,” market share gains, and operating expenses. Following these factors, we illustrate the math of ACOs through modeling of the performance of five different archetypes: physician-led ACOs; hospital-led ACOs with low ACO penetration and low leakage reduction; hospital-led ACOs with high ACO penetration; hospital-led ACOs with high leakage reduction; and hospital-led ACOs with high penetration and leakage reduction.
In the pages that follow, we break down “the math of ACOs” into several key parameters, each of which hospital and physician group leaders could consider evaluating when deciding whether to participate in an ACO arrangement with one or more payers. Specifically, we measure the total economic value to ACO-participating providers as the sum of four factors: bonus payments, less “demand destruction,” plus market share gains, less operating costs for the ACO (Exhibit 1).
In the discussion that follows, we examine each of these factors and understand their importance to the overall profitability of ACOs, using both academic research as well as McKinsey’s experience advising and supporting payers and providers participating in ACO models.
The premise of ACOs rests on the opportunity for payers and participating providers to share in cost savings arising from curbing unnecessary utilization and more efficient population health management, thus aligning incentives to control total cost of care. Because ACOs are designed to reduce utilization, the bonus—or share of estimated savings received by an ACO—is one factor that significantly influences ACO profitability and has garnered the greatest attention both in academic research and in private sector negotiations and deliberations over ACO participation. Bonus payments made to ACOs are themselves based on several key design elements:
1a. Baseline and benchmark
Most ACO models are grounded in a historical baseline for total cost of care, typically on the population attributed to providers participating in the ACO. Most ACO models apply an annual trend rate to the historical baseline, in order to develop a benchmark for total cost of care for the performance period. This benchmark is then used as the point of reference to which actual costs are compared for purposes of determining the bonus to be paid.
Historical baselines may be based either on one year or averaged over multiple years in order to mitigate the potential for a single-year fluctuation in total cost of care that could create an artificially high or low point of comparison in the future. Trend factors may be based on historically observed growth rates in per capita costs, or forward-looking projections, which may depart from historical trends due to changes in policy, fee schedules, or anticipated differences between past and future population health. Trend factors may be based on national projections, more market-specific projections, or even ACO-specific projections. For these and other reasons, a pre-determined benchmark may not be a good estimate of what total cost of care would have been in the absence of the ACO. As a result, estimated savings, and hence bonuses, may not reflect the true savings generated by ACOs if compared to a rigorous assessment of what otherwise would have occurred.
Recent research suggests that an ACO’s benchmark should be set using trend data from providers in similar geographic areas and/or with similar populations instead of using a national market average trend factor.9 It has been observed in Medicare (and other) populations that regions (and therefore possibly ACOs) that start at a lower-than-average cost base tend to have a higher-than-average growth trend. For example, Medicare FFS spending in low-cost regions grew at a rate 1.2 percentage points faster than the national average (2.8 percent and 1.6 percent from 2013 to 2017 compound annual growth rate, respectively). This finding is particularly relevant in low-cost rural communities, where healthcare spending grows faster than the national average.10 Based on this research, some ACO models, such as MSSP and the Next Generation Medicare ACO model, have developed benchmarks based on blending ACO-specific baselines with market-wide baselines. This approach is intended to account for the differences in “status quo” trend, which sponsoring payers may project in the absence of ACO arrangements or associated improvements in care patterns. Some model architects have advocated for this provider-market blended approach to benchmark development because they believe such an approach balances the need to reward providers who improve their own performance with a principle tenet of this model: That ACOs within a market should be held accountable to the same targets (at least in the long term).
1b. Shared savings rate (and minimum savings/loss rates)
The shared savings rate is the percentage of any estimated savings (compared with benchmark) that is paid to the ACO, subject to meeting any requirements for quality performance. For example, an ACO with a savings rate of 50 percent that outperforms its benchmark by 3 percent would keep 1.5 percent of benchmark spend. Under the array of Medicare ACO models, the shared savings rate percentage ranges anywhere from 40 percent to 100 percent.11
In some ACO models, particularly one-sided gain sharing models that do not introduce downside risk, payers impose a minimum savings rate (MSR), which is the savings threshold for an ACO to receive a payout, typically 2 percent, but can be higher or lower.12 For example, assume ACO Alpha has a savings rate of 60 percent and MSR of 1.5 percent. If Alpha overperforms the benchmark by 1 percent, there would be no bonus payout, because the total savings do not meet or exceed the MSR. If, however, Alpha overperforms the benchmark by 3 percent, Alpha would receive a bonus of 1.8 percent of benchmark (60 percent of 3 percent). An MSR is common in one-sided risk agreements to protect the payer from paying out the ACO if modest savings are a result of random variations. ACOs in two-sided risk arrangements may often choose whether to have an MSR.
Both factors impact the payout an ACO receives. Between 2012 and 2018, average earned shared savings for MSSP ACOs were between $1.0M and $1.6M per ACO (between $10 and $100 per beneficiary).13 However, while nearly two out of three MSSP ACOs in 2018 were under benchmark, only about half of them (37 percent of all MSSP ACOs) received a payout due to the MSR.14
1c. Risk corridors
In certain arrangements, payers include clauses that limit an ACO’s gains or losses to protect against extreme situations. Caps depend on the risk-sharing agreement (for example, one-sided or two-sided) as well as the shared savings/loss rate. For example, MSSP Track 1 ACOs (one-sided risk sharing) cap shared savings at the ACO’s share of 10 percent variance to the benchmark, while Track 3 ACOs (two-sided risk sharing) cap shared savings at the ACO’s share of 20 percent variance to the benchmark and cap shared losses at 15 percent variance to the benchmark.15 In contrast with these Medicare models, many Commercial and Medicaid ACO models have applied narrower risk corridors, with common ranges of 3 to 5 percent. In our experience, payers have elected to offer narrower risk corridors. Their choice is based on their desire to mitigate risk as well as the interest of some payers (and state Medicaid programs) to share in extraordinary savings that may be attributable in part to policy changes or other interventions undertaken by the payers themselves, whether in coordination with ACOs or independent of their efforts.
Payers also may vary the level of shared savings (and/or risk), between that which applies to the first dollar of savings (versus benchmark) compared with more significant savings. For example, by applying a 1 percent adjustment or “haircut” to the benchmark, a payer might keep 100 percent of the first 1 percent of savings and share any incremental savings with the ACO at a negotiated shared savings rate. Depending on what higher shared savings rate may be offered in trade for the “haircut,” such a structure has the potential to increase the incentive for ACOs to significantly outperform the benchmark. For example, an ACO that beats the benchmark by 4 percentage points and earns 100 percent of savings after 1 percentage point would net 75 percent of total estimated savings. However, under the same risk model, if the ACO were to beat the benchmark by 2 percentage points, they would only earn 50 percent of total savings. Such a structure could therefore be either more favorable or less favorable than 60 percent shared savings without a “haircut,” depending on the ACO’s anticipated performance.
1d. Frequency of rebasing
In most ACO models (including those adopted by CMS for the Medicare FFS program), the ACO’s benchmark is reset for each performance period based (at least in part) on the ACO’s performance in the immediate prior year. This approach is commonly referred to as “rebasing.” The main criticism of this approach toward ACO model design—which is also evident in capitation rate setting for Managed Care Organizations—is that ACOs become “victims of their own success”: Improvements made by the ACO in one year lead to a benchmark that is even harder to beat in the following year. The corollary is also true: An ACO with “excessive” costs in Year 1 may be setting themselves up for significant shared savings in Year 2 simply by bringing their performance back to “normal” levels.
Even in situations where ACOs show steady improvements in management of total cost of care over several years, the “ratchet” effect of rebasing can have significant implications for the share of estimated savings that flow to the ACO. Exhibit 2 illustrates the shared savings that would be captured by an ACO, if it were to mitigate trend by 2 percentage points consistently for 5 years (assumes linear growth), under a model that provides 50 percent shared savings against a benchmark that is set with annual rebasing. In this scenario, although the ACO would earn 50 percent of the savings estimated in any one year (against benchmark), the ACO would derive only 16 percent of total savings achieved relative to a “status quo” trend.
Some ACO model designs (including MSSP) have mitigated this “ratchet” effect, to some extent, by using multi-year baselines, whereby the benchmark for a given performance year is based not on the ACO’s baseline performance in the immediate prior year but over multiple prior years. This approach smooths out the effect of one-year fluctuations in performance on the benchmark for subsequent years; by implication, improvements made by an ACO in Year 1 and sustained in Year 2 create shared savings in both years. Under a three-year baseline, weighted toward the most recent year 60/30/10 percent (as applies to new contracts under the MSSP), the ACO in Exhibit 2 would capture 22 percent of total estimated savings over 5 years. If the model were instead to adopt an evenly weighted three-year baseline, that same ACO would capture 28 percent over 5 years.
In select cases, particularly in the Commercial market, payers and ACOs have agreed to multi-year prospective benchmarks. Under this approach, the benchmark for performance Years 1 to 5 (for example) are set prospectively in Year 0; the benchmarks for Years 2 and 3, for example, are not impacted by the ACO’s performance in Year 1. If this approach were to be applied to the ACO depicted in Exhibit 2, they would earn fully 50 percent of the total savings, assuming that the prospectively established 5-year benchmark was set at the “status quo” trend line. While prospective multi-year benchmarks may be more favorable to ACOs, they also increase the sensitivity of ACO performance to both the original baseline as well as the reasonableness of the prospectively applied trend rate.
Key takeaways
While in many cases healthcare organizations are highly focused on the percent of shared savings they will receive (shared savings rate), in our experience, the financial sustainability of ACO arrangements may be equally or more greatly affected by several other design parameters outlined here, among them: the inclusion of an MSR or a “haircut” to benchmark, either of which may dampen the incentive to perform; benchmark definitions including the use of provider-specific, market-specific, and/or national baseline and trend factors; and the frequency of rebasing, as implied by the use of a single-year or multi-year baseline, or the adoption of prospectively determined multi-year benchmarks.
Although shared savings arrangements are meant to align providers’ incentives with curbing unnecessary utilization, the calculation of bonus payments based on avoided claims costs (as described in Section 1) does not account for the foregone provider revenue (and margins) attached to reductions in patient volume. The economic impact of this reduction in patient volume, sometimes referred to as “demand destruction,” is described in this section, which we address in two parts:
2a. Foregone economic contribution
Claims paid to hospital systems for inpatient, outpatient, and post-acute facility utilization typically comprise 40 to 70 percent of total cost of care, with hospital systems that own a greater share of outpatient diagnostic lab and/or imaging and/or skilled nursing beds falling at the upper end of this range. These same categories of facility utilization may comprise 60 to 80 percent of reductions in utilization arising from improvements in population health management by an ACO. Given the high fixed costs (and correspondingly high gross margins) associated with inpatient, outpatient, and post-acute facilities, foregone facility volume could come at an opportunity cost of 30 to 70 percent of foregone revenue—that opportunity cost being the gross contribution margin associated with incremental patient volume, calculated as revenue less variable costs: Commercially insured ACO populations are more likely to fall into the upper end of this range and Medicaid populations into the lower end. This is the reason savings rates tend to be higher in the Commercial market, to offset the larger (negative) financial impact of “demand destruction.”
For example, a hospital-led ACO that mitigates total cost of care by 3 percent (or $300 based on a benchmark of $10,000 per capita) might forego $180 to $240 of revenue per patient (assuming 60 to 80 percent of savings derived from hospital services), which may represent $90 to $120 in foregone economic contribution, assuming 50 percent gross margins. As this example shows, this foregone economic contribution may represent a significant offset to any bonus paid under shared savings arrangements, unless the shared savings percentage is significantly greater than the gross margin percentage for foregone patient revenue.
For some hospitals that are capacity constrained, the lost patient volume may be replaced (that is, backfilled) with additional patient volume that may be more or less profitable depending on the payer (for example, an ACO that backfills with more profitable Commercial patients). However, the vast majority of hospitals are not traditionally capacity constrained and therefore must look to other methods (for example, growing market share) to be financially sustainable.
In contrast, physician-led ACOs have comparatively little need to consider the financial impact of “demand destruction,” given that they never benefitted from hospitalizations and thus do not lose profits from forgone care. Furthermore, primary care practices may actually experience an increase, rather than decrease, in patient revenue, based on more effective population health management. Even for multi-specialty physician practices that sponsor ACO formation, any reductions in patient volume arising from the ACO may have only modest impact on practice profitability due to narrow contribution margins attached to incremental patient volume. Physician-led ACOs may need to be concerned with “demand destruction” only to the extent that a disproportionate share of savings is derived from reductions in practice-owned diagnostics or other high-margin services; however, the savings derived from such sources are typically smaller than reductions in utilization for emergency department, inpatient, and post-acute facility utilization.
2b. Spillover effects
Though ACOs are not explicitly incentivized to reduce total cost of care of their non-ACO populations (including FFS), organizations often see increased efficiency across their full patient population after becoming an ACO. For example, research over the last decade has found reductions in spend for non-ACO lives between 1 and 3 percent (Exhibit 3).

The impact of spillover effects on an ACO’s profitability depends on the proportion of ACO and non-ACO lives that comprise a provider’s patient panel. Further, impact also depends on the ACO’s ability to implement differentiated processes for ACO and non-ACO lives to limit the spillover of the efficiencies. Although conventional wisdom implies that physicians will not discriminate their clinical practice patterns based on the type of payer (or payment), nonetheless many examples exist of hospitals and other providers with the ability to differentiate processes based on payer or payment type. For example, many hospitals deploy greater resources to discharge planning or initiate the process earlier for patients reimbursed under a Diagnosis Related Group (case rate) than for those reimbursed on a per diem or percent of charges model. Moreover, ACOs and other risk-bearing entities routinely direct care management activities disproportionately or exclusively toward patients for whom they have greater financial accountability for quality and/or efficiency. For physician-led ACOs, differentiating resource deployment between ACO- and non-ACO populations may be necessary to achieve a return on investment for new care management or other population health management activities. For hospital sponsors of ACOs that continue to derive the majority of their revenue from FFS populations outside the ACO, differentiating population health management efforts across ACO and FFS populations are of paramount importance to overall financial sustainability. To the extent that hospital-led ACOs are unable to do so, they may find total cost of care financial arrangements to be financially sustainable only if extended to the substantial majority of their patient populations in order to reduce the severity of any spillover effects.
Key takeaways
The adverse impact of “demand destruction” is what most distinguishes the math of hospital-led ACOs from that of physician-led ACOs. The structure of ACO-sponsoring hospitals—whether they own post-acute assets, for example—further shapes the severity of demand destruction, which then provides a point of reference for determining what shared savings percentage may be necessary to overcome the impact of demand destruction. Though in the long term, hospitals may be able to right size capacity, in the near term when deciding to become an ACO, there is often limited ability to alter the fixed-cost base. Finally, the extent of “spillover effects” from the ACO to the non-ACO population further impacts the financial sustainability of hospital-led ACOs. Hospital-led ACOs can seek to minimize the impact through 1) differentiating processes between the two populations, and/or 2) transitioning the substantial majority of their patient population into ACO arrangements.
Providers can further improve profitability through market share gains, specifically:
3a. Reduced system leakage
ACOs can grow market share by coordinating patients within the system (that is, reduce leakage) to better manage total cost of care and quality. This coordination is often accomplished by improving the provider’s alignment with the referring physician; for example, ACOs can establish a comprehensive governance structure and process around network integrity, standardize the referral process between physicians and practices, and improve physician relationships within, and with awareness of, the network. Furthermore, ACOs can develop a process to ensure that a patient schedules follow-up appointments before leaving the physician’s office, optimizing the scheduling system and call center.
Stark Laws (anti-kickback regulations) have historically prevented systems from giving physicians financial incentives to reduce leakage. While maintaining high-quality standards, ACOs are given a waiver to this law and therefore are allowed to pursue initiatives that improve network integrity to better coordinate care for patients. In our experience, hospitals generally experience 30 to 50 percent leakage (Exhibit 4), but ACOs can improve leakage by 10 to 30 percent.

3b. Improved network status
In some instances for Commercial payers, an ACO may receive preferential status within a network by entering into a total cost of care arrangement with a payer. As a result, the ACO would see greater utilization, which will improve profitability. For example, in 2012, the Cooley Dickinson Hospital (CDH) and Cooley Dickinson Physician Hospital Organization, a health system in western Massachusetts with 66 primary care providers and 160 specialists, joined Blue Cross Blue Shield of Massachusetts’ (BCBSMA) Alternative Quality Contract (AQC), which established a per-patient global budget to cover all services and expenses for its Commercial population. As a result of joining the AQC, reducing the prices charged for services, and providing high quality of care, CDH was “designated as a high-value option in the Western Mass. Region,” which meant BCBSMA members with certain plans “[paid] less out-of-pocket when they [sought] care” at CDH.16 Other payers have also established similar mutually beneficial offerings to providers who assume more accountability for care.17 18 An ACO can benefit from these arrangements up until most or all other provider systems in the same market join.
Key takeaways
These factors to improve market share (at lower cost and better quality) can help an ACO compensate for any lost profits from “demand destruction” (foregone profits and spillover effects) and increased operating costs. The opportunity from this factor, which requires initiatives that focus on reducing leakage, can be the difference between a net-neutral hospital-led ACO and a significantly profitable ACO. An example initiative would be performance management systems that analyze physician referral patterns.
Finally, profitability is impacted by operating costs or any additional expenses associated with running an ACO. These costs generally are lower for physician-led ACOs than for hospital-led ACOs (and also depend on buy-versus-build decisions). In our experience, operating costs to run an ACO vary widely depending on the provider’s operating model, cost structure (for example, existing personnel, IT capabilities), and ACO patient population (for example, number and percent of ACO lives). However, we will focus on three specific types of costs:
4a. Care management costs
In our experience, care management costs to operate an ACO range from 0.5 to 2.0 percent of total cost of care for a given ACO population. These care management costs include ensuring patients with chronic conditions are continuously managing those conditions and coordinating with physician teams to improve efficacy and efficiency of care. A core lever of success involves reducing use of unnecessary care. ACOs that spend closer to 2 percent and/or those whose efforts focus on expanding care coordination for high-risk patients struggle to achieve enough economic contribution to break even. This is because care coordination (devoting more resources to testing and treating patients with chronic disease) often does not have a positive return on investment.19 ACOs that do this effectively and ultimately spend less on care management (around 0.5 percent of the total cost of care) tend to create value primarily through curbing unnecessary utilization and steering patients toward more efficient facilities rather than managing chronic conditions. This value creation is particularly true for Commercial ACO contracts, where there is greater price variation across providers compared with Medicare and Medicaid contracts, where pricing is standardized.
4b. Data and analytics operating costs
Data and analytics operating costs are critical to supporting ACO effectiveness. For example, high-performing ACOs prioritize data interoperability across physicians and hospitals and constantly analyze electronic health records and claims data to identify opportunities to better manage patient care and reduce system leakage. ACOs can either build or license data and analytics tools, a decision that often depends on the number of ACO lives. In our experience, an ACO that decides to build its own data and analytics solutions in-house will on average invest around $24M for upfront development, amortized over 8 years for $3M per year, plus $6M in annual costs (for example, using data scientists and analysts to generate insights from the data), for a total of $9M per year. Alternatively, ACOs can license analytics software on a per-patient basis, typically costing 0.5 to 1.5 percent of the total cost of care. Thus, we find the breakeven point at around 100,000 covered ACO lives; therefore, it often makes financial sense for ACOs with more than 100,000 lives to build in-house.
4c. Additional administrative costs
Organizations must also invest in personnel to operate an ACO, typically including an executive director, head of real estate, head of care management, and lawyers and actuaries. The ACO leadership team’s responsibilities often include setting the ACO’s strategy (for example, target markets, lines of business, services offered, through which physicians and hospitals) and developing, managing, and communicating with the physician network to support continuity of care.
Key takeaways
Operating costs to run an ACO are significant. Ability to find ways to invest in fixed costs that are more transformational in nature may result in lower near-term profitability but can provide a greater return on investment in the long term both for the ACO and the rest of the system. The decision to make these investments is dependent on the number of lives covered by an individual ACO.
Drawing on the analysis outlined above, we conducted scenario modeling of “the math of ACOs” using five different ACO archetypes, which vary in structure and performance under a common set of rules. These five archetypes include:
Subsequently, taking an ACO’s structure as a given, we describe for each ACO archetype the key model design parameters and other strategic and operational choices that ACOs might make to maximize their performance.
Summarizing the four factors, the profitability of each archetype reveals certain insights (Exhibit 5).


With the coronavirus still spreading widely, it’s time to start thinking seriously about influenza, which typically spreads in fall and winter. A major flu outbreak would not only overwhelm hospitals this fall and winter, but also likely overwhelm a person who might contract both at once.
Doctors have no way of knowing yet what the effect of a dual diagnosis might be on a person’s body, but they do know the havoc that the flu alone can do to a person’s body. And, we know the U.S. death toll of COVID-19 as of Aug. 17, 2020 was 170,000, and doctors are learning more each day about the effects of the disease on the body. Public health officials in the U.S. are therefore urging people to get the flu vaccine, which is already being shipped in many areas to be ready for September vaccinations.
Flu cases are expected to start increasing early in October and could last late into May. This makes September and early October the ideal time to get your flu shot.
But there’s reason to be concerned that flu vaccination rates could be lower this year than in past years, even though the risk of getting seriously ill may be higher because of widespread circulation of the coronavirus.
In an effort to avoid getting sick, millions of Americans avoided seeing their health care provider the past few months. Social distancing and stay-at-home orders have resulted in a decreased use of routine medical preventive services such as vaccinations. Many employers that often provide the flu shot at no cost to employees are allowing employees to work from home, potentially limiting the number of people who will get the flu shot at their jobs.
As a health care professional, I urge everyone to get the flu vaccine in September. Please do not wait for flu cases to start to peak. The flu vaccine takes up to two weeks to reach peak effectiveness, so getting the vaccine in September will help provide the best protection as the flu increases in October and later in the season.
Both COVID-19 and the flu are contagious respiratory illness that present with similar symptoms. Both viruses can impact the elderly and those with certain chronic conditions, such as heart and lung disease, the hardest.
Data on flu vaccination rates from 2018-2019 show that only 49% of Americans six months of age and older received the flu vaccine. The vaccine’s effectiveness varies each season, with early data from the 2019-2020 flu season indicating a vaccine effectiveness rate of 50% overall, and 55% in youth.
While some may think this effectiveness rate is low, the flu vaccine remains the single best way to prevent the flu and related complications. For example, during the 2018-2019 flu season, flu vaccination was estimated to prevent 4.4 million flu illnesses, 58,000 flu hospitalizations and 3,500 deaths. Early data from the 2019-2020 flu season estimates there were 39-56 million flu illnesses, 18-26 million flu-related medical visits, 410-740,000 hospitalizations and up to 62,000 deaths. Much of this disease burden is preventable from higher flu vaccination rates.
It is now quite apparent that COVID-19 will still be circulating during flu season, which makes getting a flu vaccine more important than ever. As schools, our communities and our economy continue to reopen, it is vital to get the flu vaccine for personal, family and community protection.

A flu camp in Lawrence, Maine during the 1918 influenza pandemic. Nurses and doctors tried desperate measures to stop the spread of the disease, which ultimately killed more than 675,000 people in the U.S. alone. Bettmann/Getty Images
Severe cases of both COVID-19 and the flu require the same lifesaving medical equipment. This highlights the importance of getting the flu vaccine for not only your own personal health but also the health of your community. Receiving the flu vaccine will help reduce the burden of respiratory illness on our already very overstretched health care system. By increasing flu vaccination rates, we can reduce the overall impact of respiratory illnesses on the population and hence lower the resulting burden on the health care system during the COVID-19 pandemic.
Because flu vaccination protects against one of these respiratory illnesses, the CDC recommends everyone (with few exceptions) six months of age and older get an annual flu vaccine. While the flu vaccine will not protect you against COVID-19, the flu vaccine will reduce your risk of developing the flu as well as reduce your risks of flu-related complications including hospitalization and even death.
While it may seem like there is so much out of our control during this pandemic, getting the flu vaccine, practicing proper hand washing, social distancing and wearing face coverings are within our control and will protect not only you but also your family and community.
If you are not getting the flu vaccine from your employer, think about alternative sources now. Vaccines should be available in most areas by Sept. 1.
Mainly, make sure you take advantage of this potentially lifesaving vaccine. Get it on your calendar for early September now. And remember, the flu shot cannot give you the flu.

The time is now! Voting in the presidential election will begin in many states in just a few weeks – as early as Sept. 4 in North Carolina. Every state’s regulations and procedures are different, so it is vital that you understand the requirements and opportunities to vote where you live.
Here’s how to make sure you’re ready to vote, and that your vote will count.
Make sure that you are registered to vote at your current address. You may not have voted in a while. You may have moved or changed your name. You may have forgotten when you last registered to vote. Calling or visiting your secretary of state’s office or local Board of Elections may be a good place to start.
You can also visit Vote.org, Rock the Vote, I am a voter or the U.S. Vote Foundation, all nonprofit, nonpartisan websites providing lots of detailed information about voting rights, registration and the process of voting. It took only a few minutes online for me to verify my own registration and voter ID number.
The federal government offers lots of useful voting information, too.
If you’re not registered – whether you have never registered or your registration is out of date – there is still time. September 22 is National Voter Registration Day, when millions of individuals register to vote.
Each state has its own process and deadlines, and you may be able to register online through Vote.org, which can take less than two minutes.
If you’d rather register to vote on paper, download and print a simple form from the federal government, which asks you to provide some personal information, like your name and address. The instructions give state-specific details and provide the mailing address you need to send the form to.
While you’re at it, encourage your friends to register too.
Not everyone who is registered to vote actually casts a ballot. You’re more likely to actually vote if you make a plan.
You’ll need to find out when to vote in person and where to do it. Election Day is Tuesday, Nov. 3, 2020 – but different cities and towns have different voting hours. Many communities have several polling places, and you need to go to the right one, depending on where you live. Make sure you know where to go.
In some places you can vote in person for some number of days ahead of Election Day, often at the main municipal government building. Your town office – and its website – will likely have the dates and location information prominently displayed.
If you don’t want to vote in person, either because of your work or personal schedule, or because of the pandemic, think about voting by mail. Some states will mail you a ballot automatically, either because they conduct their elections by mail or because they have made special provisions to do so as a result of the pandemic. In other states you have to request one – and sometimes you need to provide a specific excuse for wanting to avoid in-person voting.
If you’re voting by mail, you may need to pay postage to send your ballot back in. Call your local election office and ask how much you’ll need – and get the right postage. You can order postage online for free delivery – and splitting the cost of a book of stamps is another great opportunity to share voting with a friend.
In 2016, nearly one-quarter of U.S. votes were cast by mail. Research and evidence show that it is safe and reliable – though with large numbers of people expected to vote by mail this year, it’s best to mail your ballot back as early as possible to make sure it has plenty of time to arrive before it needs to be counted. The U.S. Postal Service recommends mailing your ballot at least a week before the deadline.
Large amounts of mail also might mean you don’t get your ballot in the mail until just before the election. If it arrives with less than a week to go, call your local Board of Elections or municipal clerk immediately to find out what your options are. You may be able to drop off the ballot rather than mailing it in, and you should also still have the option to vote in person, either on or before Election Day.
If you’re worried about the safety of voting by mail, there are plenty of administrative and legal protections for mailed-in ballots, and steep penalties for those who tamper with election mail.
Many people set reminders for all sorts of important things: medical appointments, friends’ birthdays, bill payment dates and so on. Add voting to your calendar – including alerts to request a mail-in ballot, to vote early, to mail your ballot and certainly for Election Day itself.
Every vote that is cast is a vital contribution to the nation’s future. Encourage everyone you know to vote. You can even invite people to your calendar events – or share your plans on social media, in an email to family and friends. Send texts to people you know. Pledge to call 10 people and ask them to vote, and ask each of them to call 10 more people.
If you make your plan and follow the requirements of your state and local government, you can cast your ballot and be certain that your vote will count.
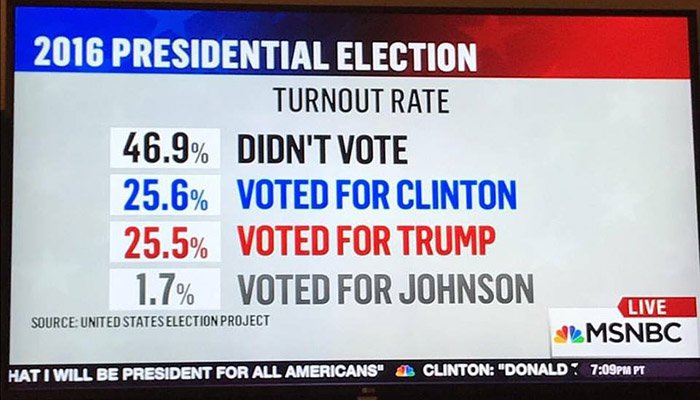
You may encounter people claiming there could be “widespread” voter fraud or that the election is somehow “rigged.” But the biggest problem is that so few people actually vote: In 2016, 40% of eligible American voters didn’t cast a ballot.
It is your right to vote. Exercise that right proudly and make your voice heard.


Providence, a 51-hospital system based in Renton Wash., received $651 million in federal grants in the first half of this year, but it wasn’t enough to offset the system’s losses tied to the COVID-19 pandemic.
The health system reported revenues of $12.5 billion in the first six months of this year, down from $12.6 billion in the same period a year earlier, according to financial documents released Aug. 17. Though the health system reported a rebound in patient volumes after the suspension of non-emergency procedures in March and April, net patient service revenue was down 10 percent year over year.
Providence’s expenses also increased. For the first two quarters of this year, the health system reported operating expenses of $12.7 billion, up 3 percent year over year. The increase was attributed to higher labor costs and increased personal protective equipment and pharmaceutical spend.
Reduced patient volumes combined with increased costs drove an operating loss of $221 million in the first half of this year. In the first half of 2019, Providence reported operating income of $250 million.
After factoring in nonoperating items, Providence ended the first six months of 2020 with a net loss of $538 million, compared to net income of $985 million in the same period of 2019.
To help offset financial damage, Providence received $651 million in federal grants made available under the Coronavirus Aid, Relief and Economic Security Act.
“We knew we were in for a marathon the moment we admitted our first patient with COVID-19 seven months ago,” Providence President and CEO Rod Hochman, MD, said in an earnings release. “Our caregivers have been on the front lines ever since, and we are incredibly proud and grateful for all they are doing to serve our communities during the greatest crisis of our lifetime.”
In its earnings release, Providence mapped out a three-part plan for the future. As part of that plan, the system said it is focused on improving testing capacity and turnaround times and advancing clinical research and best practices in the treatment of COVID-19. The system is also revising its operating model and cost structure.

The results of a survey completed by 1,500 of Beaumont Health’s 5,000 physicians revealed a lack of confidence in the Southfield, Mich.-based system’s leadership and concern about its proposed merger with Advocate Aurora Health, according to Crain’s Detroit Business.
Crain’s reported the results of the survey after the results were presented to Beaumont’s board. The system confirmed this week that it is postponing a vote on the planned merger with Advocate Aurora until physician grievances are addressed.
The survey asked physicians to indicate whether they agreed or disagreed with several statements. Seventy-six percent of the physicians who answered the survey said they strongly or somewhat disagree with the statement “I have confidence in corporate leadership,” while 13 percent said they strongly or somewhat agree and 11 percent said they neither agree nor disagree, according to Crain’s.
Physicians were also asked about the proposed merger with Advocate Aurora, which has dual headquarters in Milwaukee and Downers Grove, Ill. According to Crain’s, 70 percent of physicians said they strongly or somewhat disagree with the following statement: “The proposed merger with Advocate Aurora Health is likely to enhance our capacity to provide compassionate, extraordinary care.” Nine percent of physicians said they somewhat or strongly agree with the statement and 21 percent said they neither agree nor disagree, according to the report.
In a statement to Becker’s Hospital Review, Beaumont said it is working to address the physicians’ concerns.
“Our physicians provided valuable input and feedback to us through the survey,” the health system said. “We take our physicians’ responses seriously and we have already started addressing many of their concerns. We know our talented and skilled physicians, nurses and staff have helped to make Beaumont the region’s leading health system and they are also key to our future. Our caregivers truly live our mission of providing compassionate, extraordinary care, every day. We recognize the importance of having an open dialogue. That’s why we continue to meet with numerous groups of physicians, nurses and staff to listen to them, address their concerns and work together with them to determine the best path forward for Beaumont.”
Beaumont and Advocate Aurora signed a nonbinding letter of intent in June to create a health system spanning Michigan, Wisconsin and Illinois. The merger would create a $17 billion system with 36 hospitals.
Martina Navratilova was once asked,
“How do you maintain your focus, physique and sharp game even at the age of 43?”

She gave a humble reply, “The ball doesn’t know how old I am”. You need to stop yourself from stopping yourself.
Every game in life is actually played on a 6-inch ground – the space between your two ears.
We don’t live in bungalows, duplexes, or flats. We live in our mind which is an unlimited area. Life is great when things are sorted and uncluttered there. Keeping the mind messy with hatred growing on the table, regrets piling up in the corner, expectations boiling in the kitchen, secrets stuffed under the carpet, and worries littered everywhere ruin this real home.
The key factor to performing well in life and in every arena is the ability to control the quality and quantity of your “internal dialogue”.
Performance is potential minus internal interference.

Live in peace, not in pieces.


