
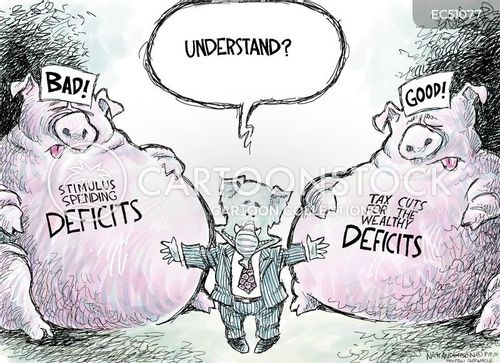
Cartoon – Deficit Expansion


https://www.kaufmanhall.com/insights/article/key-principles-proactive-management-patient-denials

The proliferation of claims denials, especially by Medicare Advantage payers, has become a pressing issue for health system operations. In 2023, Medicare Advantage insurers fully or partially denied 3.2 million prior authorization requests—or 6.4% of all requests, according to a Kaiser Family Foundation (KFF) report.
The growth in denials can be partially explained by the increasing popularity of managed Medicare and Medicaid plans, but evolving payer practices, including the adoption of AI for algorithmic denials, have also contributed. Claims denials have emerged as one of the key points of payer-provider tension, and an effective claims denials management and prevention program is a powerful way for health systems to rebalance their payer relationships.
Denied claims result in reduced reimbursement, added administrative burdens, and patient and provider frustrations. Even when denials are successfully appealed and reversed—the KFF report found that in 2023, 82% of Medicare Advantage denials were partially or fully overturned—the time and resources devoted to the appeals process add to the costs of providing healthcare services. Optimizing pre-billing activities to reduce avoidable denials and improve and streamline the patient experience of care is as essential for health systems as a robust appeals strategy. This article addresses critical success factors for both preventing and appealing denials.
Successfully preventing denials requires a centralized program across the workforce, from frontline providers to clinical and revenue cycle staff, to manage pre-bill activities by focusing on identifying the correct patient insurance information, obtaining accurate authorizations, and preventing concurrent denials while the patient is still in the facility. Utilization review nurses, attending providers, and Physician Advisors should be attentive to documenting the full state of patient acuity, while collaborating with the revenue cycle team. This team should focus on the collection and reporting of medically necessary data and documentation, which serves as the evidence payers use to evaluate prior authorization requests. When information about a patient’s condition isn’t recorded, or acknowledged in an authorization request, unnecessary denials can result.
A successful denials prevention program expands beyond the utilization management (UM) team and includes revenue cycle, and provider collaboration. Revenue cycle pre-service procedures should focus on confirming insurance benefits and securing payer authorization for planned services while collaborating with UM and referral sources. A comprehensive and proactive denials prevention program helps conveys to payers the full extent of inpatient clinical work, thanks to a collaborative effort to improve documentation.
The following list can help organize denials prevention programs across all locations, clinics and practices:
A strong denials management and prevention program should include a robust post-bill appeals program with skilled coding, clinical and technical resources. A targeted and strategic appeal process can result in improved overturn rates and increased reimbursement. Appeal letters which are supported by clinical facts, payer policies, and a summary of key components relevant to each case and the associated denial increase the likelihood of success.
Components of the appeal program should include the following:
The collaboration with managed care is vital to the success of the denials management/prevention program. A formal payer escalation process which facilitates transparency between the payer and provider can result in improved relations and a reduction in initial denials. Successful denials management/prevention payer escalation programs are strategic and focus on addressing unfair/incorrect denials and establishing clear bi-directional reporting and communications. These programs can result in improved contract negotiations and reduce incorrect denials.
Artificial Intelligence (AI) can support the post-bill appeals process and can be especially relevant when developing a strategy to combat denials. Not only are payers increasingly using AI to trigger denials, but health systems can also deploy AI to write appeal letters, analyze denial trends, and summarize medically necessary documentation. Although algorithmic denials have become a source of frustration for providers and patients, health systems can also deploy AI to their defense. While payers are often better positioned to devote AI resources to claims, a little bit of investment from health systems, deployed effectively, can go a long way toward evening the playing field.
A formal denials management and prevention program is essential to obtaining proper reimbursement for the care provided and reducing rework across the enterprise. A strong program should also improve the patient’s experience of care: ideally, a patient should not need to interact with or hear from their provider between scheduling an appointment and checking in.
Denials management and prevention programs should be led by multi-disciplinary committees and focus on reducing avoidable denials and rework. Reducing denials requires the implementation of a multi-disciplinary program and collaboration between UM, revenue cycle, clinical documentation improvement, managed care, clinical operation and providers.
Health systems reassessing their claims denials program should consider these questions:
https://www.kaufmanhall.com/insights/infographic/state-trust-public-health-america
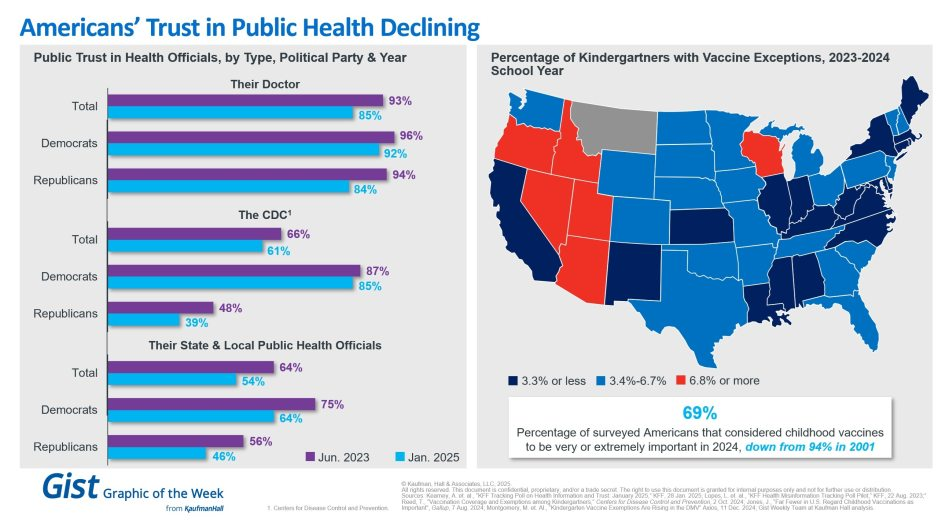
In light of the recent confirmation of Secretary Kennedy to lead HHS and new survey data on trust in public health, this graphic highlights Americans’ declining positive perception of public health officials. Among respondents’ personal doctors, the CDC and their state and local public health officials, trust in all three, regardless of political identification, has decreased from June 2023 to January 2025.
Respondents trusted their doctors more than public health officials, and there is less difference by political identification. In 2025, only 61% of surveyed Americans reported that they trusted the CDC. That prevalence drops to 39% among Republicans and increases to 85% among Democrats.
Another important public health indicator, the percentage of kindergarteners with vaccine exemptions, also illustrates the challenging place in which public health officials find themselves. During the 2023-2024 school year, about 3.3% of kindergartners received an exemption, an increase from 2022-2023 that still does not provide a complete picture. Exemption rates vary widely by state, with 6 states having exemption rates more than double the median. These differences are a reflection of how easy it is to receive an exemption in some states rather than a clear trend.
The shift also underscores how easily an outbreak could occur in some states. Alarmingly, the perceived importance of vaccines has dramatically decreased, from 94% in 2001 to 69% in 2024.
We will have to wait and see what Kennedy, long considered a vaccine skeptic, does regarding vaccines, but amid immense distrust in the healthcare system, providers’ role of giving thorough, honest information to their patients is more important than ever.

On January 17, 2025, a list of potential cost reductions to the federal budget was released by Republicans on the House Budget Committee. The list is long and covers the federal budget waterfront, but it spends considerable time focusing on reductions to healthcare spending. This laundry list of cost reductions is important because the highest priority of the Trump administration is a further reduction in federal taxes. A reduction in taxes would, of course, reduce federal revenue; if federal expenses are not proportionately reduced then the federal deficit will increase. When the deficit increases then the federal debt must increase and at that point the overall impact on the American economy becomes concerning and possibly damaging. There has already been much public speculation as to how the Federal Reserve might react to such a scenario.
It is not possible right now to highlight and describe all of the House budget proposals, but one proposal absolutely stands out: The suggestion to eliminate the tax-exempt status for interest payments on all municipal bonds, or potentially in a more targeted manner, for private activity bonds, including those issued by not-for-profit hospitals. Siebert Williams Shank, an investment banking firm, described the elimination of tax exemption for municipal bonds as “the most alarming of the proposed reforms impacting non-profit and municipal issuers.”[1] This is certainly true for hospitals, since over the past 60 years the growth and capability of America’s hospitals has been substantially constructed on the foundation of flexible and relatively inexpensive tax-exempt debt. Given all of this, it is not too early to begin speculating on the impact of the elimination of tax-exempt debt on hospital finances and strategy.
We should also point out that a separate topic is under discussion, related to the potential loss of not-for-profit status for hospitals and health systems. Such a maneuver could potentially expose hospitals to income taxes, property taxes, and higher funding costs. For now, that is beyond the scope of this blog but may be something we write about in future posts.
Below is a series of important questions related to the elimination of tax-exempt financing and some speculations on the overall impact:
Let’s indulge in one last bit of speculation. What is the probability that Congress will pass legislation that eliminates tax-exempt financing? Sources in Washington tell us that it is premature to wager on any of the items put forth by the Budget Committee. And it should be noted that over the years the elimination of tax-exempt financing has been proposed on several occasions and never advanced in Congress. However, one well-informed source noted that as the tax and related legislation moves forward, there is likely to be significant horse-trading (especially in the House) to secure the necessary votes to pass the entire package. What happens during that horse-trading process is anybody’s guess. So the best advice to our hospital readership right now is to not take anything for granted. But be absolutely assured that the maintenance of tax-exempt financing is an essential strategic component for the successful future of America’s hospitals.

For the past six years, Kaufman Hall has been publishing its monthly National Hospital Flash Report, which is designed to provide a pulse on the health of the healthcare industry and to highlight meaningful and pertinent trends for hospital and health system leaders. The data that powers the report is taken from over 1,300 hospitals, which are reflective of all geographic locations, hospital sizes and types. To ensure the content is digestible and understandable, Kaufman Hall aggregates the data into larger cohorts and measures a select set of key metrics that are most important for understanding the health of the industry. Industry groups and system leaders use these reports both for peer review purposes but also to paint an overall story for their boards and communities.
Through a detailed review of the Flash Report data, each month Kaufman Hall develops findings that healthcare leaders may find instructive as they determine how to adjust to changing market conditions. In 2024 it was reasonably obvious that there was a widening divide between the highest performing hospitals and the lowest performers. While a significant cadre of hospitals and health systems have recovered to pre-Covid financial success, 37% of American hospitals continue to lose money.
We are often asked what the successful hospitals are doing—and importantly—what the data tell us about those that are less successful. Using 2024 data, we have drawn two important conclusions around the role of leading management teams and what separates their organizations from others.
These teams have:
It turns out that current data demonstrate that the management of departmental performance is critical to overall hospital financial performance but in a more nuanced manner than expected.
Our analysis was conducted as follows:
The findings demonstrate that organizations with top financial performance have departmental results that look like a normal curve around the median. Said more simply, in top-performing hospitals the number of lower-performing departments is roughly equal to the number of higher-performing departments, with most departments operating near the national departmental medians. In contrast, hospitals with the lowest financial performance show a much greater number of departments operating with high cost per units of service and a few departments that operate extremely efficiently.
It appears that poorer performing hospitals focus on the management of the largest clinical and nursing areas. These are the departments that tend to be the “easiest” to manage because they are the “easiest” to benchmark. But the data show that these same hospitals tend to have poor performance over the remainder of the departments, which leads to poor financial results for the total hospital.
Hospitals with top quartile financial performance tend to manage all departments as close to the benchmark median as possible. Such a result means spending more managerial time on the harder to manage departments, especially those departments that are more “unique” and where overall performance is harder to characterize and benchmark.
The observations that can be drawn here are important and as follows:
The data suggest a perhaps unexpected operational conclusion. The achievement of median national departmental benchmarks is leading to overall positive hospital financial operating margins. This outcome offers significant budgeting advice and over the course of a fiscal year should prove to be a remarkably useful administrative lesson.
Given the growing costs of shared services and related overhead, Kaufman Hall wanted a closer look at how well hospital organizations were scaling shared service costs related to the organization’s size. Unexpectedly, shared service costs were not highly correlated to the size of the hospital or hospital system. This suggests that the management of shared service costs on a per unit basis is difficult and that this aspect of expense management requires diligent focus to enact and sustain cost change. Our data often indicates a wide variation of cost performance among shared services of similar types within different large organizations. This suggests that standardization of such services is not well developed and that there may be a certain level of wishful thinking that increases in organizational size will automatically correlate to lower per unit costs.
The data did indicate, however, that larger organizations can achieve higher performance over smaller organizations relative to shared service expenses. This is an indication that size can be leveraged for superior performance but that such results are not automatic. The takeaway here is that the total spend for shared service functions is very substantial and growing. In that regard, it is most important to proactively address expenses in these areas, build appropriate management plans, and understand how to focus on the right buttons and levers. To the extent that organizations are assuming that growth (both organic and inorganic) will create economies of scale with the overall shared service apparatus, the data demonstrate that such an outcome is possible but only with strong planning and execution.
Operating hospitals in 2025 is flat-out hard and likely to get harder over the year. Hospital executives right now should use every managerial advantage available. A close look at the National Hospital Flash Report data identifies important relationships that provide for a more nuanced and sophisticated operation of both individual departments and the bundle of shared services. The data clearly demonstrate that better results in both these areas will lead to improved financial performance within the hospital overall. The data also indicate key managerial strategies that will lead to such improvement.

Tonight at midnight, thousands of federal workers face the possibility their jobs will be eliminated as part of the Department of Government Efficiency (DOGE) federal cost reduction initiative under Elon Musk’ leadership. Already, thousands who serve in federal healthcare roles at the NIH, CDC and USAID have been terminated and personnel in agencies including CMS, HHS and the FDA are likely to follow.
The federal healthcare workforce is large exceeding more than 2.5 million who serve agencies and programs as providers, clerks, administrators, scientists, analysts, counselors and more. More than half work on an hourly basis, and 95% work outside DC in field offices and clinics. For the vast majority, their work goes unnoticed except when “government waste” efforts like DOGE spring up. In those times, they’re relegated to “expendables” status and their numbers are cut.
The same can be said for the larger private U.S. healthcare workforce. Per the U.S. Bureau of Labor Statistics, industry employment was 21.4 million, or 12.8% of total U.S. employment in 2023 and is expected to reach 24 million by 2030. It’s the largest private employer in the U.S. economy and includes many roles considered “expendable” in their organizations.
Facts about the U.S. healthcare workforce:
| % 2023 | ‘19-‘23 | ’23 Rank | % 2023 | ‘19-‘23 | ’23 Rank | ||
| Nurses | 78 | -7 | 1 | Pharmacists | 55 | -9 | 6 |
| Dentists | 59 | -2 | Psychiatrists | 36 | -7 | 9 | |
| Medical doctors | 56 | -9 | 5 | Chiropractors | 33 | -8 | 10 |
The Perfect storm
The healthcare workforce is unsteady: while stress and burnout are associated with doctors and nurses primarily, they cut across every workgroup and setting.
Eight fairly recent issues complicate efforts to achieve healthcare workforce stability:
Increased costs of living:
Consumers are worried about their costs of living: it hits home hardest among young, low-income households including dual eligible seniors for whom gas, food and transportation are increasing faster than their incomes, and rents exceed 50% of their income. The healthcare workforce takes a direct hit: one in five we employ cannot pay their own medical bills.
Slowdown in consolidation:
The Federal Trade Commission’s new pre-merger notification mandate that went in effect today essentially requires greater pre-merger/acquisition disclosures and a likely slowdown in deals. Organizations anticipating deals might default to layoffs to strengthen margins while the regulatory consolidation dust settles. Expendables will take a hit.
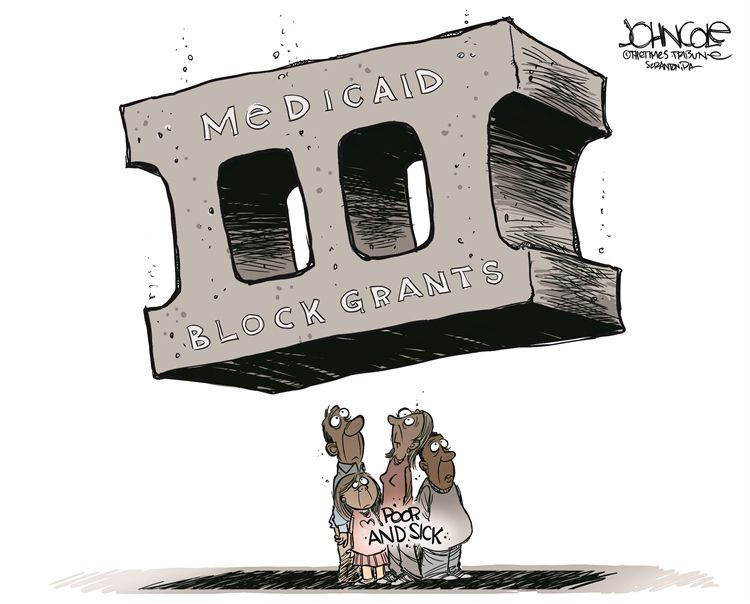
Uncertainty about Medicaid cuts:
In the House’ budget reconciliation plan, Medicaid cuts of up to $880 billion/10 years are contemplated. A cut of that magnitude will accelerate closure of more than 400 rural hospitals already at risk and throw the entire Medicaid program into chaos for the 79 million it serves—among them 3 million low-hourly wage earners in the healthcare workforce and at least 2 million in-home unpaid caregivers who can’t afford paid assistance. The impact of Medicaid cuts on the healthcare workforce is potentially catastrophic for their jobs and their health.
Heightened attention to tax exemptions for not-for-profit hospitals:
Large employers sent this recommendation to Congressional leaders last week as spending cuts were being considered: “Nonprofit hospitals, despite their tax-exempt status, frequently prioritize profits over patient care. Many have deeply questionable arrangements with for-profit entities such as management companies or collections agencies, while others have “joint ventures” with Wall Street hedge funds or other for-profit provider or staffing companies. Nonprofit hospitals often shift the burden of their costs onto taxpayers and the communities they serve by overcharging for health care services, or abusing programs intended to provide access to low-cost care and prescription drugs for low-income patients. By eliminating nonprofit hospital status, resources could be more evenly distributed across the healthcare system, ensuring that hospitals are held accountable for their charitable care both to their communities and the tax laws that govern them.” Pressures on NFP hospitals to lower costs and operate more transparently are gaining momentum in state legislatures and non-healthcare corporate boardrooms. Belt tightening is likely. Layoffs are underway.
Heightened attention to executive compensation in healthcare organizations:
Executive compensation, especially packages for CEO’s, is a growing focus of shareholder dissent, Congressional investigation, media coverage and employee disgruntlement. Compensation committee deliberations and fair market comparison data will be more publicly accessible to communities, rank and file employees, media, regulators and payers intensifying disparities between “labor” and “management”.
Increased tension between providers and insurers:
Health insurers are now recovering from 2 years of higher utilization and lower profits; hospitals did the same in 2022 and 2023. Neither is out of the woods and both are migrating to tribal warfare based on ownership (not-for-profit vs. investor owned vs. government owned), scale and ambition. Bigger, better-capitalized organizations in their ranks are faring better while many struggle. The workforce is caught in the crossfire.
Increased pressure on private equity-backed employers to exit:
The private equity market for healthcare services has experienced a slow recovery after 2 disappointing years peppered by follow-on offerings in down rounds. Exit strategies are front and center to PE sponsors; workforce stability and retention is a means to an end to consummate the deal—that’s it.
The AI Yellow Brick Road:
Last and potentially the most disruptive is the role artificial intelligence will play in redefining healthcare tasks and reorganizing the system’s processes based on large-language models and massive investments in technology. Job insecurity across the entire healthcare workforce is more dependent on geeks and less on licensed pro’s going forward.
These eight combine to make life miserable most days in health human resource management. DOGE will complicate matters more. It’s a concern in every sector of healthcare, and particularly serious in hospitals, medical practices, long-term and home care settings.
‘Modernizing the healthcare workforce’ sounds appealing, but for now, navigating these issues requires full attention. They require Board understanding and creative problem-solving by managers. And they merit a dignified and respectful approach to interactions with workers displaced by these circumstances: they’re not expendables, they’re individuals like you and me.
