Jaime King On Consolidation and Competition — The Trials and Triumphs of Health Care Antitrust Law New England Journal of Medicine March 18, 2023; 388:1057-1060 DOI: 10.1056/NEJMp2201629
“Over the past 30 years, health care consolidation has gone largely unchecked by federal and state antitrust enforcers, which has resulted in higher prices, stagnant quality of care, and limited access to care for patients. Similarly, consolidation has contributed to the availability of fewer employment options, limited wage growth, longer hours, and staff shortages for health care providers.
Antitrust law is designed to prevent such harms, but its failure to evolve alongside the health care industry has led to pervasive consolidation, which now necessitates regulation in some markets to address market-power abuses that competitive forces can no longer govern…
Although mergers are often justified with promises of improved quality or patient access, evidence supporting these claims is lacking.
Clinical integration as envisioned in accountable care organizations, for example, requires substantial oversight, training, and investment that goes well beyond the financial integration involved in most mergers. Most studies have found either no changes or a reduction in quality after provider mergers. Consolidation can also limit access to care; post-merger facility closures, reductions in charity care, and elimination of abortion and other reproductive health services have often occurred.
Consolidation among insurers also affects health care prices and quality. Insurers with market power can increase premiums above competitive levels by exercising monopoly power or can push provider payments below competitive levels by exercising monopsony power. Lower premiums are commonly found in areas with more insurers, whereas in the absence of competition, insurers that obtain price concessions from providers may not pass savings on to consumers.4 Some evidence suggests, however, that moderate amounts of insurer consolidation may be associated with improved patient experience, since providers in such markets have an incentive to compete on quality.
Given the health care industry’s growing complexity, future oversight could involve a combination of more responsive antitrust enforcement and creative regulatory interventions. Combining competitive and regulatory forces may offer the only hope for controlling health care prices, restoring high-quality care, protecting health care workers, and preserving and expanding access to care.”
Large, not-for-profit hospitals/health systems are getting a disproportionate share of unflattering attention these days. Last week was no exception: Here’s a smattering of their coverage:
Jiang et al “Factors Associated with Hospital Commercial Negotiated Price for Magnetic Resonance Imaging of Brain” JAMA Network Open March 21. 2023;6(3):e233875. doi:10.1001/jamanetworkopen.2023.3875
Whaley et al What’s Behind Losses At Large Nonprofit Health Systems? Health Affairs March 24, 2023 10.1377/forefront.20230322.44474
A Pa. hospital’s revoked property tax exemption is a ‘warning shot’ to other nonprofits, expert says KYW Radio Philadelphia March 24, 2023 ww.msn.com/en-us/news/us/a-pa-hospital-s-revoked-property-tax-exemption-is-a-warning-shot-to-other-nonprofits-expert-says
These come on the heals of the Medicare Advisory Commission’s (MedPAC) March 2023 Report to Congress advising that all but safety-net hospitals are in reasonably good shape financially (contrary to industry assertions) and increased lawmaker scrutiny of “ill-gotten gains” in healthcare i.e., Moderna’s vaccine windfall, Medicare Advantage overpayments and employer activism about hospital price-gauging in several states.
Like every sector in healthcare, hospitals enter budget battles with good stories to tell about cost-reductions and progress in price transparency compliance. But in the current political and economic environment, large, not-for-profit hospitals and health systems seem to be targets of more adverse coverage than others as illustrated above. Like many NFP institutions in society (higher education, organized religion, government), erosion of trust is palpable. Not-for-profit hospitals and health systems are no exception.
The themes emerging from last week’s coverage are familiar:
‘Not-for-profit hospitals/health systems, do not provide value commensurate with the tax exemptions they get.’
‘Not for profit hospitals & health systems take advantage of their markets and regulations to create strong brands and generate big profits.’.
‘Not for profit hospitals & health systems charge more than investor-owned hospitals: the victims are employers and consumers who pay higher-than-necessary prices for their services.’
‘NFP operators invest in risky ventures: when the capital market slumps, they are ill-prepared to manage. Risky investments, not workforce and supply chain issues, are the root causes of NFP financial stress. They’re misleading the public purposely.’
‘Executives in NFP systems are overpaid and patient collection policies are more aggressive than for-profits. NFP boards are ineffective.’
The stimulants for this negative attention are equally familiar:
Proprietary studies by think tanks, trade associations, labor unions and consultancies designed to “prove a point” for/against not-for-profit hospitals/health systems.
Government reports about hospital spending, waste, fraud, workforce issues, patient safety, concentration and compliance with transparency rules.
Aggressive national/local reporting by journalists inclined to discount NFP messaging.
Public opinion polls about declining trust in the system and growing concern about price transparency, affordability and equitable access.
Politicians who use soundbites and dog whistles about NFP hospitals to draw attention to themselves.
The cumulative effect of these is confusion, frustration and distrust of not-for-profit hospitals and health systems. Most believe not-for-profit hospitals/health systems do not own the moral high ground they affirm to regulators and their communities (though religiously-affiliated systems have an edge). Most are unaware that more than half of all hospitals (54%) are not-for-profit and distinctions between safety net, rural, DSH, teaching and other forms of NFP ownership are non-specific to their performance.
What’s clear to the majority is that hospitals are expensive and essential. They’re soft targets representing 31.1% of the health system’s total spend ($4.3 trillion in 2021) increasing 4.9% annually in the last decade while inflation and GDP growth were less.
So why are not-for-profit systems bearing the brunt of hospital criticism?
Simply put: many NFP systems act more like Big Business than shepherds of community health. In fact, 4 of the top 10 multi-hospital system operators is investor owned: HCA (184), CHS (84), LifePoint (84), Tenet (65). In addition, 3 others are in the top 50: Ardent (30), UHS (26), Quorum (22). So, corporatization of hospital care using private capital and public markets for growth is firmly entrenched in the sector exposing not-for-profit operators to competition that’s better funded and more nimble. And, per industry studies, not-for-profits tend to stay in markets longer and operate unprofitable services more frequently than their investor-owned competitors. But does this matter to insurers, community leaders, legislators, employers, hospital employees and physicians? Some but not much.
My take:
There are no easy answers for not-for-profit hospitals/heath systems. The issue is about more than messaging and PR. It’s about more than Medicare reimbursement (7.5% below cost), protecting programs like 340B, keeping tax exemptions and maintaining barriers against physician-owned hospitals. The issue is NOT about operating income vs. investment income: in every business, both are essential and in each, economic cycles impact gains/losses. Each of these is important but only band-aids on an open wound in U.S. healthcare.
Near-term (the next 2 years), opportunities for not-for-profit hospitals involve administrative simplification to reduce costs and improve the efficiencies and effectiveness of the workforce. Clinical documentation using ChatGPT/Bard-like tools can have a massive positive impact—that’s just a start. Advocacy, public education and Board preparedness require bigger investments of time and resources. But that’s true for every hospital, regardless of ownership. These are table stakes to stay afloat.
The longer-term issue for NFPs is bigger:
It’s about defining the future of the U.S. health system in 2030 and beyond—the roles to be played and resources necessary for it to skate to where the puck is going. It’s about defining the role played by private employers and whether they’ll pay 220% more than Medicare pays to keep providers and insurers solvent. It’s about how underserved and unhealthy people are managed. It’s about defining systemness in healthcare and standardizing processes. It’s about defining sources of funding and optimal use of resources. Not-for-profit systems should drive these discussions in the communities they serve and at a national level.
MedPAC’s 17 member Commission will play a vital role, but equally important to this design process are inputs from employers, consumers and thought leaders who bring fresh insight. Until then, not-for-profit health systems will be soft targets for unflattering media because protecting the status quo is paramount to insiders who benefit from its dysfunction. Incrementalism defined as innovation is a recipe for failure.
It’s time to begin a discussion about the future of the U.S. health system—all of it, not just high-profile sectors like not-for-profit hospitals/health systems who are currently its soft target.
Over the years, somepolicymakers have questioned whether nonprofit hospitals—which account for nearly three-fifths (58%) of community hospitals—provide sufficient benefit to their communities to justify their exemption from federal, state, and local taxes.
This issue has been the subject of renewed interest in light of reports of nonprofit hospitals taking aggressive steps to collect unpaid medical bills, including suingpatients over unpaid medical debt, including patients who are likely eligible for financial assistance. Further, recent research indicates that nonprofithospitals devote a similar or smaller share of their operating expenses to charity care in comparison to for-profit hospitals. In light of these concerns, several policy ideas have been floated to better align the level of community benefits provided by nonprofit hospitals with the value of their tax exemption.
This data note provides an estimate of the value of tax exemption for nonprofit facilities based on hospital cost reports, filings with the Internal Revenue Service (IRS), and American Hospital Association (AHA) survey data (see Methods for additional details). We define the value of tax exemption as the benefit of not having to pay federal and state corporate income taxes, typically not having to pay state and local sales taxes and local property taxes, and any increases in charitable contributions and decreases in bond interest rate payments that might arise due to receiving tax-exempt status.
Results
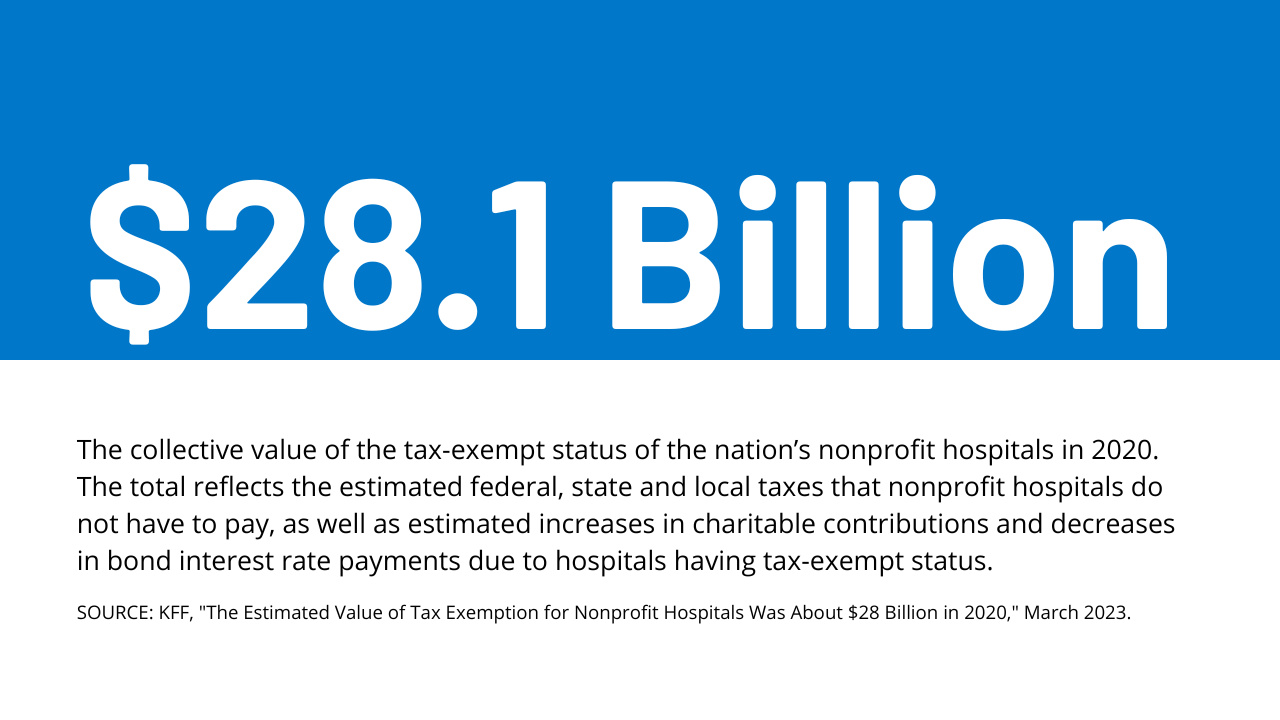
The total estimated value of tax exemption for nonprofit hospitals was about $28 billion in 2020 (Figure 1). This represented over two-fifths (44%) of net income (i.e., revenues minus expenses) earned by nonprofit facilities in that year. To put the value of tax exemption in perspective, our estimate is similar to the total value of Medicare and Medicaid disproportionate share hospital (DSH) payments in the same year ($31.9 billion in fiscal year 2020) (i.e., supplemental payments to hospitals that care for a disproportionate share of low-income patients which are intended, in part, to offset the costs of charity care and other uncompensated care).
The estimated value of federal tax-exempt status was $14.4 billion in 2020, which represents about half (51%) of the total value of tax exemption. This is primarily due to the estimated value of not having to pay federal corporate income taxes ($10.3 billion). In addition, we assumed that individuals contribute more to tax-exempt hospitals because they can deduct donations from their income tax base ($2.5 billion) and issue bonds at lower interest rates because the interest is not taxed ($1.6 billion). Our estimates of changes in charitable contributions and interest rates on bonds only account for federal tax rates for simplicity and may therefore understate the total value of tax exemption because they do not account for the effects of state taxes.
The total estimated value of state and local tax-exempt status was $13.7 billion in 2020, which represents about half (49%) of the total value of tax exemption. This amount includes the estimated value of not having to pay state or local sales taxes ($5.7 billion), local property taxes ($5.0 billion) or state corporate income taxes ($3.0 billion).
The total estimated value of tax exemption (about $28 billion) exceeded total estimated charity care costs ($16 billion) among nonprofit hospitals in 2020 (Figure 2), though charity care represents only a portion of the community benefits reported by these facilities. Hospital charity care programs provide free or discounted services to eligible patients who are unable to afford their care and represent one of several different types of community benefits reported by hospitals.
The Internal Revenue Service (IRS) also defines community benefits to include unreimbursed Medicaid expenses, unreimbursed health professions education, and subsidized health services that are not means-tested, among other activities. One study estimated that the value of tax exemption exceeded the value of community benefits broadly for about one-fifth (19%) of nonprofit hospitals during 2011-2018 or about two-fifths (39%) when considering the incremental value of community benefits provided relative to for-profit facilities. Other research suggests that nonprofithospitalsdevote a similar or smaller share of their operating expenses to charity care and unreimbursed Medicaid costs—which accounted for most of the value of community benefits in 2017—when compared to for-profit hospitals.
The value of tax exemption grew from about $19 billion in 2011 to about $28 billion in 2020, representing a 45 percent increase (Figure 3). The value of tax exemption increased in most of the years (7 out of 9) in our analysis, though there was a notable decrease of $5.8 billion in 2018. The largest single-year increase was $4.1 billion in 2020. The large decrease in the value of tax exemption in 2018 coincided with the implementation of the Tax Cuts and Jobs Act of 2017, which permanently reduced the federal corporate income tax rate from 35 to 21 percent and therefore decreased the value of being exempt from federal income taxes.
The large increase in the value of tax exemption in 2020 overlapped with the start of the COVID-19 pandemic. This increase primarily reflects a large increase in aggregate net income for nonprofit hospitals in 2020. Although there were disruptions in hospital operations in 2020, hospitals received substantial amounts of government relief, and it is possible that other sources of revenue, such as from investment income, may have also increased. Increases in net income in turn increased the value of not having to pay federal and state income taxes.
Increases in the estimated value of tax exemption over time also reflect net income growth that preceded the pandemic as well as increases in estimated property values, supply expenses, and charitable contributions, each of which would carry tax implications if hospitals lost their tax-exempt status (e.g., with some supply expenses being subject to sales taxes). Even when setting aside the strong financial performance of nonprofit hospitals in 2020 as a potential outlier, total net income among nonprofit facilities increased substantially in the preceding years, before increasing further in 2020. Although we are not able to directly observe the value of the real estate owned by hospitals, the estimated value of exemption from local property taxes—which is based on our analysis of property taxes paid by for-profit hospitals—increased by 63 percent from 2011 to 2019. Finally, the supply expenses in our analysis increased by 44 percent and charitable contributions increased by 49 percent from 2011 to 2019.
Discussion
The estimated value of tax exemption for nonprofit hospitals increased from about $19 billion in 2011 to about $28 billion in 2020. The rising value of tax exemption means that federal, state, and local governments have been forgoing increasing amounts of revenue over time to provide tax benefits to nonprofit hospitals, crowding out other uses of those funds. This has raised questions about whether nonprofit facilities provide sufficient benefit to their communities to justify this tax benefit. Federal regulations require, among other things, that nonprofit hospitals provide some level of charity care and other community benefits as a condition of receiving tax-exempt status. However, a 2020 Government Accountability Office (GAO) report raised questions about whether the government has adequately enforced this requirement. Further, some argue that the federal definition of “community benefits” is too broad—e.g., by including medical training and research that could benefit hospitals directly—though others believe that the definition is too narrow. Most states have additional community benefit requirements for nonprofit or broader groups of hospitals—such as providing charity care to patients below a specified income threshold—though there is little information about the effectiveness of these regulations or the extent to which they are enforced.
Several policy ideas have been floated at the federal and state level that would increase the regulation of community benefits spending among nonprofit hospitals or among hospitals more generally. These include proposals to create or expand state requirements that hospitals provide charity care to patients below a specified income threshold, mandate that nonprofit hospitals provide a minimum amount of community benefits, establish a floor-and-trade system where hospitals would be required to either provide a minimum amount of charity care or subsidize other hospitals that do so, create mechanisms to increase the uptake of charity care, expandoversight and enforcement of community benefit requirements, replace current tax benefits with a subsidy that is tied to the value of community benefits provided, and introducereforms intended to better align community benefits with local or regional needs.
These policy options would inevitably involve tradeoffs. While they may expand the provision of certain community benefits, hospitals would incur new costs as a result, which could in turn have implications for what services they offer, how much they charge commercially insured patients, and how much they invest in the quality of care.
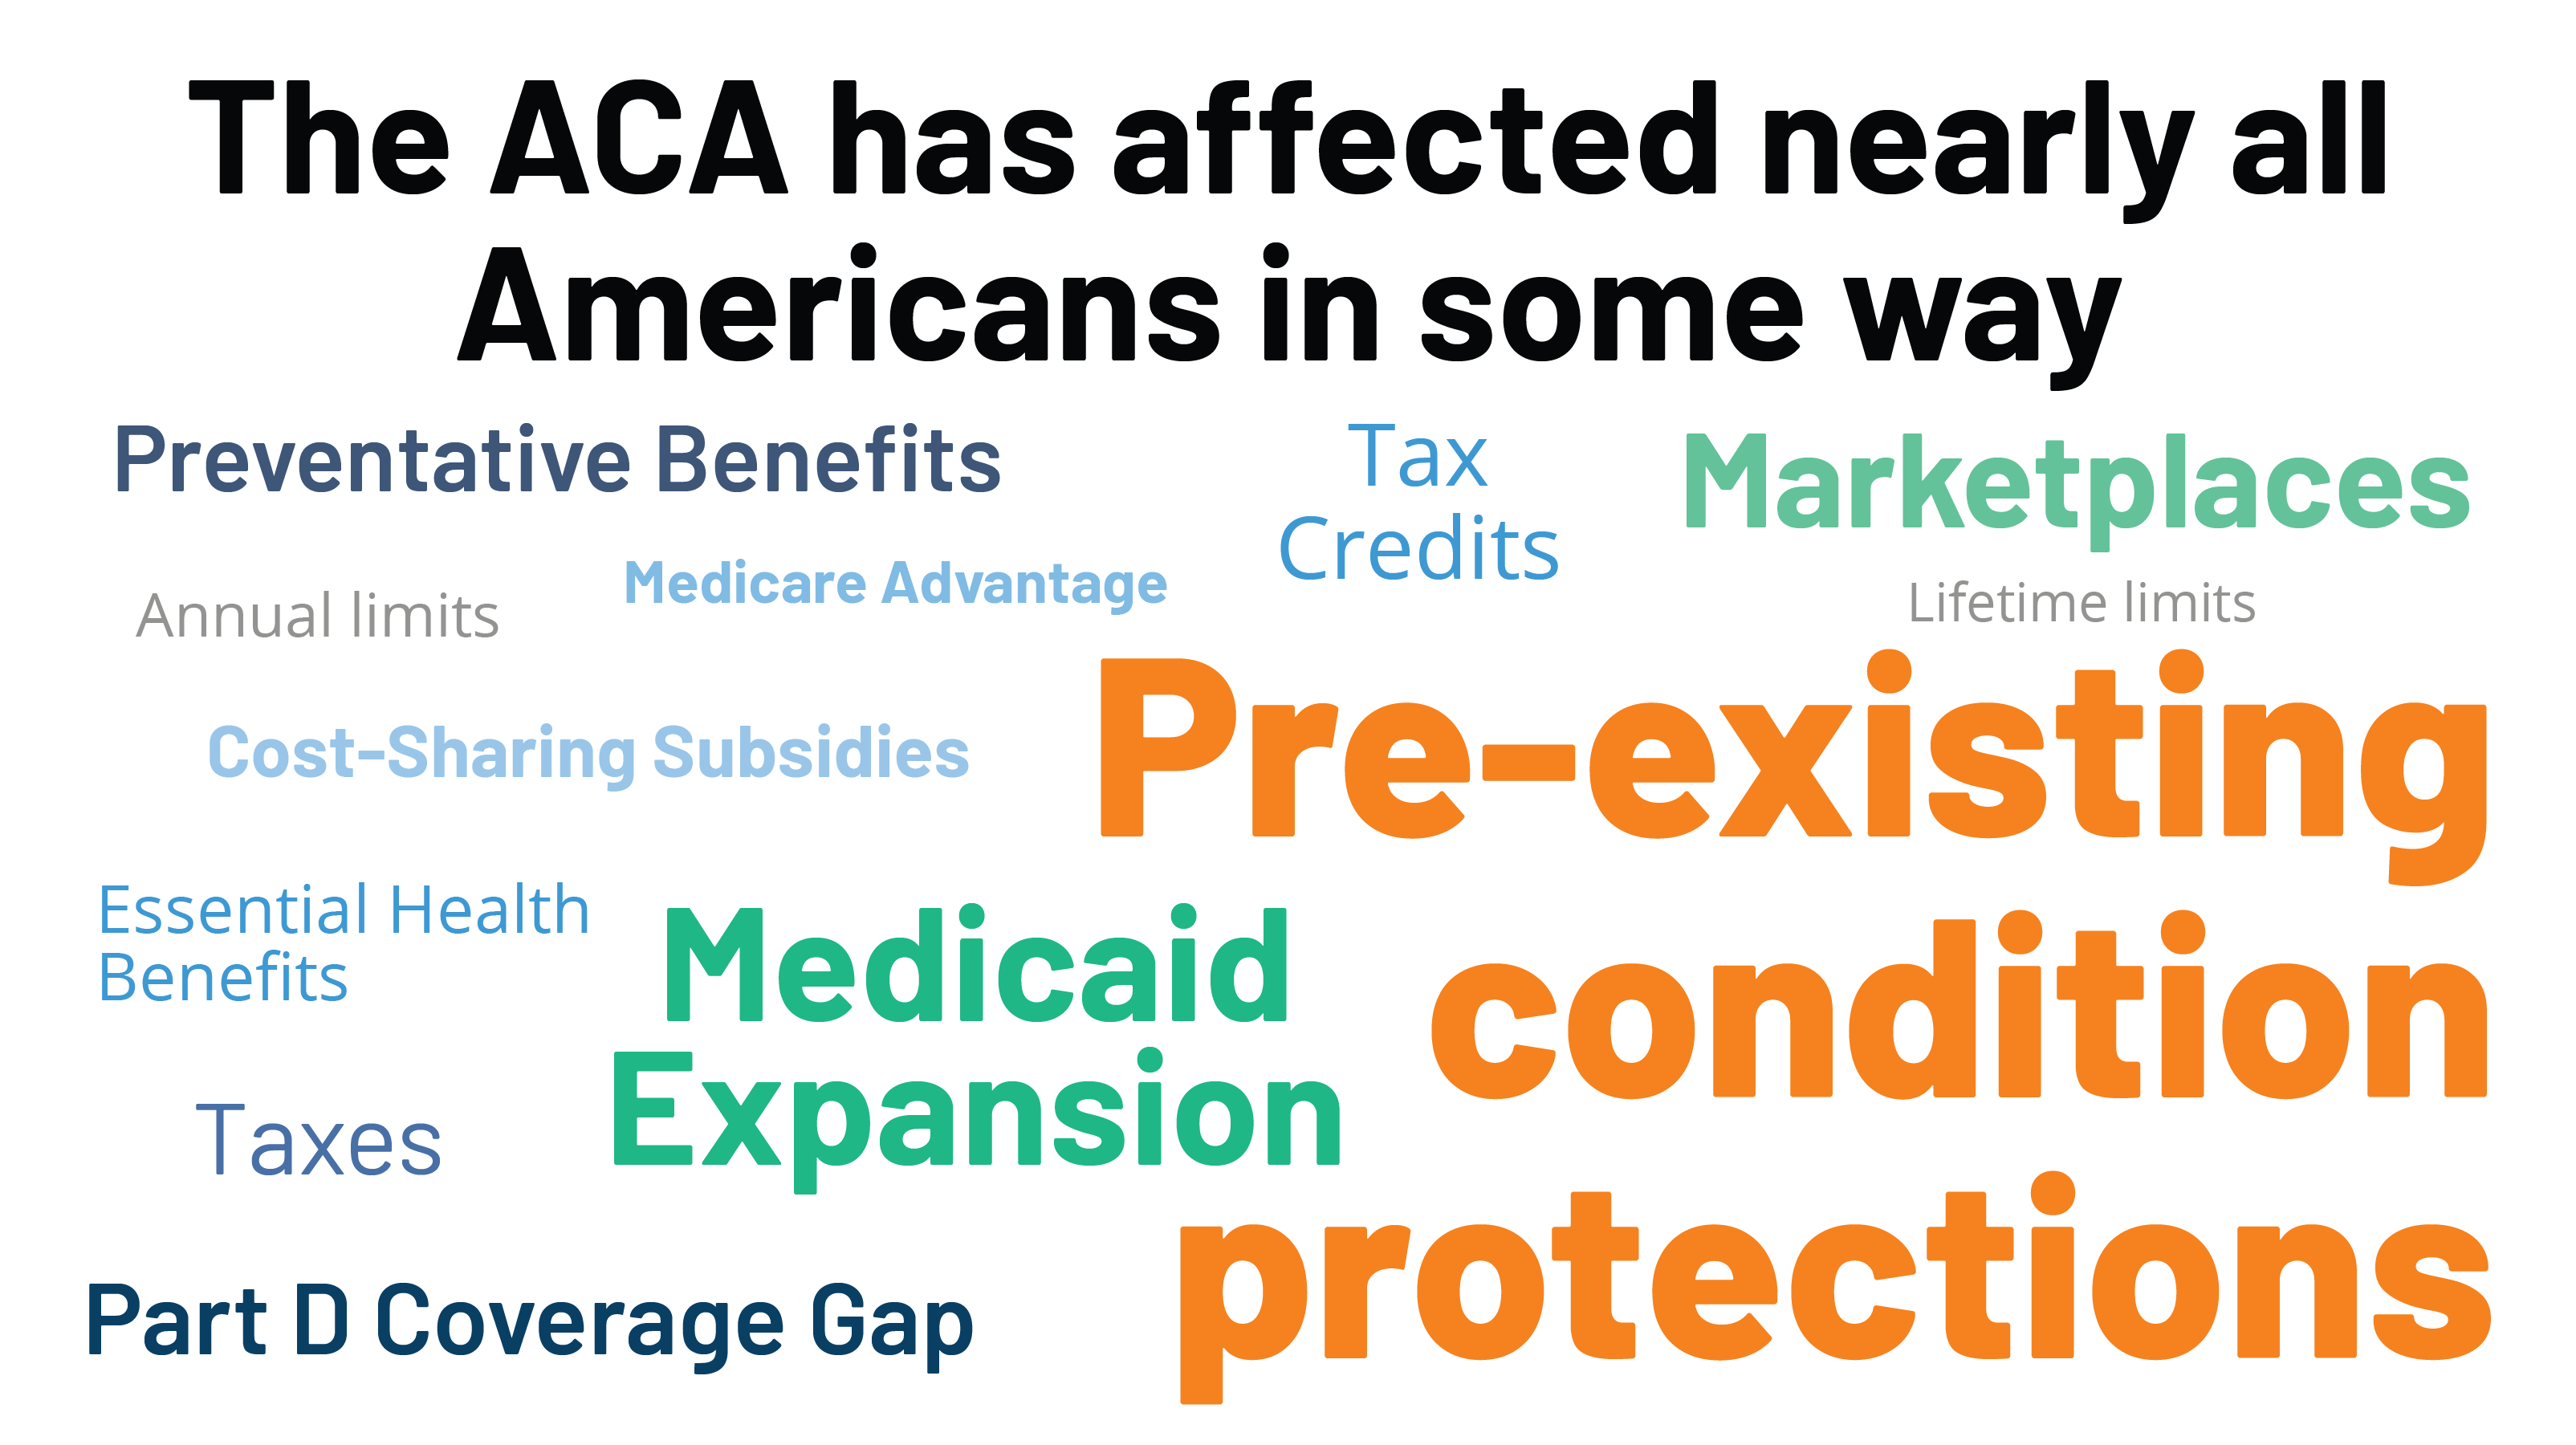
Thursday marks the 13th anniversary of the signing of the Affordable Care Act– perhaps the most consequential healthcare legislation since LBJ’s passage of the Medicare Act in 1965. Except in healthcare circles, it will probably go unnoticed.
World events in the Ukraine and China President Xi Jinping’s visit to Russia will grab more media attention. At home, the ripple effects of Silicon Valley Bank’s bankruptcy and the stability of the banking system will get coverage and former President Trump’s arrest tomorrow will produce juicy soundbites from partisans and commentators. Thus, the birthday of Affordable Care Act, will get scant attention.
That’s regrettable: it offers an important context for navigating the future of the U.S. health system. Having served as an independent facilitator between the White House and private sector interests in 2009-2010, I recall vividly the events leading to its passage and the Supreme Court challenge that affirmed it:
The costs and affordability of healthcare and growing concern about the swelling ranks of uninsured were the issues driving its origin. Both political parties and every major trade group agreed on the issues; solving them not so easy.
Effective messaging from special interests about the ACA increased awareness of the law and calcified attitudes for or against. Misinformation/disinformation about the “Patient Protection and Affordable Care Act” morphed to a national referendum on insurance coverage and the cost-effectiveness of the ACA’s solution (Medicaid expansion, subsidies and insurance marketplaces). ‘Death panels. government run healthcare and Obamacare’ labels became targets for critics: spending by special interests opposed to the law dwarfed support by 7 to 1. Differences intensified: Emotions ran high. I experienced it firsthand. While maintaining independence and concerns about the law, I received death threats nonetheless. Like religion, the ACA was off-limits to meaningful discussion (especially among the majority who hadn’t read it).
And after Scott Brown’s election to the vacant Massachusetts seat held by Ted Kennedy in January, 2010, the administration shifted its support to a more-moderate Senate Finance Committee version of the law that did not include a public option or malpractice reforms in the House version. Late-night lobbying by White House operatives resulted in a House vote in favor of the Senate version with promises ‘it’s only the start’. Through amendments, executive orders, administrative actions and appropriations, it would evolve with the support of the Obama team. It passed along party lines with the CBO offering an optimistic view it would slow health cost escalation by reducing administrative waste, implementation of comparative effectiveness research to align evidence with care, increased insurance coverage, changing incentives for hospitals and physicians and more.
The Affordable Care Act dominated media coverage from August 2009 to March 2010. In the 2010 mid-term election, it was the issue that catapulted Republicans to net gains of 7 in the Senate, 63 in the House and 6 in Governor’s offices. And since, Republicans in Congress have introduced “Repeal and Replace” legislation more than 60 times, failing each time.
Today, public opinion about the ACA has shifted modestly: from 46% FOR and 40% against in 2010 to 55% FOR and 42% against now (KFF). The national uninsured rate has dropped from 15.5% to 8.6% and Medicaid has been expanded in 39 states and DC. Lower costs, increased affordability and quality improvements owing to the ACA have had limited success.
Key elements of the ACA have not lived up to expectations i.e. the Patient Centered Outcome Research Institute, the National Quality Strategy, Title V National Healthcare Workforce Task Force, CMMI’s alternative payment models and achievement of Level 3 interoperability goals vis a vis ONCHIT, CHIME et al. So, as the 2024 political season starts, the ACA will get modest attention by aspirants for federal office because it addressed big problems with blunt instruments. Most recognize it needs to be modernized based on trends and issues relevant to healthcare in 2030 and beyond.
Trends like…
Self-diagnostics and treatment by consumers (enabled by ChatGPT et al).
Data-driven clinical decision-making.
Integration of non-allopathic methodologies.
The science of wellbeing.
Complete price, cost and error transparency.
Employer and individual insurance coverage optimization.
And others.
Issues like….
The role and social responsibility of private equity in ownership and operation of services in healthcare delivery and financing.
The regulatory framework for local hospitals vs. Regional/nation health systems, and between investor-owned and not-for-profit sponsorship.
The role and resources for guided self-care management and virtual-care.
Innovations in care delivery services to vulnerable populations using technologies and enhanced workforce models.
Modernization of regulatory environments and rules of competition for fully integrated health systems, prescription drug manufacturers, health insurers, over-the counter therapies, food as medicine, physician ownership of hospitals, data ownership, tech infomediaries that facilitate clinical decision-making, self-care, professional liability and licensing and many others.
Integration of public health and local health systems.
The allocation of capital to the highest and best uses in the health system.
The sustainability of Medicare and role of Medicare Advantage.
The regulatory framework for disruptors”.
And many others.
These trends are not-easily monitored nor are the issues clear and actionable. Most are inadequately addressed or completely missed in the ACA.
Complicating matters, the political environment today is more complicated than in 2010 when the ACA became law. The economic environment is more challenging: the pandemic, inflation and economic downturn have taken their toll. Intramural tensions in key sectors have spiked as each fights for control and autonomy i.e. primary care vs. specialty medicine, investor-owned vs. not-for-profit hospitals, retail medicine & virtual vs. office-based services, carve-outs, direct contracting et al . Consolidation has widened capabilities and resources distancing big organizations from others. Today’s media attention to healthcare is more sophisticated. Employers are more frustrated. And the public’s confidence in the health system is at an all-time low.
“ACA 2.0” is necessary to the system’s future but unlikely unless spearheaded by community and business leaders left out of the 1.0 design process. The trends and issues are new and complicated, requiring urgent forward thinking.
Over the past seven years, Medicare Advantage’s (MA’s) enrollment has almost doubled, adding 10 percent to its market share , now at 49 percent. Rebates, the additional dollars paid by CMS to MA plans that bid beneath their “benchmark,” have doubled in that time from $80 per beneficiary per month (PBPM) to $164. (Benchmarks are intended to represent the average per-beneficiary spending in traditional Medicare (TM) in a given service area.)
The Medicare Advantage industry’s explanation of its success is grounded in claims about MA’s ability to deliver Medicare Part A and B benefits for much less than TM. These savings are, in theory, the basis for the rebates, the incremental revenue CMS pays to plans that fund the improved benefits and lower premiums as compared to TM, which in turn help attract members to MA plans. Indeed, the Medicare Payment Advisory Commission (MedPAC) reports that MA bids average 85 percent of the FFS cost. Because these bids include approximately 15 percent for administrative costs and profits, they imply that Plan medical cost savings must be in the range of 25 to 30 percent versus the Medicare FFS cost benchmark bidding target.
However, a close examination of the bid process reveals that most of these savings are artifacts of the process and not due to better or more efficient care. They result from including “induced utilization costs” from Medicare supplemental insurance, legislated increases in the benchmarks, and risk score gaming. The inflation of benchmarks and risk score gaming, not better care, finance the rebates that drive MA market success.
CMS pays MA Plans a per-person revenue amount that is determined by the Plan’s bid to provide Part A (hospital) and Part B (all other medical services) to enrollees. Plans bid against a benchmark, which as noted is intended to capture the amount that Medicare would spend on TM benefits for an average TM beneficiary. If the bid is less than the benchmark, CMS keeps about one-third of the difference and pays two-thirds to the Plan as a rebate. This rebate can be used to improve benefits or reduce costs for the members. If the bid is above the benchmark, there is no rebate, and the Plan must charge the member premiums to make up the difference.
Bids include the cost of medical services as well as plan administrative costs and profits. Most plans bid sufficiently below the benchmark to offer members a “zero premium” product, often including Part D drug coverage. Conceptually, the difference between the benchmark and the bid represents “savings” that the plan generates that decrease CMS costs.
Real Vs. Apparent Savings
The difference between bids and benchmarks, i.e., the savings vs. FFS, and rebates have doubled over the past seven years, leading to improved benefits, lower premiums for members, higher profits and more rapid growth. In 2022, rebates were $164 PBPM and 66 percent of beneficiaries were in zero-premium products.
This suggests that savings for CMS have increased; however, the reality is that most of these are just “apparent savings”—not real savings—that increase costs for CMS, beneficiaries and taxpayers.
Here is how that happened.
Benchmarks Are Significantly Inflated By Including The Costs Of ‘Induced Utilization’
The total cost of care is a function of the price paid per service and the number of services patients receive. Because MA Plans are given the right to use CMS’s Medicare pricing schedule for all Medicare participating providers, the MA average price per service tends to be about the same as Medicare’s. Most savings in MA then must be due to changes in utilization of services. Is the 25-30 percent implied savings of MA really due to 25-30 percent lower utilization across the full set of health care services, or is something else leading to “apparent savings”?
The ‘Induced Utilization Effect’ Of Medicare Supplemental Insurance Leads To Higher Utilization And Costs In The TM Population
Health insurance benefits programs vary by the percentage of costs paid by the covered individual. First-dollar coverage (FDC) means that the insurer pays most of the cost of services. Non-first dollar coverage (NFDC) with deductibles, coinsurance, and copays creates financial hurdles for patients as they pay more of the cost. Actuaries have shown that populations with FDC use more services and have higher total costs. We use the term “induced utilization” to denote the additional services associated with FDC. If one assumes that the additional services are necessary and contribute to better health, this difference is better framed as “forgone services” by the population with NFDC.
TM’s population provides an ideal context to study this phenomenon. TM’s fee-for-service benefits cover about 84 percent of medical costs but the vast majority of TM beneficiaries (84 percent) have supplemental insurance coverage that covers the other 16 percent of costs, effectively giving them FDC. MedPAC commissioned two studies to examine the difference in utilization between beneficiaries with and without supplemental coverage. MedPAC cited the first study in their June 2012 report on reforming Medicare’s benefit design, concluding:
The study estimated that total Medicare spending was 33 percent higher for beneficiaries with medigap policies . . . Beneficiaries with employer sponsored coverage had 17 percent higher Medicare spending
The authors of this study updated it in 2014, using three years of additional data, through 2008. Their conclusions at that time estimated that Medicare spending was 25 percent higher for beneficiaries with Medigap policies and 14 percent higher for those with employer-sponsored coverage. Another 2019 study on induced utilization showed that Medigap increased utilization by more than 20 percent.
The way the costs from induced utilization inflate the MA benchmark calculation has major implications for the calculation of MA Plan rebates. As we shall see below, the current approach gives MA plans a massive head start on financial success, no matter how well or poorly they manage care or costs.
Effects Of Induced Utilization On TM Spending Flow Through To MA Benchmarks
At a high level, the MA benchmark is based on the average total cost for all TM beneficiaries. The 2022 TM average cost of $1,086 per beneficiary per month (PBPM) is the average of the total medical costs for two Medicare populations: those with additional coverage (TM + Coverage) and those with Medicare only (TM only). Exhibit 1, using the differences in spending cited by Hogan et al in 2014 above, demonstrates the underlying average costs for individuals with and without additional coverage. The TM-only population costs CMS $920 while the TM+ Coverage population costs $1,169. The overall weighted average cost of $1,086 is inflated above the TM-only cost by $166, or 18 percent.
The Expected Cost Plans Use In Their Bids, Based On TM-Only Benefits, Are Far Below The Inflated MA Benchmark And Result In Large “Apparent Savings” And Rebates
The MA bid process instructs plans to bid their expected cost using the standard Medicare package of services and benefits. Any improved benefits and resulting costs are part of the supplemental benefit information that explains how they will use the rebates. The intent is for the plans to demonstrate their ability to drive significant savings versus CMS’s cost. One would think that this should be a comparison of the bid with the TM-only population’s cost. But the MA benchmark used in the comparison is based on the overall average of costs for the TM +Coverage and the TM-only populations, thereby including the induced utilization costs. When the lower expected cost is subtracted from the inflated benchmark it automatically creates “apparent savings” of $166 PBPM, or 18 percent.
Exhibit 2 illustrates how these “apparent savings” roll through the MA bid to create rebates for the plans. Our model in exhibit 2 is based on MedPAC’s analysis of the industry-wide 2022 MA bids, which showed an average rebate of $164 PBPM. That analysis, combined with the Medicare 2022 average TM cost of $1,086, implies that the expected medical costs used in the bids averaged approximately $790, an actual medical cost savings of $130 PBPM (14 percent) compared to the $920 TM-only cost.
Column 1 shows what would happen if the benchmark were set at the TM-Only cost of $920 with an average risk population. With assumed administrative costs of $80 PBPM (8 percent) and profits of $50 (5 percent) the resulting bid would be $920. Because the bid and the benchmark would be both $920, plans would show no savings and receive no rebate. The total savings in the Bid are just the medical cost savings of $130, which fund the plan administrative costs and profits. With no rebate they would have to charge members for any improved or supplemental benefits. This would not be a formula for success in MA.
Column 2 uses the inflated benchmark of $1,086 that includes the $166 induced utilization effect. Medical costs do not change, the bid remains the same, and the $166 becomes the difference between the benchmark and the bid; two-thirds of the $166 becomes the rebate of $108. The total savings implied in the bid increase to $296, but 56 percent is due to “apparent savings,” which account for 100 percent of the rebate.
But this is still well below the reported 2022 $164 average rebate. Is more of this driven by plan medical cost savings?
Legislated Payments Above FFS Cost Further Inflate Benchmarks And Contribute To Apparent Savings And Rebates
The MA average national benchmark of $1,086 is based on Medicare’s national average cost for TM in 2022, as reported by CMS. This is what Medicare pays for all Part A and B services for an average beneficiary across the country. Actual MA rates are set at the county level and are adjusted from 95 percent to 115 percent of FFS Medicare expenses depending on whether a county has high or low costs relative to the national average. Approximately 80 percent of MA enrollees are also in plans that receive quality bonuses.
County bonuses and quality bonuses are added to benchmarks. According to MedPAC, in 2022 these bonuses accounted for an additional 8 percent increase in payments above the FFS cost, and 90 percent of MA members were in Plans receiving quality bonuses.MedPAC again reiterated at its January 2023 meeting that the “quality bonus program is not a good way of judging quality for the 49 percent of beneficiaries in MA.” Column 3 starts with a benchmark that is inflated $87 (8 percent) more to account for these bonuses. The bid is unchanged, increasing the difference to $253 and the rebate to the $164 reported by MedPAC. Of the savings implied in the bid, 66 percent is from benchmark inflation, as is 100 percent of the rebate.
Risk Score Gaming Acts As A Multiplier Of This Benchmark Inflation
As described in our prior article, MA Money Machine Part 1, plans systematically increase their risk scores to improve payments from CMS. Column 4 in exhibit 2 illustrates the results for a plan that increases its risk score from 1 to 1.1. In the bid process, the benchmark-bid difference is computed by comparing the actual bid to the risk-adjusted benchmark. Our prior examples had an average risk score of 1, so the risk-adjusted benchmark is the same as the benchmark. In Column 4 the benchmark is risk adjusted by multiplying the $1,173 from Column 3 by the 1.1 risk score, resulting in an increase of $117.
While the higher risk score might suggest that the population is sicker, that is an illusion created by the risk score game. The medical costs do not change.The reality is the population is the same; the plan has just collected more codes that make the population look sicker. We recently presented an example of this using data from a United Health Group (UHG)/Optum Team Study that included a comparison of HCC coding rates for FFS and MA populations.
The bid therefore remains the same. The difference has increased to $370, resulting in a rebate of $241. The savings implied in the bid increase to $500, but 74 percent of these and 100 percent of the rebate are apparent savings from benchmark and risk score driven inflation.
The MA Bid Process Allows Plans With Zero Cost Savings To Offer Zero Premium Products
Column 5 of exhibit 2 shows that even if the plan has no actual medical cost savings, and no increase in the risk score, the benchmark inflation from induced utilization and bonuses allows the plan to have a rebate of $100.
MedPAC has reported that rebates vary widely, suggesting that there are indeed real MA plans today that are delivering no improvement in medical costs vs. FFS but still are receiving rebates and offering zero premium products.
Even Plan Medical Cost Savings Are Uncertain
Most of our examples assume that MA beneficiaries have a risk score of 1, that is they have the same health burden as an average Medicare population. Multiple studies have shown that this is not the case. Jacobson et al demonstrated that beneficiaries who enrolled in MA in 2016 were 16 percent less costly than individuals who stayed in TM. Other researchers have used mortality rates as evidence that individuals choosing MA are healthier than those in TM. If MA beneficiaries are actually healthier and have lower medical costs, the 14 percent “real” cost savings we use in exhibit 2 would be overstated.
ACOs Do Not Benefit From Any of These Subsidies
In an earlier paper, Joe Antos and Jim Capretta asserted that “There is little question the MA plans have the capacity to deliver Medicare benefits at far less cost than unmanaged fee-for-service” and further that accountable care organizations (ACOs) deliver “far less that the savings that could be achieved by MA plans based on their bids.” While we disagree with both statements, we agree on one point: the savings implied in MA bids seem large. But they are mostly apparent not real savings.
ACOs have a very different starting point from MA plans. They don’t start with the 18 percent advantage demonstrated above, they don’t get county and quality bonuses and they are not able to benefit much from risk coding. The costs of induced utilization are in their benchmarks, but their aligned beneficiaries are representative of the TM mix of people with FDC and non-FDC. The benefits and the resulting costs match, unlike the MA bid comparison of average costs and lower plan expected costs. Any comparison of savings by the two programs needs to account for this reality. We believe that most of the differences in the “real savings” of the two programs is accounted for by claims denials and some instances of lower prices in MA vs. FFS.
Conclusion
MA is growing rapidly because of plans offering lower premiums and improved, supplemental benefits.
Claims by the MA industry that they are successful because they deliver more efficient care are flawed because they compare MA costs to inflated benchmarks that are much higher than the actual CMS costs to provide benefits.
Even if one assumes that MA does decrease medical costs, these savings as reflected in MA bids are not the drivers of the rebates or MA success. Indeed, 100 percent of rebates result from inflated benchmarks and risk score gaming. The resulting payments, which are in excess of TM costs, generate the additional funding for “free-to-the-member” improved benefits. While there is large variation, and some plans improve care and decrease utilization, MA industry success is a function of corporate subsidies.
The bottom line: we are systematically driving people out of TM by subsidizing the more expensive MA.
Inflated benchmarks from these three sources start MA plans “on third base” and risk score gaming gives them a free walk home. For MA plan owners it feels like they hit a home run. For taxpayers and Medicare beneficiaries footing the bill it feels like a series of major errors. CMS in its 2024 Medicare Advantage Advance Notice has proposed significant changes to the Risk Adjustment system. We believe this would be an important step forward towards addressing the vast overpayments to MA plans and deserves our support.
At a meeting with hospital system CEOs last Wednesday, one asked: “has healthcare reached the tipping point?” I replied ‘not yet but it’s getting close.’
I iterated factors that make these times uniquely difficult in every sector:
An uncertain economy that’s unlikely to fully recover until next year.
The growth of Medicaid and Medicare coverage that shifts their financial shortfall to employers and taxpayers who are fed up and pushing back.
A vicious political environment that rewards partisan brinksmanship and focus-group tested soundbites to manipulate voters on complex issues in healthcare.
The growing domination of Big Business in each sector that have used acquisitions + corporatization to their advantage.
The widening role of private equity in funding non-conventional solutions that disrupt the status quo (and the uncertain future for many of these).
The federal courts system that’s increasingly the arbiter over access, fairness, quality and freedoms in healthcare.
The lingering impact of the pandemic.
And growing public disgust and distrust as the system’s altruism and good will is undermined by pervasive concern for profit.
Unprecedented! But events like those last week prompt hitting the pause button: not everyone pays attention to healthcare like many of us. The slaughter of 6 innocents in Nashville hit close to home: it’s about guns, mental health and life and death. The appeal of tech-giants to press the pause button on Generative AI for at least 6 months was sobering. The ravage of tornados that left thousands insecure without food, housing or hope seemed unfair. Mounting tensions with Russia and complex negotiations with China that reminded us that the U.S. competes in a global economy. And President Trump’s court appearance tomorrow will stoke doubt about our justice system at a time when it’s role in healthcare and society is expanding.
I am a healthcare guy. I am prone to see the world through the lens of the U.S. health industry and keen to understand its trends, tipping points and future. There’s plenty to watch: this week will be no exception. The punch list is familiar:
Medicaid coverage: Many will be watching the fallout of from state redetermination requirements for Medicaid coverage starting as soon as this week with disenrollment in Arizona, Arkansas, Idaho, New Hampshire and South Dakota.
Medicare Advantage: Health insurers will be modifying their Medicare Advantage strategies to adapt to CMS’ risk adjustment and Value-based Insurance Design modifications announced last week.
Prescription drug prices: PBMs and drug companies will face growing skepticism as Senate and House committees continue investigations about price gauging and collusion. Hospitals will be making adjustments to higher operating losses as states cut their Medicaid rolls.
Technology: The 7500 VIVA attendees will be doing follow-up to secure entrées for their technologies and solutions among prospective buyers.
Physicians: And physicians will intensify campaigns against insurers and hospitals now seen as adversaries while lobbying Congress for more money and greater income opportunities i.e., physician-owned hospitals.
Hospitals: On the offense against site-neutral payments, physician owned hospitals, drug prices and inadequate reimbursement from health insurers.
All will soldier on but the food fights in healthcare and broader headwinds facing the industry suggest a tipping point might be near.
I am not a fatalist: the future for healthcare is brighter than its past, but not for everyone. Strategies predicated on protecting the past are obsolete. Strategies that consider consumers incapable of active participation in the delivery and financing of their care are archaic. Strategies that depend on unbridled consolidation and opaque pricing are naïve. And strategies that limit market access for non-traditional players are artifacts of the gilded age gone by when each sector protected its own against infidels outside.
These times call for two changes in every board room and C Suite in of every organization in healthcare:
Broader vision: Understanding healthcare’s future in the broader context of American society, democracy and capitalism: Beltway insiders and academics prognosticate based on lag indicators that are decreasingly valid for forecasting. Media pundits on healthcare fail to report context and underpinnings. Management teams are operating under short-term financial incentives lacking longer-term applicability. Consultants are telling C suites what they want to hear. And boards are being mis-educated about trends of consequence that matter. Understanding the future and building response scenarios is out of sight and out of mind to insiders more comfortable being victims than creators of the new normal.
Board leadership: Equipping boards to make tough decisions: Governance in healthcare is not taken seriously unless an organization’s investors are unhappy, margins are shrinking or disgruntled employees create a stir. Few have a systematic process for looking at healthcare 10 years out and beyond their business. Every Board must refresh its thinking about what tomorrow in healthcare will be and adjust. It’s easier for board to approve plans for the near-term than invest for the long-term: that’s why outsiders today will be tomorrow’s primary incumbents.
So, is U.S healthcare near its tipping point? I don’t know for sure, but it seems clear the tipping point is nearer than at any point in its history. It’s time for fresh thinking and new players.
US District Judge Reed O’Connor ruled on Thursday that the Affordable Care Act’s (ACA’s) requirement for most insurers to cover certain preventative care services without cost-sharing is unlawful. Judge O’Connor—who invalidated the entire ACA in 2018, before the Supreme Court reversed that ruling—had already sided with the plaintiffs in Braidwood vs. Becerra last September, on the grounds that mandatory coverage of HIV prevention treatment, also known as PrEP therapy, violated their religious beliefs. His latest ruling applies to the ACA-mandated preventive services that are compelled by the US Preventative Services Task Force (USPSTF), on the grounds of the task force’s makeup and the fact that some of its recommendations predate the ACA. Services covered for no cost today include screening tests for a variety of cancers, sexually transmitted infections, and diabetes. The ruling does not impact other ACA preventative care services, like contraceptive services and children’s immunizations, as they are based on the recommendations of other government advisory groups. The immediate impact of this week’s ruling is unclear, as the Biden administration has already filed an appeal and may seek to stay the ruling, while most insurance contracts are set on an annual basis.
The Gist: Given the reasoning laid out in Judge O’Connor’s Braidwood v. Becerra ruling last fall, this decision was expected. As with previous attempts to repeal the ACA that have come through his district, the ultimate fate of the ACA’s cost-free preventative care services will likely be decided by the US Supreme Court. It’s possible that the Court may find the narrow targeting of this case more reasonable, making no-cost preventive care coverage optional for employers.
If that happens, millions of Americans could again have to pay for some of the most common and highest-value healthcare services. That additional financial burden, along with tightening of health plan benefit designs, could create barriers to access and exacerbate health disparities.
Hard-pressed to come up with significant savings to reduce the deficit, some Senate Republicans are taking a closer look at reforms to Medicare Advantage in light of reports that insurance companies are collecting billions of dollars in extra profits by over-diagnosing older patients.
But the idea of cracking down on Medicare Advantage overpayments to insurance companies divides Republicans, who have traditionally championed the program.
Proponents of Medicare Advantage reform anticipated it will face strong opposition from the insurance industry, one of the most powerful special interest groups in Washington.
Sen. Bill Cassidy (La.), the top-ranking Republican on the Senate Health, Education, Labor and Pensions Committee, is leading the push to reduce Medicare overpayments.
“Medicare is going insolvent. If we don’t do anything, it’s going to go insolvent. We have a whole package of things, all of them bipartisan, and we’re doing it essentially to have something out there so that if somebody decides to do something, there will be things that are examined, considered and bipartisan” to vote on, he said.
“I come up with lots of stuff. We thought it through policy and think it’s policy that can make it all the way through,” he said.
Cassidy’s office says his bill could extend the solvency of Medicare by saving as much as $80 billion in federal funds over the next decade without cutting benefits.
He emphasizes that it would not cut Medicare Advantage benefits, but critics of the legislation are sure to challenge that claim.
“We’re not undermining Medicare Advantage,” he said.
“In fact, I would say this is a better alternative than what CMS is doing by rule,” he added, referring to a new rule-making action by the Biden administration to recover overpayments in Medicare Advantage through the Centers for Medicare & Medicaid Services.
The Medicare Payment Advisory Panel estimates that Medicare Advantage plans collected $124 billion in overpayments from 2008 to 2023. They collected an estimated $44 billion overpayments in 2022 and 2023 alone, according to MedPAC.
Unlike traditional fee-for-service Medicare, Medicare Advantage plans are offered by private companies. Both are funded by taxpayers through general revenues, payroll taxes and beneficiaries’ premiums.
Cassidy is also leading a bipartisan working group to reform Social Security to extend its solvency. Members include Sens. Angus King (I-Maine) and Mitt Romney (R-Utah).
“To have a significant impact on fiscal policy, you’d have to look at entitlements,” said Romney, who called Medicare Advantage “an area we’re going to be looking at very shortly — the committee will be looking at Medicare Advantage,
the cost of Medicare Advantage …. It’s become more expensive than the old fee-for-service Medicare.”
In a follow-up interview Thursday, Romney said senators are also looking at reforms to Pharmacy Benefit Managers, the companies that serve as middle-men between drug manufacturers, insurance companies and pharmacies.
Romney said, “in the past, Medicare Advantage has been a lower-cost way of providing Medicare than fee-for-service Medicare.”
“If that’s changing, I’d like to understand why and make sure we don’t create impediments to the lower-cost Medicare Advantage,” he said.
Sen. Mike Braun (R-Ind.) said Medicare Advantage overpayment “definitely” is a “reform issue.”
“I’ve been the loudest voice on reforming health care and that’s a commonsense idea,” he said. “Whatever it takes to bring down health care costs.
“I’m one of the most free-market people here, but the health care industry is not a free market. It’s like an unregulated utility,” he said. “There’s so much opaqueness.”
But some Republicans are already trying to paint efforts to reduce overpayments as cuts to Medicare Advantage.
“The problem with Medicare Advantage is President Biden is cutting $540 per member per year. That’s the problem. Medicare Advantage has been very successful,” said Sen. Roger Marshall (R-Kan.), an OB/GYN who practiced medicine for more than 25 years.
National Republican Senatorial Committee Chairman Steve Daines (R-Mont.) accused Biden of “proposing Medicare Advantage cuts” when the president accused some Republicans of wanting to sunset Medicare at his Feb. 7 State of the Union address.
Medicare Advantage is getting more popular among Democrats as well as the number of blue state enrollees in the program soars. The number of Americans enrolled in Medicare Advantage has nearly doubled over the last 12 years, according to the Kaiser Family Foundation.
Cassidy’s proposal, which he introduced with progressive Sen. Jeff Merkley (D-Ore.) on Monday, could draw broader interest from Republicans.
Sen. John Cornyn (R-Texas), an adviser to the Senate GOP leadership, called Medicare Advantage a “success.”
“That doesn’t mean that it should be immune from oversight, so I’ll be interested to see what they have to say,” he said.
Cassidy and Merkley say that Medicare Advantage plans have a financial incentive to make beneficiaries appear sicker than they are because they are paid a standard rate based on the health of individual patients. Their bill, the No Unreasonable Payment, Coding or Diagnoses for Elderly (No Upcode Act) would require risk models based on more extensive diagnostic data over a period of two years.
The goal is to narrow the disparity in how patients are assessed by traditional Medicare and Medicare Advantage.
Studies and audits conducted by CMS and the Department of Health and Human Services’ inspector general found that insurance companies collected billion of dollars in overpayments because of diagnoses that were not later supported by enrollees’ medical records.
The Kaiser Family Foundation reported in August that more than 28 million people — or about 48 percent of the eligible Medicare population — were enrolled in Medicare Advantage plans in 2022. They accounted for $427 billion or 55 percent of total federal Medicare spending.
Researchers estimate 15 million people will lose their Medicaid starting April 1 when states begin removing people from the low-income health insurance program for the first time in three years.
In March 2020, Congress banned states from removing people from Medicaid during the pandemic in exchange for more federal funding for state Medicaid programs. Medicaid enrollment is usually tied to people’s incomes, and individuals normally have to regularly prove they still qualify in what’s known as a redetermination. (In the 39 states and Washington, D.C., that have expanded Medicaid, a family of four has to make less than $40,000 to qualify. In non-expansion states, the cutoff is even lower.)
With redeterminations paused, Medicaid enrollment nationwide has grown from 71 million in February 2020 to an estimated 95 million in March 2023.Research shows Medicaid coverage is associated with better access to care, more financial security, better health and lower mortality. During the pandemic, beneficiaries have been able to enjoy these benefits without worrying about confirming their eligibility.
In December, Congress voted to let states restart the process of clearing their rolls on April 1, what’s sometimes referred to as “unwinding.”Lawmakers are giving states 14 months to redetermine millions of people’s eligibility — an unprecedented task made even more difficult by serious staffing and experience shortages in many Medicaid offices.
“It’s going to be a big lift,” said Sayeh Nikpay, a health policy researcher at the University of Minnesota and Tradeoffs Senior Research Advisor. “States have never had to do this many redeterminations this quickly before, and there’s a lot of uncertainty about what will happen.”
We asked Nikpay to pick out a few relevant studies to help us understand what is happening and how states and employers could keep more people insured. Here are three she identified as particularly helpful.
Two types of people will lose coverage
The Office of the Assistant Secretary for Planning and Evaluation, which provides research for the U.S. Department of Health and Human Services, released a report in August 2022 that estimated 15 million people will lose Medicaid coverage as a result of the unwinding. (The estimate is similar to another analysis by the independent Urban Institute.)
ASPE breaks those 15 million people into two groups. In the first group are people who make too much money to qualify for Medicaid. ASPE estimates there are about 8 million people in that category, and they should be able to get insurance through work or the Obamacare exchanges.
In the second group are roughly 7 million people ASPE estimates are still eligible but will lose coverage because of what’s called “administrative churn.”This can happen if the Medicaid office can’t get in touch with someone to confirm their eligibility because they’ve moved or changed their phone number or if they’re unable to make an in-person appointment because of work or child care responsibilities. (The Urban Institute projects about 4 million people will be in this group.)
These two groups represent a key tension to the unwinding process: States want to shed people who make too much money, but officials also know eligible people often lose coverage during redeterminations, and that danger is heightened given the scale and speed of this process.
Making the switch from Medicaid to private insurance
This next paper looks at the first group: the roughly 8 million people expected to move from Medicaid to private coverage, and specifically the roughly 4 million who are expected to get coverage through the Obamacare exchanges. Adrianna McIntyre, an assistant professor of health policy at Harvard, wrote in JAMA Health Forum in October 2022 about the most effective ways to move people from Medicaid onto private Obamacare plans.
There’s limited data on this, but based on the few studies available, McIntyre found that only 3 to 5 percent of people who leave Medicaid end up getting an Obamacare plan. Many policymakers are relying on the Obamacare exchanges to provide a life preserver to millions of people losing Medicaid coverage, but the research cited by McIntyre shows getting people into these plans is not guaranteed and will take focused effort by states.
McIntyre’s review cites several randomized controlled trials where states tested different ways of increasing enrollment in Obamacare plans. These studies found simple reminders from the state – like physical letters, emails and phone calls help – boost sign-ups anywhere from 7 to 16 percent.
But what really seems to make a difference is reminders plus connecting people to someone who can get them signed up while they are on the phone. In one of those trials published in 2022, people in California who got a reminder email and a call connecting them to enrollment assistance were almost 50% more likely to sign up for a plan. Such extra effort is obviously costly, and it may not be a priority or financially feasible for some states.
McIntyre’s review did not include any research on what employers can do to help their workers transition from Medicaid to work-based coverage, but based on the studies McIntyre cited, Nikpay said she thinks it’s a good idea for employers to make sure people know Medicaid could be going away and provide as much help as possible in getting new coverage.
Making it easier to stay on Medicaid can have other benefits
The final study looks at the second group of people expected to lose Medicaid coverage: the 7 million people who may lose coverage due to administrative churn even though they are still eligible.
Some states have tried to limit that churn, and researchers at the RAND Corporation evaluated New York’s effort. Starting in 2014, New York allowed people to stay on Medicaid without any redeterminations for 12 months once enrolled.
In addition to keeping more people on Medicaid for longer, researchers found that after this policy was in place, hospital admissions and monthly costs per beneficiary went down. The researchers can’t say whether the continuous enrollment policy directly caused these improved outcomes, but the findings suggest that avoiding administrative churn can help people stay covered without ballooning costs.
“It seems reasonable to me,” Nikpay said of the findings, “that making it easier to stay on Medicaid, even outside of a global pandemic, could benefit people’s health given what we know about how Medicaid affects people.”
The AHA has previously noted the third party observers who demonstrate a tenuous grasp of the data and rules regarding federal hospital transparency requirements. Now, some of those same entities with deep pockets and an apparent vendetta against hospitals and health systems have turned their attention toward the broader financial challenges facing the field. The results, as described in a recent Health Affairs blog, are as expected — a complete misunderstanding of current economic realities.
The three most egregious suggestions in this piece are that hospitals are seeking some kind of bailout from the federal government, employers and patients; that investment losses are the most problematic aspect of hospital financing; and that hospitals’ analyses of their financial situation are dishonest.
We debunk these in turn.
Hospitals are seeking fair compensation, not a government bailout. The authors state that hospitals are asking “constituents to foot the bill for hospitals’ investment losses.” This is patently false. Indeed, if you read the request we made to Congress cited in their blog, hospitals and health systems are simply asking to get paid for the care they deliver or to lower unnecessary administrative costs. This includes asking Medicare to pay for the days hospitals care for patients who are otherwise ready for discharge. Increasingly, this has occurred because there is no space in the next site of care or the patient’s insurer has delayed the authorization for that care. Keeping someone in a hospital bed for days, if not weeks, requires skilled labor, supplies and basic infrastructure costs. This doesn’t even account for the impact on a patient’s health for not being in the most appropriate care setting. Today, hospitals are not paid for these days. Asking for fair compensation is not a bailout; it is a basic responsibility of any purchaser.
While investment income may be down, hospitals and health systems have faced massive expense increases in the last year. The authors note that patient care revenue was up “by just below 1 percent in relative terms from 2021 to 2022,” suggesting that implies a positive financial trend. However, hospital total expenses were up 7% in 2022 over 2021, and were up by even more, 20%, when compared to pre-pandemic levels, according to Kaufman Hall. And it’s not just the AHA and Kaufman Hall saying this either: in its 2023 outlook, credit rating agency Moody’s noted that “margins will remain constrained by high expenses.” Hospitals should not need to rely on investment income for operations. However, many have been forced into this situation by substantial underpayments from their largest payers (Medicare and Medicaid), which even the Medicare Payment Advisory Commission (MedPAC), an independent advisor to Congress, has acknowledged. MedPAC’s most recent report showed a negative 8.3% Medicare operating margin. Hospitals and health systems are experiencing run-away increases in the supplies, labor and technology needed to care for patients. At the same time, commercial insurance companies are increasing their use of policies that can cause dangerous delays in care for patients, result in undue burden on health care providers and add billions of dollars in unnecessary costs to the health care system.
Hospitals and health systems are committed to an honest examination of the facts. The authors imply that the studies documenting hospitals’ financial distress are biased. They note that certain studies conducted by Kaufman Hall are based on proprietary data and therefore “challenging to draw general inferences.” They then go on to cherry-pick metrics from specific non-profit health care systems voluntarily released financial disclosures to make general claims about “the primary driver of hospitals’ financial strain.” The authors and their financial backers clearly seem to have a preconceived narrative, and ignore all the other realities that hospital and health system leaders are confronting every day to ensure access to care and programs for the patients and communities they serve.
It is imperative to acknowledge financial challenges facing hospitals and health systems today. Too much is at stake for the patients and communities that depend upon hospitals and health systems to be there, ready to care.