In this week’s graphic, we highlight how the primary care provider workforce has evolved over the past decade in both the pursuit of team-based care models and value-based care, as well as in response to rising labor costs and physician shortages.
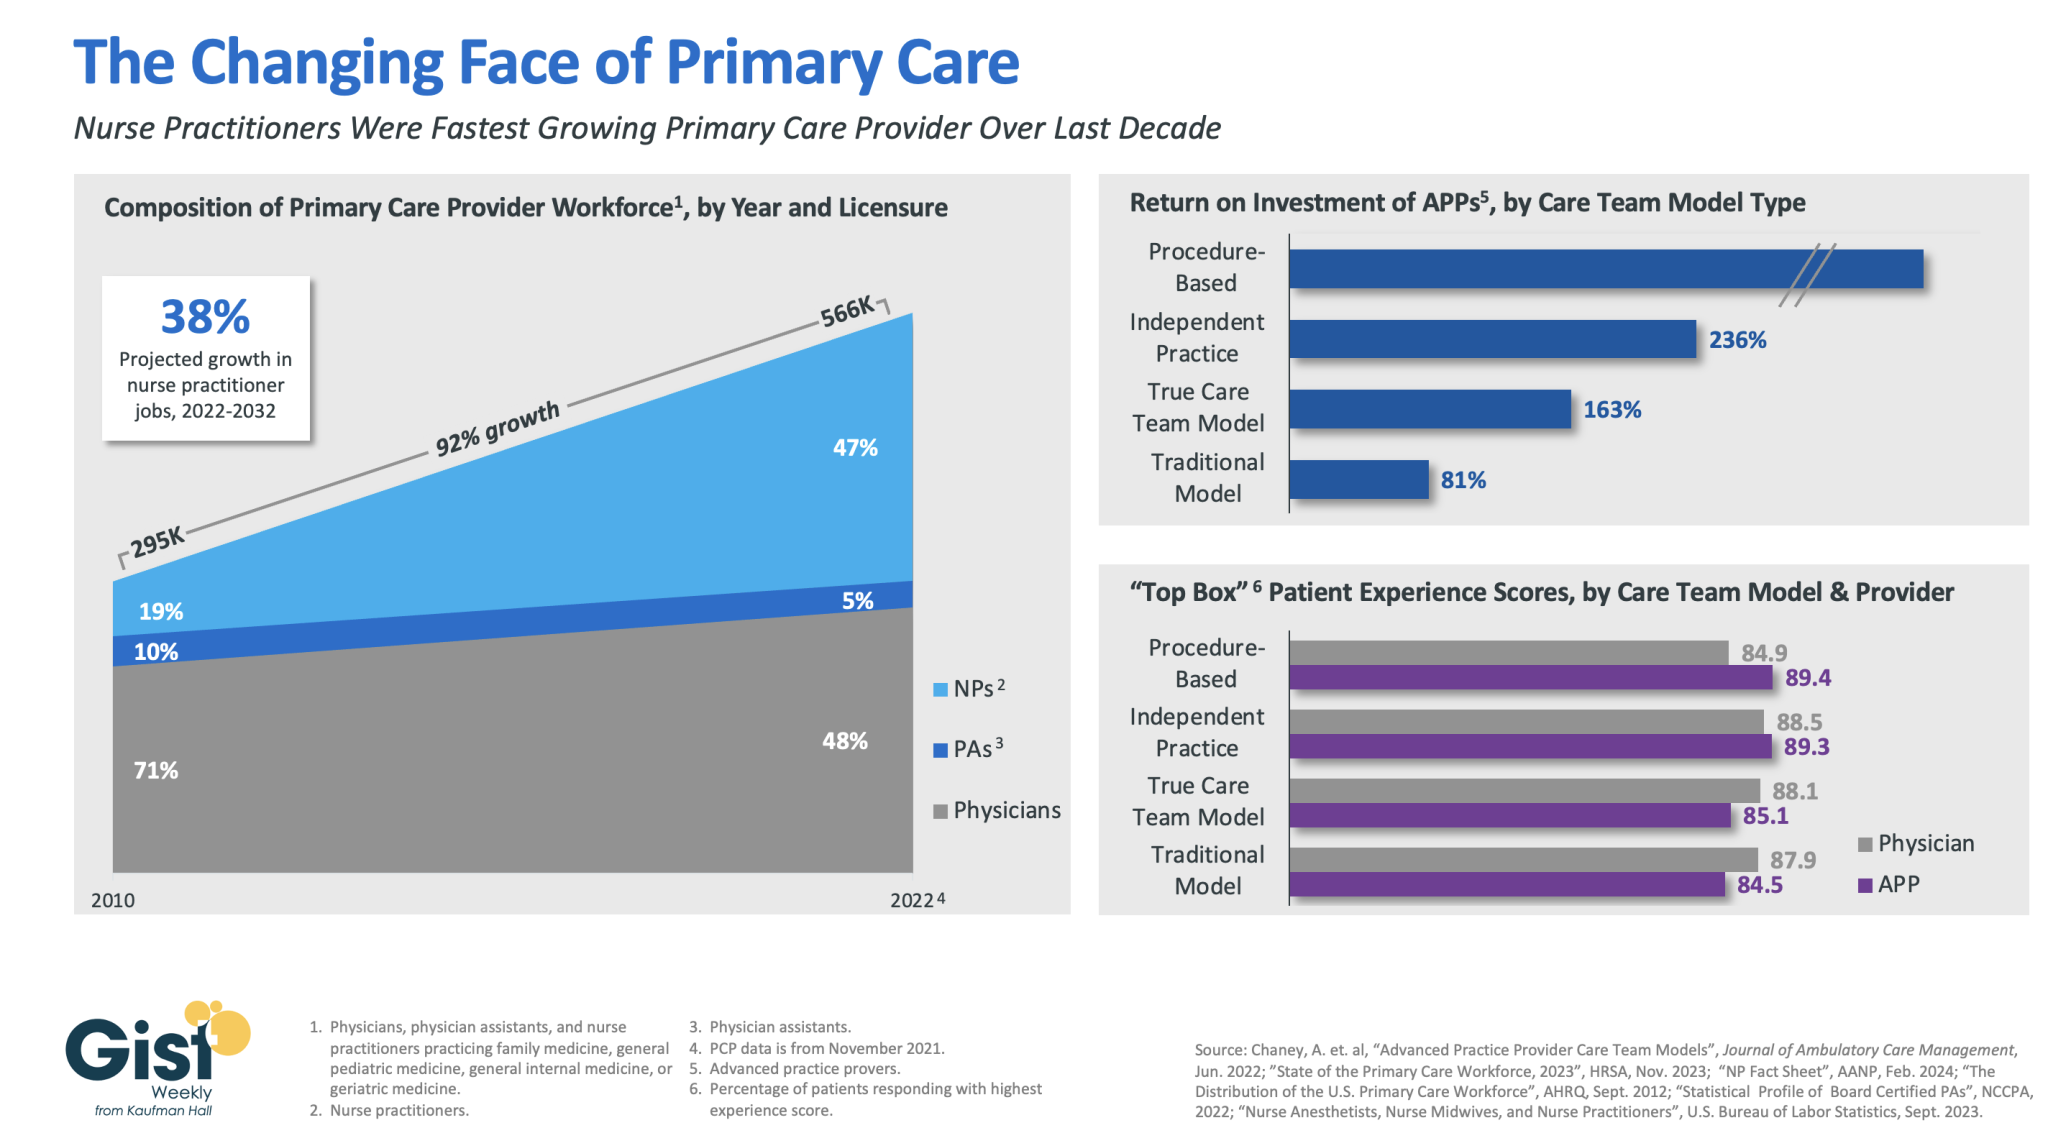
In 2010, physicians made up more than 70 percent of the primary care workforce. But over the next 12 years, the number of primary care providers nearly doubled, largely driven by immense growth of nurse practitioners in the workforce.
As of 2022, more than half of primary care providers were advanced practice providers (APPs), who continue to have a strong job outlook across the next decade (especially nurse practitioners).This shift has been beneficial to many provider organizations.
In a study from the Mayo Clinic, the return on investment was positive across a variety of APP practice models, especially in procedural-based specialties but across both independent practice models and full care team models as well.
APPs also receive similar patient experience scores as their physician counterparts.
Continued integration of APPs in team-based care models remains a key strategy for health systems seeking to improve access while lowering costs, especially in primary care.
A recent engagement with a health system executive team to discuss an underperforming service line uncovered a serious issue that’s becoming more common across the industry.
“Our providers are more productive than ever,” the CFO informed our team, “and yet we keep losing money on the service line.”
After digging into their physician compensation model, we came upon one source of the system’s issue. Because it was incentivizing physician RVUs equally across all payers, its providers responded, quite rationally, by picking up market share where growth was easiest: Medicaid patients, who weren’t generating any margin.
“We recognize that we’ve been employing these physicians as loss leaders in order to generate downstream revenue,” the CFO shared, “but what’s the point of that revenue if there’s no longer any downstream margin?”
The economics of physician employment becomes a tough conversation very quickly; it’s a sensitive topic to many, and one with myriad facets.
But the loss leader physician employment model obviously only works when it produces positive downstream margins.
We’re in a critical window of time, where hospital margins are just beginning to recover as volumes return—but those volumes are not necessarily in the same places as before.
The opportunity is ripe for systems to work closely with their aligned physicians to reexamine the post-pandemic margin picture for individual service lines and ensure incentives are aligning all parties to hit operating margin goals.
Are these kinds of conversations taking place at your health system?
Layoffs are slowing at hospitals and health systems as margins gradually improve, but CFOs continue to focus on controlling costs — particularly on the labor and supply fronts — to secure the long-term sustainability of their organizations.
Last year was characterized by hospital and health systems big and small trimming their workforces due to financial and operational challenges.
From October 2022 through December 2023, Becker’sreported on more than 100 hospitals and health systems across the country that laid off workers, eliminated positions or reduced or closed certain facilities and services to help shore up finances.
While layoffs have been reported at some hospitals this year, workforce cuts have been occuring at a slower rate compared to last year.
Hospital revenues are up year over year as patient volumes continue to rebound. Operating margins have fluctuated in the last 12 months, from a -1.2% low in February 2023 to 5.5% highs in June and December, according to Kaufman Hall. In January, average operating and operating EBITDA margins dropped to 5.1%.
Kaufman analysts noted that too many hospitals are losing money and high-performing hospitals doing better and better, “effectively pulling away from the pack.”
Fitch Ratings has described 2024 as another “make or break” year for a significant portion of the nonprofit hospital sector, which continues to battle an ongoing “labordemic.” However, the U.S. has also avoided a recession so far, partly due to a robust healthcare job market, according to The Wall Street Journal.
Nearly a quarter of health systems are appointing new executives to lead provider compensation — a function previously headed by COOs and CFOs, according to a recent report shared with Becker’s.
That stat comes from the American Association of Provider Compensation Professionals, which recently surveyed 75 U.S. health systems and medical groups to learn more about their management methods.
Health systems have been expanding their provider networks since the late 2000s and are continuing to work toward alignment, according to the report. Previously, COOs and CFOs might have led provider compensation strategy — but the arena has grown too complex and calls for an executive presence of its own.
As such, a number of roles specific to provider compensation have emerged, from the executive director level up to the senior vice presidency. Nearly 25% of health systems surveyed have created a new executive position to develop and lead a provider compensation department; 93% of these departments have sole responsibility for their organization’s compensation design and 84% have full control of compensation strategy, from management of fair market value to contract management.
“The core function of this new resource, department, and team was to build and manage compensation models developed for physicians. For many organizations, this expanded to include advanced practice providers,” the report says. “Over the years, organizations have understood the role to be much more strategic than initially proposed, which is why organizations across the country have developed roles [specific to provider compensation].”
Saint Peter’s Healthcare System in New Brunswick, N.J., was six years ahead of the C-suite streamlining curve.
The health system slimmed down its leadership structure in 2017, President and CEO Les Hirsch told Becker’s. A top-heavy executive team grew unsustainable as the system struggled financially, operating at a loss. Saint Peter’s board decided to combine the president and CEO positions — which were previously split in two. Then, as president and CEO, Mr. Hirsch cut five vice presidents’ positions, including the consolidation of the chief information officer and chief medical information officer roles. More than 20 middle-manager positions were also cut or consolidated.
The streamlining of senior leadership positions alone at the time eliminated over $4 million in salaries and benefits, according to Mr. Hirsch. With the old leadership structure, Saint Peter’s spent about 2.4% of its revenue on senior leaders’ compensation. Last year, that percentage sank to 1.34%.
But finances shouldn’t be the only consideration for a health system planning to whittle down its structure.
“The good news is, we’re lean,” Mr. Hirsch said. “The bad news is, we’re lean.”
Since consolidating the president and CEO roles — and not having a chief operating officer — succession planning is more complicated, per Mr. Hirsch.
“There’s no designated No. 2,” he said. “Our senior leadership team structure is very flat.”
A condensed C-suite also means more work for some members of the leadership team — which is taken in stride, Mr. Hirsch said. There’s no specific “planning” department, so executives put their heads together on strategy, growth and development initiatives. There is no government relations officer, but Mr. Hirsch, as CEO, takes primary responsibility for this function and is very active in advocacy.
Anyone who works on a lean team like this also “has to be a generalist,” Mr. Hirsch said. He stays up to date on the literature and sends relevant articles to other executives.
“Considering our size as one of the few remaining single-hospital health systems in New Jersey, we don’t have the luxury of having somebody specifically responsible for artificial intelligence or other niche responsibilities as these are functions that are absorbed within people’s roles,” Mr. Hirsch said. “And we all develop the knowledge needed so that we can understand how new ideas or resources may apply to us. When you’re smaller and don’t have the scale of these mega-organizations, you have to do more yourself. You roll up your sleeves.”
Despite these challenges, a little can go a long way; three departmental administrators now split the job once shared by seven people at Saint Peter’s. There’s been no hit to efficiency; “they’re more effective in their roles as departmental administrators than anybody that I’ve ever seen,” Mr. Hirsch said.
The changes to streamline management were also well-received by the workforce. Often layoffs affect front-line workers more than management or senior leadership — which may have contributed to the lack of outcry, per Mr. Hirsch. But he primarily attributes the positive reception to intentional transparency.
“Most importantly, I’m a very active communicator. So, I communicated about it. It wasn’t that there was some intrigue and mystery in the organization that people were hearing by rumor,” Mr. Hirsch said.
“Rumors — like fear — are two things that equate to being like a cancer in an organization,” he continued. “I always want to do everything I possibly can to set the facts straight and communicate with people. If it’s not confidential and I can communicate it, I will. In fact, I’ll err more on the side of communicating than keeping information close to the vest.”
Regardless of who is affected by layoffs, executives should always handle them with sensitivity, Mr. Hirsch emphasized; the right choice for an organization is not always the easy choice for its people.
“It’s always painful when you’re making these kinds of changes because they affect people, and you always have to go about those changes in a very thoughtful, considerate, and compassionate way,” Mr. Hirsch said. “You’re eliminating roles and impacting people’s lives, their careers and their family. So, I always keep that top of mind.”
Asexpected, 2023 saw a material increase in downgrades over 2022 while the number of upgrades declined from the prior year. Volume showed favorable growth for many hospitals during 2023 although some indicators remained below pre-pandemic levels. Other hospitals reported a payer mix shift toward more Medicare as the population continued to age and Medicare Advantage plans gained momentum at the expense of commercial revenues. Continued labor challenges drove expense growth, even with many organizations reporting a reduction in temporary labor, as permanent hires pressured salary and benefit expenses. Some of the downgrades reflected pronounced operating challenges that led to covenant violations while others were due to a material increase in leverage viewed to be too high for the rating category.
Figure1: Downgrades at Moody’s, S&P, and Fitch
Here are five key takeaways:
The ratio of downgrades to upgrades reached a high level for all three rating agencies: Moody’s, 3.2-to-1; S&P: 3.8-to-1; and Fitch: 3.5-to-1. In 2022, the ratio crested just above 2.0-to-1 at the highest among the three firms.
Downgrades covered a wide swath of hospitals, ranging from single-site general acute care facilities to academic medical centers as well as large regional and multistate systems. Many of the hospital downgrades were concentrated in New York, Pennsylvania, Ohio, and Washington. All rating categories saw downgrades, although the majority were clustered in the Baa/BBB and lower categories.
Multi-notch downgrades were mainly relegated to ratings that were already deep into speculative grade. Multi-notch upgrades were due to mergers or acquisitions where the debt was guaranteed by or added to the legal borrowing group of the higher rated system.
Upgrades reflected fundamental improvement in financial performance and debt service coverage along with strengthening balance sheet indicators. Like the downgraded organizations, upgraded hospitals and health systems ranged from single-site hospitals to expansive, super-regional systems. Some of the upgrades reflected mergers into higher-rated systems.
The wide span between downgrades to upgrades in 2023 would suggest that the credit gap between highly rated hospitals (say, the “A” or “Aa/AA” category) compared to “Baa/BBB” and speculative grade is widening. That said, given that rating affirmations remain the predominant rating activity annually, the rating agencies reported only a subtle shift in the overall distribution of ratings since the beginning of the pandemic in their panel discussion at Kaufman Hall’s October 2023 Healthcare Leadership Conference.
One person’s prediction for 2024?
It’s a safe bet that downgrades will outpace upgrades given the persistent challenges, although the ratio may narrow if the improvement in current performanceholds. That said, the rating agencies are maintaining mixed views for 2024. S&P and Fitch are sticking with negative and deteriorating outlooks, respectively, while Moody’s has revised its outlook to stable, anticipating that the rough times of 2022 are behind us.
All three rating agencies predict that we are not out of the woods yet when it comes to covenant challenges, especially in the lower rating categories or for those organizations that report a second year of covenant violations.
Earlier this month, leaders from more than 400 organizations descended on San Francisco for J.P. Morgan‘s 42nd annual healthcare conference to discuss some of the biggest issues in healthcare today. Here’s how Advisory Board experts are thinking about Modern Healthcare’s 10 biggest takeaways — and our top resources for each insight.
How we’re thinking about the top 10 takeaways from JPM’s annual healthcare conference
Following the conference, Modern Healthcare provided a breakdown of the top-of-mind issues attendees discussed.
Here’s how our experts are thinking about the top 10 takeaways from the conference — and the resources they recommend for each insight.
1. Ambulatory care provides a growth opportunity for some health systems
By Elizabeth Orr, Vidal Seegobin, and Paul Trigonoplos
At the conference, many health system leaders said they are evaluating growth opportunities for outpatient services.
However, results from our Strategic Planner’s Survey suggest only the biggest systems are investing in building new ambulatory facilities. That data, alongside the high cost of borrowing and the trifurcation of credit that Fitch is predicting, suggests that only a select group of health systems are currently poised to leverage ambulatory care as a growth opportunity.
Systems with limited capital will be well served by considering other ways to reach patients outside the hospital through virtual care, a better digital front door, and partnerships. The efficiency of outpatient operations and how they connect through the care continuum will affect the ROI on ambulatory investments. Buying or building ambulatory facilities does not guarantee dramatic revenue growth, and gaining ambulatory market share does not always yield improved margins.
While physician groups, together with management service organizations, are very good at optimizing care environments to generate margins (and thereby profit), most health systems use ambulatory surgery center development as a defensive market share tactic to keep patients within their system.
This approach leaves margins on the table and doesn’t solve the growth problem in the long term. Each of these ambulatory investments would do well to be evaluated on both their individual profitability and share of wallet.
On January 24 and 25, Advisory Board will convene experts from across the healthcare ecosystem to inventory the predominant growth strategies pursued by major players, explore considerations for specialty care and ambulatory network development, understand volume and site-of-care shifts, and more. Register here to join us for the Redefining Growth Virtual Summit.
Also, check out our resources to help you plan for shifts in patient utilization:
2. Rebounding patient volumes further strain capacity
By Jordan Peterson, Eliza Dailey, and Allyson Paiewonsky
Many health system leaders noted that both inpatient and outpatient volumes have surpassed pre-pandemic levels, placing further strain on workforces.
The rebound in patient volumes, coupled with an overstretched workforce, underscores the need to invest in technology to extend clinician reach, while at the same time doubling down on operational efficiency to help with things like patient access and scheduling.
For leaders looking to leverage technology and boost operational efficiency, we have a number of resources that can help:
3. Health systems aren’t specific on AI strategies
By Paul Trigonoplos and John League
According to Modern Healthcare, nearly all health systems discussed artificial intelligence (AI) at the conference, but few offered detailed implementation plans and expectations.
Over the past year, a big part of the work for Advisory Board’s digital health and health systems research teams has been to help members reframe the fear of missing out (FOMO) that many care delivery organizations have about AI.
We think AI can and will solve problems in healthcare. Every organization should at least be observing AI innovations. But we don’t believe that “the lack of detail on healthcare AI applications may signal that health systems aren’t ready to embrace the relatively untested and unregulated technology,” as Modern Healthcare reported.
The real challenge for many care delivery organizations is dealing with the pace of change — not readiness to embrace or accept it. They aren’t used to having to react to anything as fast-moving as AI’s recent evolution. If their focus for now is on low-hanging fruit, that’s completely understandable. It’s also much more important for these organizations to spend time now linking AI to their strategic goals and building out their governance structures than it is to be first in line with new applications.
Check out our top resources for health systems working to implement AI:
Digital health companies like Teladoc, R1 RCM, Veradigm, and Talkspace all spoke out about their use of generative AI.
This does not surprise us at all. In fact, we would be more surprised if digital health companies were not touting their AI capabilities. Generative AI’s flexibility and ease of use make it an accessible addition to nearly any technology solution.
However, that alone does not necessarily make the solution more valuable or useful. In fact, many organizations would do well to consider how they want to apply new AI solutions and compare those solutions to the ones that they would have used in October 2022 — before ChatGPT’s newest incarnation was unveiled. It may be that other forms of AI, predictive analytics, or robotic process automation are as effective at a better cost.
Again, we believe that AI can and will solve problems in healthcare. We just don’t think it will solve every problem in healthcare, or that every solution benefits from its inclusion.
During the conference, providers criticized insurers for the rate of denials, Modern Healthcare reports.
Denials — along with other utilization management techniques like prior authorization — continue to build tension between payers and providers, with payers emphasizing their importance for ensuring cost effective, appropriate care and providers overwhelmed by both the administrative burden and the impact of denials on their finances.
Many health plans have announced major moves to reduce prior authorizations and CMS recently announced plans to move forward with regulations to streamline the prior authorization process. However, these efforts haven’t significantly impacted providers yet.
In fact, most providers report no decrease in denials or overall administrative burden. A new report found that claims denials increased by 11.99% in the first three quarters of 2023, following similar double digit increases in 2021 and 2022.
Our team is actively researching the root cause of this discrepancy and reasons for the noted increase in denials. Stay tuned for more on improving denials performance — and the broader payer-provider relationship — in upcoming 2024 Advisory Board research.
For now, check out this case study to see how Baptist Health achieved a 0.65% denial write-off rate.
6. Insurers are prioritizing Star Ratings and risk adjustment changes
By Mallory Kirby
Various insurers and providers spoke about “the fallout from star ratings and risk adjustment changes.”
2023 presented organizations focused on MA with significant headwinds. While many insurers prioritized MA growth in recent years, leaders have increased their emphasis on quality and operational excellence to ensure financial sustainability.
With an eye on these headwinds, it makes sense that insurers are upping their game to manage Star Ratings and risk adjustment. While MA growth felt like the priority in years past, this focus on operational excellence to ensure financial sustainability has become a priority.
We’ve already seen litigation from health plans contesting the regulatory changes that impact the bottom line for many MA plans. But with more changes on the horizon — including the introduction of the Health Equity Index as a reward factor for Stars and phasing in of the new Risk Adjustment Data Validation model — plans must prioritize long-term sustainability.
Check out our latest MA research for strategies on MA coding accuracy and Star Ratings:
Pharmacy benefit manager (PBM) leaders discussed the ways they are preparing for potential congressional action, including “updating their pricing models and diversifying their revenue streams.”
Healthcare leaders should be prepared for Congress to move forward with PBM regulation in 2024. A final bill will likely include federal reporting requirements, spread pricing bans, and preferred pricing restrictions for PBMs with their own specialty pharmacy. In the short term, these regulations will likely apply to Medicare and Medicaid population benefits only, and not the commercial market.
Congress isn’t the only entity calling for change. Several states passed bills in the last year targeting PBM transparency and pricing structures. The Federal Trade Commission‘s ongoing investigation into select PBMs looks at some of the same practices Congress aims to regulate. PBM commercial clients are also applying pressure. In 2023, Blue Cross Blue Shield of California‘s (BSC) decided to outsource tasks historically performed by their PBM partner. A statement from BSC indicated the change was in part due to a desire for less complexity and more transparency.
Here’s what this means for PBMs:
Transparency is a must
The level of scrutiny on transparency will force the hand of PBMs. They will have to comply with federal and state policy change and likely give something to their commercial partners to stay competitive. We’re already seeing this unfold across some of the largest PBMs. Recently, CVS Caremarkand Express Scripts launched transparent reimbursement and pricing models for participating in-network pharmacies and plan sponsors.
While transparency requirements will be a headache for larger PBMs, they might be a real threat to smaller companies. Some small PBMs highlight transparency as their main value add. As the larger PBMs focus more on transparency, smaller PBMs who rely on transparent offerings to differentiate themselves in a crowded market may lose their main competitive edge.
PBMs will have to try new strategies to boost revenue
PBM practice of guiding prescriptions to their own specialty pharmacy or those providing more competitive pricing is a key strategy for revenue. Stricter regulations on spread pricing and patient steerage will prompt PBMs to look for additional revenue levers.
PBMs are already getting started — with Express Scripts reporting they will cut reimbursement for wholesale brand name drugs by about 10% in 2024. Other PBMs are trying to diversify their business opportunities. For example, CVS Caremark’s has offered a new TrueCost model to their clients for an additional fee. The model determines drug prices based on the net cost of drugs and clearly defined fee structures. We’re also watching growing interest in cross-benefitutilization management programs for specialty drugs. These offerings look across both medical and pharmacy benefits to ensure that the most cost-effective drug is prescribed for patients.
At the conference, retailers such as CVS, Walgreens, and Amazon doubled down on their healthcare services strategies.
Typically, disruptors do not get into care delivery because they think it will be easy. Disruptors get into care delivery because they look at what is currently available and it looks so hard — hard to access, hard to understand, and hard to pay for.
Many established players still view so-called disruptors as problematic, but we believe that most tech companies that move into healthcare are doing what they usually do — they look at incumbent approaches that make it hard for customers and stakeholders to access, understand, and pay for care, and see opportunities to use technology and innovative business models in an attempt to target these pain points.
CVS, Walgreens, and Amazon are pursuing strategies that are intended to make it more convenient for specific populations to get care. If those efforts aren’t clearly profitable, that does not mean that they will fail or that they won’t pressure legacy players to make changes to their own strategies. Other organizations don’t have to copy these disruptors (which is good because most can’t), but they must acknowledge why patient-consumers are attracted to these offerings.
For more information on how disruptors are impacting healthcare, check out these resources:
9. Financial pressures remain for many health systems
By Vidal Seegobin and Marisa Nives
Health systems are recovering from the worst financial year in recent history. While most large health systems presenting at the conference saw their finances improve in 2023, labor challenges and reimbursement pressures remain.
We would be remiss to say that hospitals aren’t working hard to improve their finances. In fact, operating margins in November 2023 broke 2%. But margins below 3% remain a challenge for long-term financial sustainability.
One of the more concerning trends is that margin growth is not tracking with a large rebound in volumes. There are number of culprits: elevated cost structures, increased patient complexity, and a reimbursement structure shifting towards government payers.
For many systems, this means they need to return to mastering the basics: Managing costs, workforce retention, and improving quality of care. While these efforts will help bridge the margin gap, the decoupling of volumes and margins means that growth for health systems can’t center on simply getting bigger to expand volumes.
Maximizing efficiency, improving access, and bending the cost curve will be the main pillars for growth and sustainability in 2024.
To learn more about what health system strategists are prioritizing in 2024, read our recent survey findings.
Also, check out our resources on external partnerships and cost-saving strategies:
During the conference, MA insurers reported seeing a spike in utilization driven by increased doctor’s visits and elective surgeries.
These increased medical expenses are putting more pressure on MA insurers’ margins, which are already facing headwinds due to CMS changes in MA risk-adjustment and Star Ratings calculations.
However, this increased utilization isn’t all bad news for insurers. Part of the increased utilization among seniors can be attributed to more preventive care, such as an uptick in RSV vaccinations.
In UnitedHealth Group‘s* Q4 earnings call, CFO John Rex noted that, “Interest in getting the shot, especially among the senior population, got some people into the doctor’s office when they hadn’t visited in a while,” which led to primary care physicians addressing other care needs. As seniors are referred to specialty care to address these needs, plans need to have strategies in place to better manage their specialist spend.
The lawsuit filed in federal court seeks to represent thousands of other UPMC employees.
Dive Brief:
A nurse is suing the University of Pittsburgh Medical Center for allegedly leveraging its monopoly control over the employment market in Pennsylvania to keep wages down and prevent workers from leaving for competitors, all while increasing their workload.
The lawsuit, filed late last week in a federal court, seeks class action status to represent other staff at the nonprofit health system. Plaintiff Victoria Ross, who worked as a nurse at UPMC Hamot in Erie, Pennsylvania, seeks damages and is asking the judge to enjoin UPMC from continuing its unfair business practices.
If granted class action status, the lawsuit could represent thousands of current and former UPMC workers, including registered nurses, medical assistants and orderlies. UPMC has denied the allegations in statements to other outlets but did not respond to a request for comment by time of publication.
Dive Insight:
UPMC has grown steadily over the past few decades into the largest private employer in Pennsylvania, employing 95,000 workers overall.
From 1996 to 2018, the system acquired 28 competing healthcare providers, greatly expanding its market power, according to the lawsuit. The acquisitions also shrunk the availability of healthcare services. Over the same period, UPMC closed four hospitals and downsized operations in three other facilities, eliminating 1,800 full- and part-time jobs, the lawsuit said.
UPMC relied on “draconian” mobility restrictions and labor law violations to lock employees into lower pay and subcompetitive working conditions, according to the 44-page complaint.
Specifically, the system enacted restraints like noncompete clauses and “do-not-rehire blacklists” to stop workers from leaving. Meanwhile, UPMC allegedly suppressed workers’ labor law rights to prevent them from unionizing.
“Each of these restraints alone is anticompetitive, but combined, their effects are magnified.UPMC wielded these restraints together as a systemic strategy to suppress worker bargaining power and wages,” the lawsuit said. “As a result, UPMC’s skilled healthcare workers were required to do more while earning less — while they were also subjected to increasingly unfair and coercive workplace conditions.”
According to the complaint, UPMC has faced 133 unfair labor practice charges since 2012, and 159 separate allegations. Roughly 74% of the violations were related to workers’ efforts to unionize, the lawsuit said.
Meanwhile, UPMC workers’ wages have fallen at a rate of 30 to 57 cents per hour on average compared to other hospital workers for every 10% increase in UPMC’s market share, said the lawsuit, citing a consultant’s economic analysis.
The lawsuit also noted that UPMC’s staffing ratios have been decreasing, even as staffing ratios on average have increased at other Pennsylvania hospitals.
The alleged labor abuses and UPMC’s market power are linked, according to the complaint.
“Had UPMC been subject to competitive market forces, it would have had to raise wages to attract more workers and provide higher staffing levels in order to avoid degrading the care it provided to its patients, and in order to prevent losing patients to competitors who could provide better quality care,” the lawsuit said.
UPMC is facing similar labor allegations. In May, two unions filed a complaint asking the Department of Justice to investigate labor abuses at the nonprofit.
Hospitals were plagued by staffing shortages during the COVID-19 pandemic. Many facilities still bemoan the difficulty of hiring and retaining full-time workers, and point to shortages (of nurses in particular) as the reason for overworked employees and poor staffing ratios.
Yet some studies suggest that’s not the case. One recent analysis of Bureau of Labor Statistics data found employment in hospitals — including registered nurses — is now slightly higher than it was at the start of the pandemic.
Despite the controversy, UPMC — which now operates 40 hospitals with annual revenue of $26 billion — continues to try and expand its market share. Late last year, the system signed a definitive agreement to acquire Washington Health Care Services, a Pennsylvania system with more than 2,000 employees and two hospitals. The deal faces pushback from local unions.
The National Labor Relations Board has certified the union election of more than 130 Allina Health doctors at Mercy and Unity Hospitals, nearly a year after they voted to join the Doctors Council Service Employees International Union (SEIU).
The certification follows objections from the Minneapolis-based nonprofit health system, which said that physicians active in the union drive held supervisor or managerial positions and may have unlawfully pressured colleagues into supporting the union. The NLRB rejected that claim.
It’s another victory for Doctors Council SEIU at Allina facilities. In October, more than 500 Allina doctors, physician assistants and nurse practitioners at over 60 facilities voted to join the union, according to NLRB documents.
Dive Insight:
Allina doctors and physician assistants said that chronic understaffing, high levels of burnout and compromised patient safety due to the corporatization of care motivated them to seek union representation.
“We have been seeing the shift of healthcare control going to corporations and further and further away from patient voices and patient advocacy. That really fell apart during the pandemic,” said Allina physician Liz Koffel during a press conference on Aug. 15 announcing primary care physicians’ unionization drive.
In a statement to Healthcare Dive, an Allina spokesperson said the system had “committed to taking steps to make sure the National Labor Relations Board’s process was fair to all involved,” and that it would not take further procedural action against the union.
Across the country, physicians’ feelings of limited autonomy is driving similar interest in unionization, according to John August, director of healthcare labor relations at Cornell’s School of Industrial and Labor Relations.
“Frankly, I’ve never seen anything like it in my whole career — where so many people are saying exactly the same thing at the same time, from a profession that heretofore has been essentially not unionized,” he said.
Doctors are increasingly working in consolidated hospitals owned by larger health systems or private equity firms. They report consolidation limits the influence they have on their day-to-day jobs, according to a December study from the Physician Advocacy Institute.
In addition, other options, such as physician-owned practices, are disappearing, with the percentage of owned practices falling 13% between 2012 and 2022, according to an analysis from the American Medical Association.
Elsewhere in the healthcare industry, unionization and strikes have led to gains for workers.
A new perspective on how technology, transformation efforts, and other changes have affected payers, health systems, healthcare services and technology, and pharmacy services.
The acute strain from labor shortages, inflation, and endemic COVID-19 on the healthcare industry’s financial health in 2022 is easing. Much of the improvement is the result of transformation efforts undertaken over the last year or two by healthcare delivery players, with healthcare payers acting more recently. Even so, health-system margins are lagging behind their financial performance relative to prepandemic levels. Skilled nursing and long-term-care profit pools continue to weaken. Eligibility redeterminations in a strong employment economy have hurt payers’ financial performance in the Medicaid segment. But Medicare Advantage and individual segment economics have held up well for payers.
As we look to 2027, the growth of the managed care duals population (individuals who qualify for both Medicaid and Medicare) presents one of the most substantial opportunities for payers. On the healthcare delivery side, financial performance will continue to rebound as transformation efforts, M&A, and revenue diversification bear fruit. Powered by adoption of technology, healthcare services and technology (HST) businesses, particularly those that offer measurable near-term improvements for their customers, will continue to grow, as will pharmacy services players, especially those with a focus on specialty pharmacy.
Below, we provide a perspective on how these changes have affected payers, health systems, healthcare services and technology, and pharmacy services, and what to expect in 2024 and beyond.
The fastest growth in healthcare may occur in several segments
We estimate that healthcare profit pools will grow at a 7 percent CAGR, from $583 billion in 2022 to $819 billion in 2027. Profit pools continued under pressure in 2023 due to high inflation rates and labor shortages; however, we expect a recovery beginning in 2024, spurred by margin and cost optimization and reimbursement-rate increases.
Several segments can expect higher growth in profit pools:
Within payer, Medicare Advantage, spurred by the rapid increase in the duals population; the group business, due to recovery of margins post-COVID-19 pandemic; and individual
Within health systems, outpatient care settings such as physician offices and ambulatory surgery centers, driven by site-of-care shifts
Within HST, the software and platforms businesses (for example, patient engagement and clinical decision support)
Within pharmacy services, with specialty pharmacy continuing to experience rapid growth
On the other hand, some segments will continue to see slow growth, including general acute care and post-acute care within health systems, and Medicaid within payers (Exhibit 1).
Several factors will likely influence shifts in profit pools. Two of these are:
Change in payer mix. Enrollment in Medicare Advantage, and particularly the duals population, will continue to grow. Medicare Advantage enrollment has grown historically by 9 percent annually from 2019 to 2022; however, we estimate the growth rate will reduce to 5 percent annually from 2022 to 2027, in line with the latest Centers for Medicare & Medicaid Services (CMS) enrollment data.1 Finally, the duals population enrolled in managed care is estimated to grow at more than a 9 percent CAGR from 2022 through 2027.
We also estimate commercial segment profit pools to rebound as EBITDA margins likely return to historical averages by 2027. Growth is likely to be partially offset by enrollment changes in the segment, prompted by a shift from fully insured to self-insured businesses that could accelerate as employers seek to cut costs if the economy slows. Individual segment profit pools are estimated to expand at a 27 percent CAGR from 2022 to 2027 as enrollment rises, propelled by enhanced subsidies, Medicaid redeterminations, and other potential favorable factors (for example, employer conversions through the Individual Coverage Health Reimbursement Arrangement offered by the Affordable Care Act); EBITDA margins are estimated to improve from 2 percent in 2022 to 5 to 7 percent in 2027. On the other hand, Medicaid enrollment could decline by about ten million lives over the next five years based on our estimates, given recent legislation allowing states to begin eligibility redeterminations (which were paused during the federal public health emergency declared at the start of the COVID-19 pandemic2).
Accelerating value-based care (VBC). Based on our estimates, 90 million lives will be in VBC models by 2027, from 43 million in 2022. This expansion will be fueled by an increase in commercial VBC adoption, greater penetration of Medicare Advantage, and the Medicare Shared Savings Program (MSSP) model in Medicare fee-for-service. Also, substantial growth is expected in the specialty VBC model, where penetration in areas like orthopedics and nephrology could more than double in the next five years.
VBC models are undergoing changes as CMS updates its risk adjustment methodology and as models continue to expand beyond primary care to other specialties (for example, nephrology, oncology, and orthopedics). We expect established models that offer improvements in cost and quality to continue to thrive. The transformation of VBC business models in response to pressures from the current changes could likely deliver outsized improvement in cost and quality outcomes. The penetration of VBC business models is likely to lead to shifts in health delivery profit pools, from acute-care settings to other sites of care such as ambulatory surgical centers, physician offices, and home settings.
Payers: Government segments are expected to be 65 percent larger than commercial segments by 2027
In 2022, overall payer profit pools were $60 billion. Looking ahead, we estimate EBITDA to grow to $78 billion by 2027, a 5 percent CAGR, as the market recovers and approaches historical trends. Drivers are likely to be margin recovery of the commercial segment, inflation-driven incremental premium rate rises, and increased participation in managed care by the duals population. This is likely to be partially offset by margin compression in Medicare Advantage due to regulatory pressures (for example, risk adjustment, decline in the Stars bonus, and technical updates) and membership decline in Medicaid resulting from the expiration of the public health emergency.
We estimate increased labor costs and administrative expenses to reduce payer EBITDA by about 60 basis points in 2023. In addition, health systems are likely to push for reimbursement rate increases (up to about 350 to 400 basis-point incremental rate increases from 2023 to 2027 for the commercial segment and about 200 to 250 basis points for the government segment), according to McKinsey analysis and interviews with external experts.3
Our estimates also suggest that the mix of payer profit pools is likely to shift further toward the government segment (Exhibit 2). Overall, the profit pools for this segment are estimated to be about 65 percent greater than the commercial segment by 2027 ($36 billion compared with $21 billion). This shift would be a result of increasing Medicare Advantage penetration, estimated to reach 52 percent in 2027, and likely continued growth in the duals segment, expanding EBITDA from $7 billion in 2022 to $12 billion in 2027.
Profit pools for the commercial segment declined from $18 billion in 2019 to $15 billion in 2022. We now estimate the commercial segment’s EBITDA margins to regain historical levels by 2027, and profit pools to reach $21 billion, growing at a 7 percent CAGR from 2022 to 2027. Within this segment, a shift from fully insured to self-insured businesses could accelerate in the event of an economic slowdown, which prompts employers to pay greater attention to costs. The fully insured group enrollment could drop from 50 million in 2022 to 46 million in 2027, while the self-insured segment could increase from 108 million to 113 million during the same period.
Health systems: Transformation efforts help accelerate EBITDA recovery
In 2023, health-system profit pools continued to face substantial pressure due to inflation and labor shortages. Estimated growth was less than 5 percent from 2022 to 2023, remaining below prepandemic levels. Health systems have undertaken major transformation and cost containment efforts, particularly within the labor force, helping EBITDA margins recover by up to 100 basis points; some of this recovery was also volume-driven.
Looking ahead, we estimate an 11 percent CAGR from 2023 to 2027, or total EBITDA of $366 billion by 2027 (Exhibit 3). This reflects a rebound from below the long-term historical average in 2023, spurred by transformation efforts and potentially higher reimbursement rates. We anticipate that health systems will likely seek reimbursement increases in the high single digits or higher upon contract renewals (or more than 300 basis points above previous levels) in response to cost inflation in recent years.
Measures to tackle rising costs include improving labor productivity and the application of technological innovation across both administration and care delivery workflows (for example, further process standardization and outsourcing, increased use of digital care, and early adoption of AI within administrative workflows such as revenue cycle management). Despite these measures, 2027 industry EBITDA margins are estimated to be 50 to 100 basis points lower than in 2019, unless there is material acceleration in performance transformation efforts.
There are some meaningful exceptions to this overall outlook for health systems. Although post-acute-care profit pools could be severely affected by labor shortages (particularly nurses), other sites of care might grow (for example, non-acute and outpatient sites such as physician offices and ambulatory surgery centers). We expect accelerated adoption of VBC to drive growth.
HST profit pools will grow in technology-based segments
HST is estimated to be the fastest-growing sector in healthcare. In 2021, we estimated HST profit pools to be $51 billion. In 2022, according to our estimates, the HST profit pool shrank to $49 billion, reflecting a contracting market, wage inflation pressure, and the drag of fixed-technology investment that had not yet fulfilled its potential. Looking ahead, we estimate a 12 percent CAGR in 2022–27 due to the long-term underlying growth trend and rebound from the pandemic-related decline (Exhibit 4). With the continuing technology adoption in healthcare, the greatest acceleration is likely to happen in software and platforms as well as data and analytics, with 15 percent and 22 percent CAGRs, respectively.
In 2023, we observed an initial recovery in the HST market, supported by lower HST wage pressure and continued adoption of technology by payers and health systems searching for ways to become more efficient (for example, through automation and outsourcing).
Three factors account for the anticipated recovery and growth in HST.First, we expect continued demand from payers and health systems searching to improve efficiency, address labor challenges, and implement new technologies (for example, generative AI). Second, payers and health systems are likely to accept vendor price increases for solutions delivering measurable improvements. Third, we expect HST companies to make operational changes that will improve HST efficiency through better technology deployment and automation across services.
Pharmacy services will continue to grow
The pharmacy market has undergone major changes in recent years, including the impact of the COVID-19 pandemic, the establishment of partnerships across the value chain, and an evolving regulatory environment. Total pharmacy dispensing revenue continues to increase, growing by 9 percent to $550 billion in 2022,4 with projections of a 5 percent CAGR, reaching $700 billion in 2027.5Specialty pharmacy is one of the fastest growing subsegments within pharmacy services and accounts for 40 percent of prescription revenue6; this subsegment is expected to reach nearly 50 percent of prescription revenue in 2027 (Exhibit 5). We attribute its 8 percent CAGR in revenue growth to increases in utilization and pricing as well as the continued expansion of pipeline therapies (for example, cell and gene therapies and oncology and rare disease therapies) and expect that the revenue growth will be partially offset by reimbursement pressures, specialty generics, and increased adoption of biosimilars. Specialty pharmacy dispensers are also facing an evolving landscape with increased manufacturer contract pharmacy pressures related to the 340B Drug Pricing Program. With restrictions related to size and location of contract pharmacies that covered entities can use, the specialty pharmacy subsegment has seen accelerated investment in hospital-owned pharmacies.
Retail and mail pharmacies continue to face margin pressure and a contraction of profit pools due to reimbursement pressure, labor shortages, inflation, and a plateauing of generic dispensing rates.7Many chains have recently announced8 efforts to rationalize store footprints while continuing to augment additional services, including the provision of healthcare services.
Over the past year, there has also been increased attention to broad-population drugs such as GLP-1s (indicated for diabetes and obesity). The number of patients meeting clinical eligibility criteria for these drugs is among the largest of any new drug class in the past 20 to 30 years. The increased focus on these drugs has amplified conversations about care and coverage decisions, including considerations around demonstrated adherence to therapy, utilization management measures, and prescriber access points (for example, digital and telehealth services). As we look ahead, patient affordability, cost containment, and predictability of spending will likely remain key themes in the sector.The Inflation Reduction Act is poised to change the Medicare prescription Part D benefit, with a focus on reducing beneficiary out-of-pocket spending, negotiating prices for select drugs, and incentivizing better management of high-cost drugs. These changes, coupled with increased attention to broad-population drugs and the potential of high-cost therapies (such as cell and gene therapies), have set the stage for a shift in care and financing models.
The US healthcare industry faced demanding conditions in 2023, including continuing high inflation rates, labor shortages, and endemic COVID-19. However, the industry has adapted. We expect accelerated improvement efforts to help the industry address its challenges in 2024 and beyond, leading to an eventual return to historical-average profit margins.