

Cartoon – Actual Results Indicate
https://www.cfodive.com/spons/5-new-responsibilities-for-the-beyond-finance-cfo/607630/
For years, pioneering CFOs steadily extended their duties beyond the boundaries of the traditional finance and accounting function. Over the past year, an expanding set of beyond-finance activities – including those related to environmental, social and governance (ESG) matters; human capital reporting; cybersecurity; and supply chain management – have grown in importance for most finance groups. Traditional finance and accounting responsibilities remain core requirements for CFOs, even as they augment planning, analysis, forecasting and reporting processes to thrive in the cloud-based digital era. Protiviti’s latest global survey of CFOs and finance leaders shows that CFOs are refining their new and growing roles by addressing five key areas:
Accessing new data to drive success – The ability of CFOs and finance groups to address their expanding priorities depends on the quality and completeness of the data they access, secure, govern and use. Even the most powerful, cutting-edge tools will deliver subpar insights without optimal data inputs. In addition, more of the data finance uses to generate forward-looking business insights is sourced from producers outside of finance group and the organization. Many of these data producers lack expertise in disclosure controls and therefore need guidance from the finance organization.
Developing long-term strategies for protecting and leveraging data – From a data-protection perspective, CFOs are refining their calculations of cyber risk while benchmarking their organization’s data security and privacy spending and allocations. From a data-leveraging perspective, finance chiefs are creating and updating roadmaps for investments in robotic process automation, business intelligence tools, AI applications, other types of advanced automation, and the cloud technology that serves as a foundational enabler for these advanced finance tools. These investments are designed to satisfy the need for real-time finance insights and analysis among a mushrooming set of internal customers.

Applying financial expertise to ESG reporting – CFOs are mobilizing their team’s financial reporting expertise to address unfolding Human Capital and ESG reporting and disclosure requirements. Leading CFOs are consummating their role in this next-generation data collection activity while ensuring that the organization lays the groundwork to maximize the business value it derives from monitoring, managing and reporting all forms of ESG-related performance metrics.
Elevating and expanding forecasting – Finance groups are overhauling forecasting and planning processes to integrate new data inputs, from new sources, so that the insights the finance organization produces are more real-time in nature and relevant to more finance customers inside and outside the organization. Traditional key performance indicators (KPIs) are being supplemented by key business indicators (KBIs) to provide sharper forecasts and viewpoints. As major new sources of political, social, technological and business volatility arise in an unsteady post-COVID era, forecasting’s value to the organization continues to soar.
Investing in long-term talent strategies – Finance groups are refining their labor model to become more flexible and gain long-term access to cutting-edge skills and innovative thinking in the face of an ongoing and persistent finance and accounting talent crunch. CFOs also are recalibrating their flexible labor models and helping other parts of the organization develop a similar approach to ensure the entire future organization can skill and scale to operate at the right size and in the right manner.

http://www.reason.com/2021/06/22/

An argument for humility in the face of pandemic forecasting unknown unknowns.
“Are we battling an unprecedented pandemic or panicking at a computer generated mirage?” I asked at the beginning of the COVID-19 pandemic on March 18, 2020. Back then the Imperial College London epidemiological model’s baseline scenario projected that with no changes in individual behaviors and no public health interventions, more than 80 percent of Americans would eventually be infected with novel coronavirus and about 2.2 million would die of the disease. This implies that 0.8 percent of those infected would die of the disease. This is about 8-times worse than the mortality rate from seasonal flu outbreaks.
Spooked by these dire projections, President Donald Trump issued on March 16 his Coronavirus Guidelines for America that urged Americans to “listen to and follow the directions of STATE AND LOCAL AUTHORITIES.” Among other things, Trump’s guidelines pressed people to “work or engage in schooling FROM HOME whenever possible” and “AVOID SOCIAL GATHERINGS in groups of more than 10 people.” The guidelines exhorted Americans to “AVOID DISCRETIONARY TRAVEL, shopping trips and social visits,” and that “in states with evidence of community transmission, bars, restaurants, food courts, gyms, and other indoor and outdoor venues where people congregate should be closed.”
Let’s take a moment to recognize just how blindly through the early stages of the pandemic we—definitely including our public health officials—were all flying at the time. The guidelines advised people to frequently wash their hands, disinfect surfaces, and avoid touching their faces. Basically, these were the sort of precautions typically recommended for influenza outbreaks. On July 9, 2020, an open letter from 239 researchers begged the World Health Organization and other public health authorities to recognize that COVID-19 was chiefly spread by airborne transmission rather than via droplets deposited on surfaces. The U.S. Centers for Disease Control and Prevention (CDC) didn’t update its guidance on COVID-19 airborne transmission until May 2021. And it turns out that touching surfaces is not a major mode of transmission for COVID-19.
The president’s guidelines also advised, “IF YOU FEEL SICK, stay home. Do not go to work.” This sensible advice, however, missed the fact that a huge proportion of COVID-19 viral transmission occurred from people without symptoms. That is, people who feel fine can still be infected and, unsuspectingly, pass along their virus to others. For example, one January 2021 study estimated that “59% of all transmission came from asymptomatic transmission, comprising 35% from presymptomatic individuals and 24% from individuals who never develop symptoms.”
The Imperial College London’s alarming projections did not go uncontested. A group of researchers led by Stanford University medical professor Jay Bhattacharya believed that COVID-19 infections were much more widespread than the reported cases indicated. If the Imperial College London’s hypothesis were true, Bhattacharya and his fellow researchers argued, that would mean that the mortality rate and projected deaths from the coronavirus would be much lower, making the pandemic much less menacing.
The researchers’ strategy was to blood test people in Santa Clara and Los Angeles Counties in California to see how many had already developed antibodies in response to coronavirus infections. Using those data, they then extrapolated what proportion of county residents had already been exposed to and recovered from the virus.
Bhattacharya and his colleagues preliminarily estimated that between 48,000 and 81,000 people had already been infected in Santa Clara County by early April, which would mean that COVID-19 infections were “50-85-fold more than the number of confirmed cases.” Based on these data the researchers calculated that toward the end of April “a hundred deaths out of 48,000-81,000 infections corresponds to an infection fatality rate of 0.12-0.2%.” As I optimistically reported at the time, that would imply that COVID-19’s lethality was not much different than for seasonal influenza.
Bhattacharya and his colleagues conducted a similar antibody survey in Los Angeles County. That study similarly asserted that COVID-19 infections were much more widespread than reported cases. The study estimated 2.8 to 5.6 percent of the residents of Los Angeles County had been infected by early April. That translates to approximately 221,000 to 442,000 adults in the county who have had the infection. “That estimate is 28 to 55 times higher than the 7,994 confirmed cases of COVID-19 reported to the county by the time of the study in early April,” noted the accompanying press release. “The number of COVID-related deaths in the county has now surpassed 600.” These estimates would imply a relatively low infection fatality rate of between 0.14 and 0.27 percent.
Unfortunately, from the vantage of 14 months, those hopeful results have not been borne out. Santa Clara County public health officials report that there have been 119,712 diagnosed cases of COVID-19 so far. If infections were really being underreported by 50-fold, that would suggest that roughly 6 million Santa Clara residents would by now have been infected by the coronavirus. The population of the county is just under 2 million. Alternatively, extrapolating a 50-fold undercount would imply that when 40,000 diagnosed cases were reported on July 11, 2020, all 2 million people living in Santa Clara County had been infected by that date.
Los Angeles County reports 1,247,742 diagnosed COVID-19 cases cumulatively. Again, if infections were really being underreported 28-fold, that would imply that roughly 35 million Angelenos out of a population of just over 10 million would have been infected with the virus by now. Again turning the 28-fold estimate on its head, that would imply that all 10 million Angelenos would have been infected when 360,000 cases had been diagnosed on November 21, 2020.
COVID-19 cases are, of course, being undercounted. Data scientist Youyang Gu has been consistently more accurate than many of the other researchers parsing COVID-19 pandemic trends. Gu estimates that over the course of the pandemic, U.S. COVID-19 infections have roughly been 4-fold greater than diagnosed cases. Applying that factor to the number of reported COVID-19 cases would yield an estimate of 480,000 and 5,000,000 total infections in Santa Clara and Los Angeles respectively. If those are ballpark accurate, that would mean that the COVID-19 infection fatality rate in Santa Clara is 0.46 percent and is 0.49 percent in Los Angeles. Again, applying a 4-fold multiplier to take account of undercounted infections, those are both just about where the U.S. infection fatality rate of 0.45 percent is now.
The upshot is that, so far, we have ended up about half-way between the best case and worst case scenarios sketched out at the beginning of the pandemic.

Of 26 health systems surveyed by MedCity News, nearly half used automated tools to respond to the Covid-19 pandemic, but none of them were regulated. Even as some hospitals continued using these algorithms, experts cautioned against their use in high-stakes decisions.
A year ago, Michigan Medicine faced a dire situation. In March of 2020, the health system predicted it would have three times as many patients as its 1,000-bed capacity — and that was the best-case scenario. Hospital leadership prepared for this grim prediction by opening a field hospital in a nearby indoor track facility, where patients could go if they were stable, but still needed hospital care. But they faced another predicament: How would they decide who to send there?
Two weeks before the field hospital was set to open, Michigan Medicine decided to use a risk model developed by Epic Systems to flag patients at risk of deterioration. Patients were given a score of 0 to 100, intended to help care teams determine if they might need an ICU bed in the near future. Although the model wasn’t developed specifically for Covid-19 patients, it was the best option available at the time, said Dr. Karandeep Singh, an assistant professor of learning health sciences at the University of Michigan and chair of Michigan Medicine’s clinical intelligence committee. But there was no peer-reviewed research to show how well it actually worked.
Researchers tested it on over 300 Covid-19 patients between March and May. They were looking for scores that would indicate when patients would need to go to the ICU, and if there was a point where patients almost certainly wouldn’t need intensive care.
“We did find a threshold where if you remained below that threshold, 90% of patients wouldn’t need to go to the ICU,” Singh said. “Is that enough to make a decision on? We didn’t think so.”
But if the number of patients were to far exceed the health system’s capacity, it would be helpful to have some way to assist with those decisions.
“It was something that we definitely thought about implementing if that day were to come,” he said in a February interview.
Thankfully, that day never came.
The survey
Michigan Medicine is one of 80 hospitals contacted by MedCity News between January and April in a survey of decision-support systems implemented during the pandemic. Of the 26 respondents, 12 used machine learning tools or automated decision systems as part of their pandemic response. Larger hospitals and academic medical centers used them more frequently.
Faced with scarcities in testing, masks, hospital beds and vaccines, several of the hospitals turned to models as they prepared for difficult decisions. The deterioration index created by Epic was one of the most widely implemented — more than 100 hospitals are currently using it — but in many cases, hospitals also formulated their own algorithms.
They built models to predict which patients were most likely to test positive when shortages of swabs and reagents backlogged tests early in the pandemic. Others developed risk-scoring tools to help determine who should be contacted first for monoclonal antibody treatment, or which Covid patients should be enrolled in at-home monitoring programs.
MedCity News also interviewed hospitals on their processes for evaluating software tools to ensure they are accurate and unbiased. Currently, the FDA does not require some clinical decision-support systems to be cleared as medical devices, leaving the developers of these tools and the hospitals that implement them responsible for vetting them.
Among the hospitals that published efficacy data, some of the models were only evaluated through retrospective studies. This can pose a challenge in figuring out how clinicians actually use them in practice, and how well they work in real time. And while some of the hospitals tested whether the models were accurate across different groups of patients — such as people of a certain race, gender or location — this practice wasn’t universal.
As more companies spin up these models, researchers cautioned that they need to be designed and implemented carefully, to ensure they don’t yield biased results.
An ongoing review of more than 200 Covid-19 risk-prediction models found that the majority had a high risk of bias, meaning the data they were trained on might not represent the real world.
“It’s that very careful and non-trivial process of defining exactly what we want the algorithm to be doing,” said Ziad Obermeyer, an associate professor of health policy and management at UC Berkeley who studies machine learning in healthcare. “I think an optimistic view is that the pandemic functions as a wakeup call for us to be a lot more careful in all of the ways we’ve talked about with how we build algorithms, how we evaluate them, and what we want them to do.”
Algorithms can’t be a proxy for tough decisions
Concerns about bias are not new to healthcare. In a paper published two years ago, Obermeyer found a tool used by several hospitals to prioritize high-risk patients for additional care resources was biased against Black patients. By equating patients’ health needs with the cost of care, the developers built an algorithm that yielded discriminatory results.
More recently, a rule-based system developed by Stanford Medicine to determine who would get the Covid-19 vaccine first ended up prioritizing administrators and doctors who were seeing patients remotely, leaving out most of its 1,300 residents who had been working on the front lines. After an uproar, the university attributed the errors to a “complex algorithm,” though there was no machine learning involved.
Both examples highlight the importance of thinking through what exactly a model is designed to do — and not using them as a proxy to avoid the hard questions.
“The Stanford thing was another example of, we wanted the algorithm to do A, but we told it to do B. I think many health systems are doing something similar,” Obermeyer said. “You want to give the vaccine first to people who need it the most — how do we measure that?”
The urgency that the pandemic created was a complicating factor. With little information and few proven systems to work with in the beginning, health systems began throwing ideas at the wall to see what works. One expert questioned whether people might be abdicating some responsibility to these tools.
“Hard decisions are being made at hospitals all the time, especially in this space, but I’m worried about algorithms being the idea of where the responsibility gets shifted,” said Varoon Mathur, a technology fellow at NYU’s AI Now Institute, in a Zoom interview. “Tough decisions are going to be made, I don’t think there are any doubts about that. But what are those tough decisions? We don’t actually name what constraints we’re hitting up against.”
The wild, wild west
There currently is no gold standard for how hospitals should implement machine learning tools, and little regulatory oversight for models designed to support physicians’ decisions, resulting in an environment that Mathur described as the “wild, wild west.”
How these systems were used varied significantly from hospital to hospital.
Early in the pandemic, Cleveland Clinic used a model to predict which patients were most likely to test positive for the virus as tests were limited. Researchers developed it using health record data from more than 11,000 patients in Ohio and Florida, including 818 who tested positive for Covid-19. Later, they created a similar risk calculator to determine which patients were most likely to be hospitalized for Covid-19, which was used to prioritize which patients would be contacted daily as part of an at-home monitoring program.
Initially, anyone who tested positive for Covid-19 could enroll in this program, but as cases began to tick up, “you could see how quickly the nurses and care managers who were running this program were overwhelmed,” said Dr. Lara Jehi, Chief Research Information Officer at Cleveland Clinic. “When you had thousands of patients who tested positive, how could you contact all of them?”
While the tool included dozens of factors, such as a patient’s age, sex, BMI, zip code, and whether they smoked or got their flu shot, it’s also worth noting that demographic information significantly changed the results. For example, a patient’s race “far outweighs” any medical comorbidity when used by the tool to estimate hospitalization risk, according to a paper published in Plos One. Cleveland Clinic recently made the model available to other health systems.
Others, like Stanford Health Care and 731-bed Santa Clara County Medical Center, started using Epic’s clinical deterioration index before developing their own Covid-specific risk models. At one point, Stanford developed its own risk-scoring tool, which was built using past data from other patients who had similar respiratory diseases, such as the flu, pneumonia, or acute respiratory distress syndrome. It was designed to predict which patients would need ventilation within two days, and someone’s risk of dying from the disease at the time of admission.
Stanford tested the model to see how it worked on retrospective data from 159 patients that were hospitalized with Covid-19, and cross-validated it with Salt Lake City-based Intermountain Healthcare, a process that took several months. Although this gave some additional assurance — Salt Lake City and Palo Alto have very different populations, smoking rates and demographics — it still wasn’t representative of some patient groups across the U.S.
“Ideally, what we would want to do is run the model specifically on different populations, like on African Americans or Hispanics and see how it performs to ensure it’s performing the same for different groups,” Tina Hernandez-Boussard, an associate professor of medicine, biomedical data science and surgery at Stanford, said in a February interview. “That’s something we’re actively seeking. Our numbers are still a little low to do that right now.”
Stanford planned to implement the model earlier this year, but ultimately tabled it as Covid-19 cases fell.
‘The target is moving so rapidly’
Although large medical centers were more likely to have implemented automated systems, there were a few notable holdouts. For example, UC San Francisco Health, Duke Health and Dignity Health all said they opted not to use risk-prediction models or other machine learning tools in their pandemic responses.
“It’s pretty wild out there and I’ll be honest with you — the dynamics are changing so rapidly,” said Dr. Erich Huang, chief officer for data quality at Duke Health and director of Duke Forge. “You might have a model that makes sense for the conditions of last month but do they make sense for the conditions of next month?”
That’s especially true as new variants spread across the U.S., and more adults are vaccinated, changing the nature and pace of the disease. But other, less obvious factors might also affect the data. For instance, Huang pointed to big differences in social mobility across the state of North Carolina, and whether people complied with local restrictions. Differing social and demographic factors across communities, such as where people work and whether they have health insurance, can also affect how a model performs.
“There are so many different axes of variability, I’d feel hard pressed to be comfortable using machine learning or AI at this point in time,” he said. “We need to be careful and understand the stakes of what we’re doing, especially in healthcare.”
Leadership at one of the largest public hospitals in the U.S., 600-bed LAC+USC Medical Center in Los Angeles, also steered away from using predictive models, even as it faced an alarming surge in cases over the winter months.
At most, the hospital used alerts to remind physicians to wear protective equipment when a patient has tested positive for Covid-19.
“My impression is that the industry is not anywhere near ready to deploy fully automated stuff just because of the risks involved,” said Dr. Phillip Gruber, LAC+USC’s chief medical information officer. “Our institution and a lot of institutions in our region are still focused on core competencies. We have to be good stewards of taxpayer dollars.”
When the data itself is biased
Developers have to contend with the fact that any model developed in healthcare will be biased, because the data itself is biased; how people access and interact with health systems in the U.S. is fundamentally unequal.
How that information is recorded in electronic health record systems (EHR) can also be a source of bias, NYU’s Mathur said. People don’t always self-report their race or ethnicity in a way that fits neatly within the parameters of an EHR. Not everyone trusts health systems, and many people struggle to even access care in the first place.
“Demographic variables are not going to be sharply nuanced. Even if they are… in my opinion, they’re not clean enough or good enough to be nuanced into a model,” Mathur said.
The information hospitals have had to work with during the pandemic is particularly messy. Differences in testing access and missing demographic data also affect how resources are distributed and other responses to the pandemic.
“It’s very striking because everything we know about the pandemic is viewed through the lens of number of cases or number of deaths,” UC Berkeley’s Obermeyer said. “But all of that depends on access to testing.”
At the hospital level, internal data wouldn’t be enough to truly follow whether an algorithm to predict adverse events from Covid-19 was actually working. Developers would have to look at social security data on mortality, or whether the patient went to another hospital, to track down what happened.
“What about the people a physician sends home — if they die and don’t come back?” he said.
Researchers at Mount Sinai Health System tested a machine learning tool to predict critical events in Covid-19 patients — such as dialysis, intubation or ICU admission — to ensure it worked across different patient demographics. But they still ran into their own limitations, even though the New York-based hospital system serves a diverse group of patients.
They tested how the model performed across Mount Sinai’s different hospitals. In some cases, when the model wasn’t very robust, it yielded different results, said Benjamin Glicksberg, an assistant professor of genetics and genomic sciences at Mount Sinai and a member of its Hasso Plattner Institute for Digital Health.
They also tested how it worked in different subgroups of patients to ensure it didn’t perform disproportionately better for patients from one demographic.
“If there’s a bias in the data going in, there’s almost certainly going to be a bias in the data coming out of it,” he said in a Zoom interview. “Unfortunately, I think it’s going to be a matter of having more information that can approximate these external factors that may drive these discrepancies. A lot of that is social determinants of health, which are not captured well in the EHR. That’s going to be critical for how we assess model fairness.”
Even after checking for whether a model yields fair and accurate results, the work isn’t done yet. Hospitals must continue to validate continuously to ensure they’re still working as intended — especially in a situation as fast-moving as a pandemic.
A bigger role for regulators
All of this is stirring up a broader discussion about how much of a role regulators should have in how decision-support systems are implemented.
Currently, the FDA does not require most software that provides diagnosis or treatment recommendations to clinicians to be regulated as a medical device. Even software tools that have been cleared by the agency lack critical information on how they perform across different patient demographics.
Of the hospitals surveyed by MedCity News, none of the models they developed had been cleared by the FDA, and most of the external tools they implemented also hadn’t gone through any regulatory review.
In January, the FDA shared an action plan for regulating AI as a medical device. Although most of the concrete plans were around how to regulate algorithms that adapt over time, the agency also indicated it was thinking about best practices, transparency, and methods to evaluate algorithms for bias and robustness.
More recently, the Federal Trade Commission warned that it could crack down on AI bias, citing a paper that AI could worsen existing healthcare disparities if bias is not addressed.
“My experience suggests that most models are put into practice with very little evidence of their effects on outcomes because they are presumed to work, or at least to be more efficient than other decision-making processes,” Kellie Owens, a researcher for Data & Society, a nonprofit that studies the social implications of technology, wrote in an email. “I think we still need to develop better ways to conduct algorithmic risk assessments in medicine. I’d like to see the FDA take a much larger role in regulating AI and machine learning models before their implementation.”
Developers should also ask themselves if the communities they’re serving have a say in how the system is built, or whether it is needed in the first place. The majority of hospitals surveyed did not share with patients if a model was used in their care or involve patients in the development process.
In some cases, the best option might be the simplest one: don’t build.
In the meantime, hospitals are left to sift through existing published data, preprints and vendor promises to decide on the best option. To date, Michigan Medicine’s paper is still the only one that has been published on Epic’s Deterioration Index.
Care teams there used Epic’s score as a support tool for its rapid response teams to check in on patients. But the health system was also looking at other options.
“The short game was that we had to go with the score we had,” Singh said. “The longer game was, Epic’s deterioration index is proprietary. That raises questions about what is in it.”
https://prospect.org/health/big-tech-of-health-care-united-optum-change-merger/

Optum, a subsidiary of UnitedHealth, provides data analytics and infrastructure, a pharmacy benefit manager called OptumRx, a bank providing patient loans called Optum Bank, and more.
It’s not often that the American Hospital Association—known for fun lobbying tricks like hiring consultants to create studies showing the benefits of hospital mergers—directly goes after another consolidation in the industry.
But when the AHA caught wind of UnitedHealth Group subsidiary Optum’s plans, announced in January 2021, to acquire data analytics firm Change Healthcare, they offered up some fiery language in a letter to the Justice Department. “The acquisition … will concentrate an immense volume of competitively sensitive data in the hands of the most powerful health insurance company in the United States, with substantial clinical provider and health insurance assets, and ultimately removes a neutral intermediary.”
If permitted to go through, Optum’s acquisition of Change would fundamentally alter both the health data landscape and the balance of power in American health care. UnitedHealth, the largest health care corporation in the U.S., would have access to all of its competitors’ business secrets. It would be able to self-preference its own doctors. It would be able to discriminate, racially and geographically, against different groups seeking insurance. None of this will improve public health; all of it will improve the profits of Optum and its corporate parent.
Despite the high stakes, Optum has been successful in keeping this acquisition out of the public eye. Part of this PR success is because few health care players want to openly oppose an entity as large and powerful as UnitedHealth. But perhaps an even larger part is that few fully understand what this acquisition will mean for doctors, patients, and the health care system at large.
If regulators allow the acquisition to take place, Optum will suddenly have access to some of the most secret data in health care.
UnitedHealth is the largest health care entity in the U.S., using several metrics. United Healthcare (the insurance arm) is the largest health insurer in the United States, with over 70 million members, 6,500 hospitals, and 1.4 million physicians and other providers. Optum, a separate subsidiary, provides data analytics and infrastructure, a pharmacy benefit manager called OptumRx, a bank providing patient loans called Optum Bank, and more. Through Optum, UnitedHealth also controls more than 50,000 affiliated physicians, the largest collection of physicians in the country.
While UnitedHealth as a whole has earned a reputation for throwing its weight around the industry, Optum has emerged in recent years as UnitedHealth’s aggressive acquisition arm. Acquisitions of entities as varied as DaVita’s dialysis physicians, MedExpress urgent care, and Advisory Board Company’s consultants have already changed the health care landscape. As Optum gobbles up competitors, customers, and suppliers, it has turned into UnitedHealth’s cash cow, bringing in more than 50 percent of the entity’s annual revenue.
On a recent podcast, Chas Roades and Dr. Lisa Bielamowicz of Gist Healthcare described Optum in a way that sounds eerily similar to a single-payer health care system. “If you think about what Optum is assembling, they are pulling together now the nation’s largest employers of docs, owners of one of the country’s largest ambulatory surgery center chains, the nation’s largest operator of urgent care clinics,” said Bielamowicz. With 98 million customers in 2020, OptumHealth, just one branch of Optum’s services, had eyes on roughly 30 percent of the U.S. population. Optum is, Roades noted, “increasingly the thing that ate American health care.”
Optum has not been shy about its desire to eventually assemble all aspects of a single-payer system under its own roof. “The reason it’s been so hard to make health care and the health-care system work better in the United States is because it’s rare to have patients, providers—especially doctors—payers, and data, all brought together under an organization,” OptumHealth CEO Wyatt Decker told Bloomberg. “That’s the rare combination that we offer. That’s truly a differentiator in the marketplace.” The CEO of UnitedHealth, Andrew Witty, has also expressed the corporation’s goal of “wir[ing] together” all of UnitedHealth’s assets.
Controlling Change Healthcare would get UnitedHealth one step closer to creating their private single-payer system. That’s why UnitedHealth is offering up $13 billion, a 41 percent premium on the public valuation of Change. But here’s why that premium may be worth every penny.
Change Healthcare is Optum’s leading competitor in pre-payment claims integrity; functionally, a middleman service that allows insurers to process provider claims (the receipts from each patient visit) and address any mistakes. To clarify what that looks like in practice, imagine a patient goes to an in-network doctor for an appointment. The doctor performs necessary procedures and uses standardized codes to denote each when filing a claim for reimbursement from the patient’s insurance coverage. The insurer then hires a reviewing service—this is where Change comes in—to check these codes for accuracy. If errors are found in the coded claims, such as accidental duplications or more deliberate up-coding (when a doctor intentionally makes a patient seem sicker than they are), Change will flag them, saving the insurer money.
The most obvious potential outcome of the merger is that the flow of data will allow Optum/UnitedHealth to preference their own entities and physicians above others.
To accurately review the coded claims, Change’s technicians have access to all of their clients’ coverage information, provider claims data, and the negotiated rates that each insurer pays.
Change also provides other services, including handling the actual payments from insurers to physicians, reimbursing for services rendered. In this role, Change has access to all of the data that flows between physicians and insurers and between pharmacies and insurers—both of which give insurers leverage when negotiating contracts. Insurers often send additional suggestions to Change as well; essentially their commercial secrets on how the insurer is uniquely saving money. Acquiring Change could allow Optum to see all of this.
Change’s scale (and its independence from payers) has been a selling point; just in the last few months of 2020, the corporation signed multiple contracts with the largest payers in the country.
Optum is not an independent entity; as mentioned above, it’s owned by the largest insurer in the U.S. So, when insurers are choosing between the only two claims editors that can perform at scale and in real time, there is a clear incentive to use Change, the independent reviewer, over Optum, a direct competitor.
If regulators allow the acquisition to take place, Optum will suddenly have access to some of the most secret data in health care. In other words, if the acquisition proceeds and Change is owned by UnitedHealth, the largest health care corporation in the U.S. will own the ability to peek into the book of business for every insurer in the country.
Although UnitedHealth and Optum claim to be separate entities with firewalls that safeguard against anti-competitive information sharing, the porosity of the firewall is an open question. As the AHA pointed out in their letter to the DOJ, “[UnitedHealth] has never demonstrated that the firewalls are sufficiently robust to prevent sensitive and strategic information sharing.”
In some cases, this “firewall” would mean asking Optum employees to forget their work for UnitedHealth’s competitors when they turn to work on implementing changes for UnitedHealth. It is unlikely to work. And that is almost certainly Optum’s intention.
The most obvious potential outcome of the merger is that the flow of data will allow Optum/UnitedHealth to preference their own entities and physicians above others. This means that doctors (and someday, perhaps, hospitals) owned by the corporation will get better rates, funded by increased premiums on patients. Optum drugs might seem cheaper, Optum care better covered. Meanwhile, health care costs will continue to rise as UnitedHealth fuels executive salaries and stock buybacks.
UnitedHealth has already been accused of self-preferencing. A large group of anesthesiologists filed suit in two states last week, accusing the company of using perks to steer surgeons into using service providers within its networks.
Even if UnitedHealth doesn’t purposely use data to discriminate, the corporation has been unable to correct for racially biased data in the past.
Beyond this obvious risk, the data alterations caused by the Change acquisition could worsen existing discrimination and medical racism. Prior to the acquisition, Change launched a geo-demographic analytics unit. Now, UnitedHealth will have access to that data, even as it sells insurance to different demographic categories and geographic areas.
Even if UnitedHealth doesn’t purposely use data to discriminate, the corporation has been unable to correct for racially biased data in the past, and there’s no reason to expect it to do so in the future. A study published in 2019 found that Optum used a racially biased algorithm that could have led to undertreating Black patients. This is a problem for all algorithms. As data scientist Cathy O’Neil told 52 Insights, “if you have a historically biased data set and you trained a new algorithm to use that data set, it would just pick up the patterns.” But Optum’s size and centrality in American health care would give any racially biased algorithms an outsized impact. And antitrust lawyer Maurice Stucke noted in an interview that using racially biased data could be financially lucrative. “With this data, you can get people to buy things they wouldn’t otherwise purchase at the highest price they are willing to pay … when there are often fewer options in their community, the poor are often charged a higher price.”
The fragmentation of American health care has kept Big Data from being fully harnessed as it is in other industries, like online commerce. But Optum’s acquisition of Change heralds the end of that status quo and the emergence of a new “Big Tech” of health care. With the Change data, Optum/UnitedHealth will own the data, providers, and the network through which people receive care. It’s not a stretch to see an analogy to Amazon, and how that corporation uses data from its platform to undercut third parties while keeping all its consumers in a panopticon of data.
The next step is up to the Department of Justice, which has jurisdiction over the acquisition (through an informal agreement, the DOJ monitors health insurance and other industries, while the FTC handles hospital mergers, pharmaceuticals, and more). The longer the review takes, the more likely it is that the public starts to realize that, as Dartmouth health policy professor Dr. Elliott Fisher said, “the harms are likely to outweigh the benefits.”
There are signs that the DOJ knows that to approve this acquisition is to approve a new era of vertical integration. In a document filed on March 24, Change informed the SEC that the DOJ had requested more information and extended its initial 30-day review period. But the stakes are high. If the acquisition is approved, we face a future in which UnitedHealth/Optum is undoubtedly “the thing that ate American health care.”
Since the beginning of the coronavirus pandemic, Florida has blocked, obscured, delayed, and at times hidden the COVID-19 data used in making big decisions such as reopening schools and businesses.
And with scientists warning Thanksgiving gatherings could cause an explosion of infections, the shortcomings in the state’s viral reporting have yet to be fixed.
While the state has put out an enormous amount of information, some of its actions have raised concerns among researchers that state officials are being less than transparent.
It started even before the pandemic became a daily concern for millions of residents. Nearly 175 patients tested positive for the disease in January and February, evidence the Florida Department of Health collected but never acknowledged or explained. The state fired its nationally praised chief data manager, she says in a whistleblower lawsuit, after she refused to manipulate data to support premature reopening. The state said she was fired for not following orders.
The health department used to publish coronavirus statistics twice a day before changing to once a day, consistently meeting an 11 a.m. daily deadline for releasing new information that scientists, the media and the public could use to follow the pandemic’s latest twists.
But in the past month the department has routinely and inexplicably failed to meet its own deadline by as much as six hours. On one day in October, it published no update at all.
News outlets were forced to sue the state before it would publish information identifying the number of infections and deaths at individual nursing homes.
Throughout it all, the state has kept up with the rapidly spreading virus by publishing daily updates of the numbers of cases, deaths and hospitalizations.
“Florida makes a lot of data available that is a lot of use in tracking the pandemic,” University of South Florida epidemiologist Jason Salemi said. “They’re one of the only states, if not the only state, that releases daily case line data (showing age, sex and county for each infected person).”
Dr. Terry Adirim, chairwoman of Florida Atlantic University’s Department of Integrated Biomedical Science, agreed, to a point.
“The good side is they do have daily spreadsheets,” Adirim said. “However, it’s the data that they want to put out.”
The state leaves out crucial information that could help the public better understand who the virus is hurting and where it is spreading, Adirim said.
The department, under state Surgeon General Dr. Scott Rivkees, oversees 53? health agencies covering Florida’s 67 counties, such as the one in Palm Beach County headed by Dr. Alina Alonso.
Rivkees was appointed in April 2019. He reports to Gov. Ron DeSantis, a Republican who has supported President Donald Trump’s approach to fighting the coronavirus and pressured local officials to reopen schools and businesses despite a series of spikes indicating rapid spread of the disease.
At several points, the DeSantis administration muzzled local health directors, such as when it told them not to advise school boards on reopening campuses.
The health department’s own coronavirus reports indicated that the pathogen had been infecting Floridians since January, yet health officials never informed the public about it and they did not publicly acknowledge it even after The Palm Beach Post first reported it in May.
In fact, the night before The Post broke the story, the department inexplicably removed from public view the state’s dataset that provided the evidence. Mixed among listings of thousands of cases was evidence that up to 171 people ages 4 to 91 had tested positive for COVID-19 in the months before officials announced in March the disease’s presence in the state.
Were the media reports on the meaning of those 171 cases in error? The state has never said.
When positive tests were finally acknowledged in March, all tests had to be confirmed by federal health officials. But Florida health officials refused to even acknowledge how many people in each county had been tested.
State health officials and DeSantis claimed they had to withhold the information to protect patient privacy, but they provided no evidence that stating the number of people tested would reveal personal information.
At the same time, the director of the Hillsborough County branch of the state health department publicly revealed that information to Hillsborough County commissioners.
And during March the state published on a website that wasn’t promoted to the public the ages and genders of those who had been confirmed to be carrying the disease, along with the counties where they claimed residence.
In May, with the media asking about data that revealed the earlier onset of the disease, internal emails show that a department manager ordered the state’s coronavirus data chief to yank the information off the web, even though it had been online for months.
A health department tech supervisor told data manager Rebekah Jones on May 5 to take down the dataset. Jones replied in an email that was the “wrong call,” but complied, only to be ordered an hour later to put it back.
That day, she emailed reporters and researchers following a listserv she created, saying she had been removed from handling coronavirus data because she refused to manipulate datasets to justify DeSantis’ push to begin reopening businesses and public places.
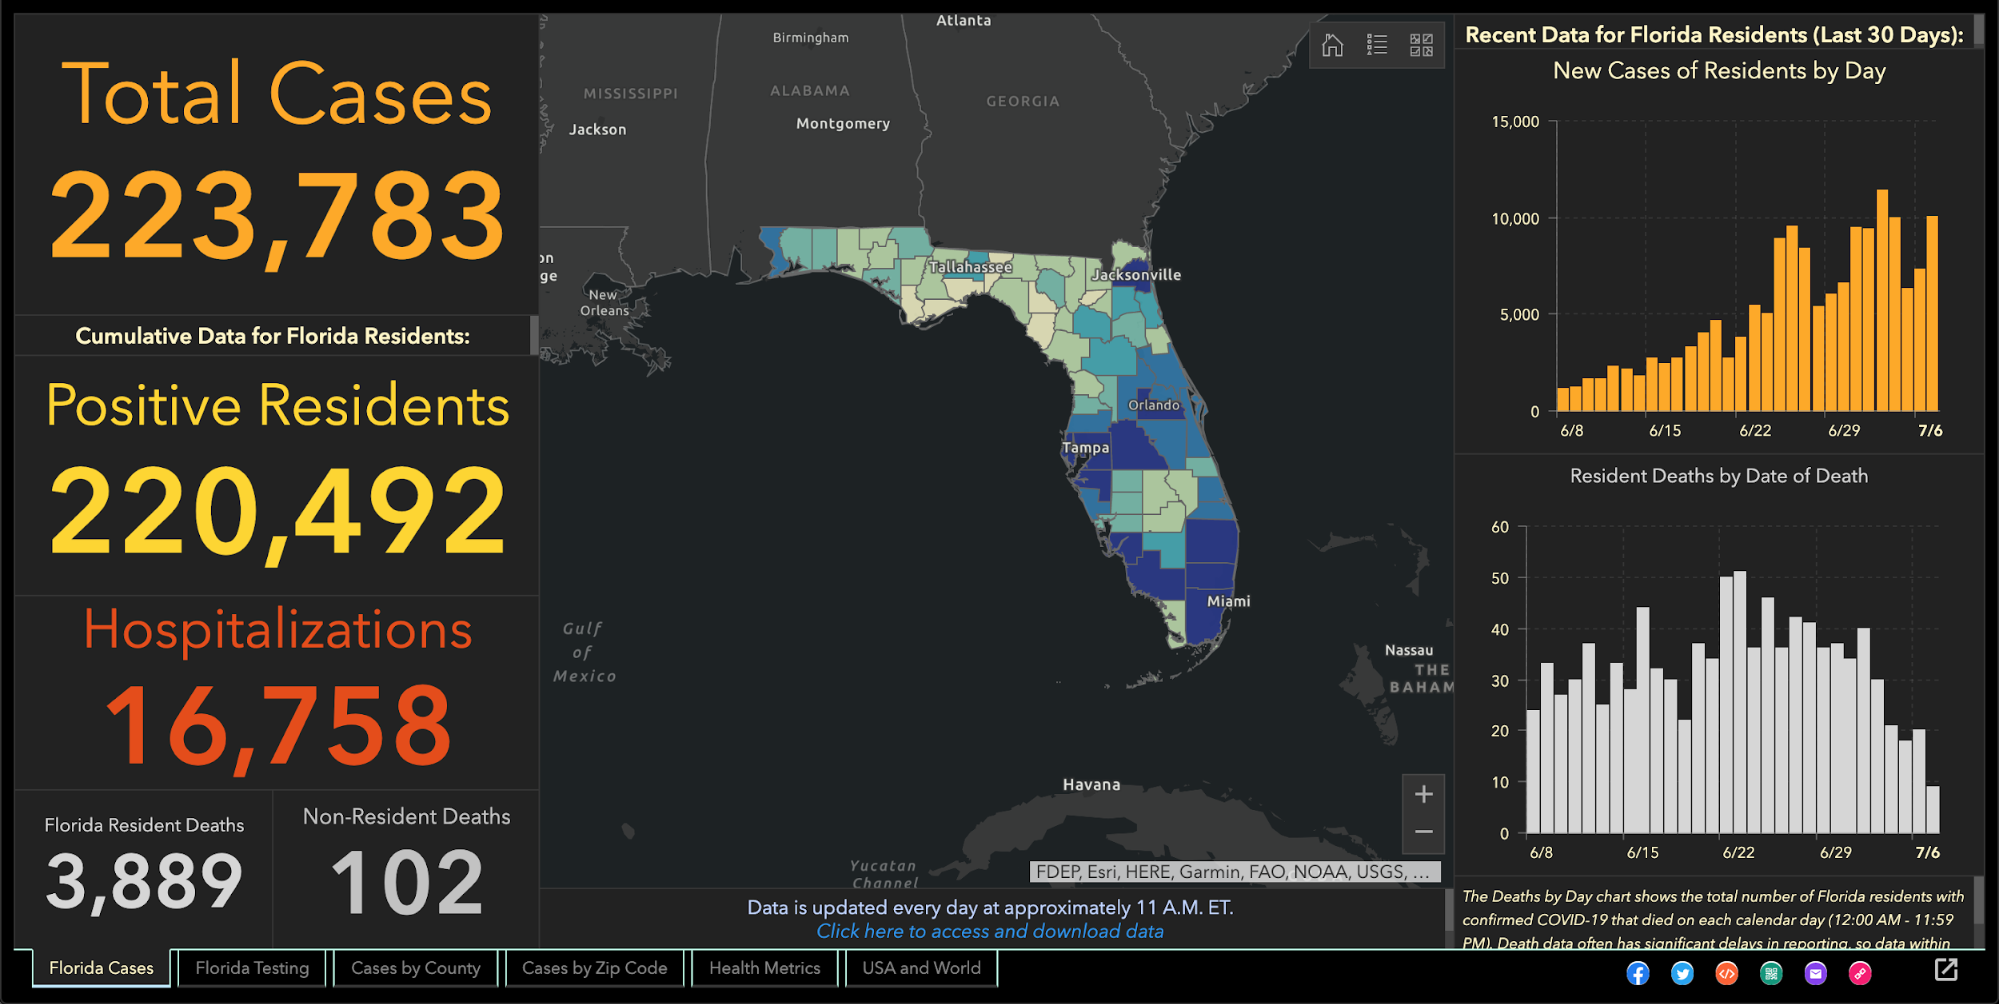
Two weeks later, the health department fired Jones, who in March had created and maintained Florida’s one-stop coronavirus dashboard, which had been viewed by millions of people, and had been praised nationally, including by White House Coronavirus Task Force Coordinator Deborah Birx.
The dashboard allows viewers to explore the total number of coronavirus cases, deaths, tests and other information statewide and by county and across age groups and genders.
DeSantis claimed on May 21 that Jones wanted to upload bad coronavirus data to the state’s website. To further attempt to discredit her, he brought up stalking charges made against her by an ex-lover, stemming from a blog post she wrote, that led to two misdemeanor charges.
Using her technical know-how, Jones launched a competing COVID-19 dashboard website, FloridaCOVIDAction.com in early June. After national media covered Jones’ firing and website launch, people donated more than $200,000 to her through GoFundMe to help pay her bills and maintain the website.
People view her site more than 1 million times a day, she said. The website features the same type of data the state’s dashboard displays, but also includes information not present on the state’s site such as a listing of testing sites and their contact information.
Jones also helped launch TheCOVIDMonitor.com to collect reports of infections in schools across the country.
Jones filed a whistleblower complaint against the state in July, accusing managers of retaliating against her for refusing to change the data to make the coronavirus situation look better.
“The Florida Department of Health needs a data auditor not affiliated with the governor’s office because they cannot be trusted,” Jones said Friday.
When coronavirus kills someone, their county’s medical examiner’s office logs their name, age, ethnicity and other information, and sends it to the Florida Department of Law Enforcement.
During March and April, the department refused requests to release that information to the public, even though medical examiners in Florida always have made it public under state law. Many county medical examiners, acknowledging the role that public information can play in combating a pandemic, released the information without dispute.
But it took legal pressure from news outlets, including The Post, before FDLE agreed to release the records it collected from local medical examiners.
When FDLE finally published the document on May 6, it blacked out or excluded crucial information such as each victim’s name or cause of death.
But FDLE’s attempt to obscure some of that information failed when, upon closer examination, the seemingly redacted details could in fact be read by common computer software.
Outlets such as Gannett, which owns The Post, and The New York Times, extracted the data invisible to the naked eye and reported in detail what the state redacted, such as the details on how each patient died.
It took a lawsuit against the state filed by the Miami Herald, joined by The Post and other news outlets, before the health department began publishing the names of long-term care facilities with the numbers of coronavirus cases and deaths.
The publication provided the only official source for family members to find out how many people had died of COVID-19 at the long-term care facility housing their loved ones.
While the state agreed to publish the information weekly, it has failed to publish several times and as of Nov. 24 had not updated the information since Nov. 6.
It took more pressure from Florida news outlets to pry from the state government the number of beds in each hospital being occupied by coronavirus patients, a key indicator of the disease’s spread, DeSantis said.
That was one issue where USF’s Salemi publicly criticized Florida.
“They were one of the last three states to release that information,” he said. “That to me is a problem because it is a key indicator.”
One metric DeSantis touted to justify his decision in May to begin reopening Florida’s economy was the so-called positivity rate, which is the share of tests reported each day with positive results.
But Florida’s daily figures contrasted sharply with calculations made by Johns Hopkins University, prompting a South Florida Sun-Sentinel examination that showed Florida’s methodology underestimated the positivity rate.
The state counts people who have tested positive only once, but counts every negative test a person receives until they test positive, so that there are many more negative tests for every positive one.
John Hopkins University, on the other hand, calculated Florida’s positivity rate by comparing the number of people testing positive with the total number of people who got tested for the first time.
By John Hopkins’ measure, between 10 and 11 percent of Florida’s tests in October came up positive, compared to the state’s reported rate of between 4 and 5 percent.
Health experts such as those at the World Health Organization have said a state’s positivity rate should stay below 5 percent for 14 days straight before it considers the virus under control and go forward with reopening public places and businesses. It’s also an important measure for travelers, who may be required to quarantine if they enter a state with a high positivity rate.
The Post reported in June that the share of tests taken by Black and Hispanic people and in majority minority ZIP codes were twice as likely to come back positive compared to tests conducted on white people and in majority white ZIP codes.
That was based on a Post analysis of internal state data the health department will not share with the public.
The state publishes bar charts showing general racial breakdowns but not for each infected person.
If it wanted to, Florida’s health department could publish detailed data that would shed light on the infection rates among each race and ethnicity or each age group, as well as which neighborhoods are seeing high rates of contagion.
Researchers have been trying to obtain this data but “the state won’t release the data without (making us) undergo an arduous data use agreement application process with no guarantee of release of the data,” Adirim said. Researchers must read and sign a 26-page, nearly 5,700-word agreement before getting a chance at seeing the raw data.
While Florida publishes the ages, genders and counties of residence for each infected person, “there’s no identification for race or ethnicity, no ZIP code or city of the residence of the patient,” Adirim said. “No line item count of negative test data so it’s hard to do your own calculation of test positivity.”
While Florida doesn’t explain its reasoning, one fear of releasing such information is the risk of identifying patients, particularly in tiny, non-diverse counties.
Florida’s daily report shows how many positive results come from each laboratory statewide. Except when it doesn’t.
The report has shown for months that 100 percent of COVID-19 tests conducted by some labs have come back positive despite those labs saying that shouldn’t be the case.
While the department reported in July that all 410 results from a Lee County lab were positive, a lab spokesman told The Post the lab had conducted roughly 30,000 tests. Other labs expressed the same confusion when informed of the state’s reporting.
The state health department said it would work with labs to fix the error. But even as recently as Tuesday, the state’s daily report showed positive result rates of 100 percent or just under it from some labs, comprising hundreds of tests.
As DeSantis pushed in August for reopening schools and universities for students to attend in-person classes, Florida’s health department published a report showing hundreds of infections could be traced back to schools, before pulling that report from public view.
The health department claimed it published that data by mistake, the Miami Herald reported.
The report showed that COVID-19 had infected nearly 900 students and staffers.
The state resumed school infection reporting in September.
A similar publication of cases at day-care centers appeared online briefly in August only to come down permanently.
After shifting in late April to updating the public just once a day at 11 a.m. instead of twice daily, the state met that deadline on most days until it started to falter in October. Pandemic followers could rely on the predictability.
On Oct. 10, the state published no data at all, not informing the public of a problem until 5 p.m.
The state blamed a private lab for the failure but the next day retracted its statement after the private lab disputed the state’s explanation. No further explanation has been offered.
On Oct. 21, the report came out six hours late.
Since Nov. 3, the 11 a.m. deadline has never been met. Now, late afternoon releases have become the norm.
“They have gotten more sloppy and they have really dragged their feet,” Adirim, the FAU scientist, said.
No spokesperson for the health department has answered questions from The Post to explain the lengthy delays. Alberto Moscoso, the spokesman throughout the pandemic, departed without explanation Nov. 6.
The state’s tardiness can trip up researchers trying to track the pandemic in Florida, Adirim said, because if one misses a late-day update, the department could overwrite it with another update the next morning, eliminating critical information and damaging scientists’ analysis.
As if to show disregard for concerns raised by scientists, the DeSantis administration brought in a new data analyst who bragged online that he is no expert and doesn’t need to be.
Kyle Lamb, an Uber driver and sports blogger, sees his lack of experience as a plus.
“Fact is, I’m not an ‘expert’,” Lamb wrote on a website for a subscribers-only podcast he hosts about the coronavirus. “I also don’t need to be. Experts don’t have all the answers, and we’ve learned that the hard way throughout the entire duration of the global pandemic.”
Much of his coronavirus writings can be found on Twitter, where he has said masks and mandatory quarantines don’t stop the virus’ spread, and that hydroxychloroquine, a drug touted by President Donald Trump but rejected by medical researchers, treats it successfully.
While DeSantis says lockdowns aren’t effective in stopping the spread and refuses to enact a statewide mask mandate, scientists point out that quarantines and masks are extremely effective.
The U.S. Food and Drug Administration has said hydroxychloroquine is unlikely to help and poses greater risk to patients than any potential benefits.
Coronavirus researchers have called Lamb’s views “laughable,” and fellow sports bloggers have said he tends to act like he knows much about a subject in which he knows little, the Miami Herald reported.
DeSantis has yet to explain how and why Lamb was hired, nor has his office released Lamb’s application for the $40,000-a-year job. “We generally do not comment on such entry level hirings,” DeSantis spokesman Fred Piccolo said Tuesday by email.
It could be worse.
Texas health department workers have to manually enter data they read from paper faxes into the state’s coronavirus tracking system, The Texas Tribune has reported. And unlike Florida, Texas doesn’t require local health officials to report viral data to the state in a uniform way that would make it easier and faster to process and report.
It could be better.
In Wisconsin, health officials report the number of cases and deaths down to the neighborhood level. They also plainly report racial and ethnic disparities, which show the disease hits Hispanic residents hardest.
Still, Salemi worries that Florida’s lack of answers can undermine residents’ faith.
“My whole thing is the communication, the transparency,” Salemi said. “Just let us know what’s going on. That can stop people from assuming the worst. Even if you make a big error people are a lot more forgiving, whereas if the only time you’re communicating is when bad things happen … people start to wonder.”

A group of health system leaders in Missouri challenged state-reported hospital bed data, saying it could lead to a misunderstanding about hospital capacity, according to a Nov. 19 report in the St. Louis Business Journal.
A consortium of health systems, including St. Louis-based BJC HealthCare, Mercy, SSM Health and St. Luke’s Hospital, released urgent reports warning that hospital and ICU beds are nearing capacity while state data reports show a much different story.
The state reports, based on data from TeleTracking and the CDC-managed National Healthcare Safety Network, show inpatient hospital bed capacity at 35 percent and remaining ICU bed capacity at 29 percent on Nov. 19. However, the consortium reported hospitals are fuller, at 84 percent capacity as of Nov. 18, and ICUs at 90 percent capacity based on staffed bed availability. The consortium says it is using staffed bed data while the state’s numbers are based on licensed bed counts; the state contends it does take staffing into account, according to the report.
Stephanie Zoller Mueller, a spokesperson for the consortium, said the discrepancy between the state’s data and consortium’s data could create a “gross misunderstanding on the part of some and can be a dangerous message to the community.”
https://covidtracking.com/data/charts/us-all-key-metrics
https://covidtracking.com/data/charts/us-currently-hospitalized
https://covidtracking.com/data/charts/us-daily-deaths
https://covidtracking.com/data/charts/us-daily-positive
https://covidtracking.com/data/charts/cases-per-million-by-state
https://covidtracking.com/data/charts/hospitalized-per-million-by-state

