CMS accelerated payments to hospitals and other healthcare providers at the beginning of the COVID-19 pandemic to help temporarily relieve financial strain. It’s time to begin repaying the Medicare loans but that isn’t possible for some rural hospitals, according to NPR.
CMS expanded the Accelerated and Advance Payment Program in late March to help offset financial damage caused by the COVID-19 pandemic. CMS announced April 26 that it was reevaluating pending and new applications for advance payments due to the availability of funds under the Coronavirus Aid, Relief and Economic Security Act. As of May, CMS had paid out $100 billion in advance payments, the bulk of which went to hospitals.
Hospitals and other healthcare providers are required to start repaying the Medicare loans this month. Most hospitals will have one year from the date the first loan payment was made to repay the loans, according to Kaiser Family Foundation.
Ozarks Community Hospital, 25-bed critical access hospital in Gravette, Ark., is one of the hospitals that applied for and accepted the Medicare loans. The hospital also received grants made available under the CARES Act, which do not have to be repaid.
CEO Paul Taylor said Ozarks Community Hospital’s revenue is still constrained, and he doesn’t know how it will pay back its $8 million Medicare loan. Payments for new Medicare claims will be offset to repay the loans, but losing those payments could force the hospital to close, Mr. Taylor told NPR.
“If I get no relief and they take the money … we won’t still be open,” he said.
Ozarks Community Hospital is one of more than 850 critical access hospitals in rural areas that received Medicare loans, according to NPR. Given the shaky financial footing of many rural hospitals before the pandemic, the strain of having Medicare payments withheld could be enough to force others to shut down.
Before the pandemic, more than 600 rural hospitals across the U.S. were vulnerable to closure, according to an estimate from iVantage Health Analytics, a firm that compiles a hospital strength index based on data about financial stability, patients and quality indicators.
If the financial pressures tied to the pandemic force any of those hospitals to shut down, they’ll join the list of 131 rural hospitals that have closed over the past decade, according to the Cecil G. Sheps Center for Health Services Research.
CMS has pushed back publishing a final rule that would ease anti-kickback regulations on providers by a year. The move is likely to anger healthcare organizations that have long clamored for the rule’s relaxation.
The deadline to finalize the rule proposed Oct. 17, 2019, is now Aug. 31, 2021. Originally, the rule relaxing stipulations of the decades-old Stark Lawwas expected this month. It’s unclear how the extension affects OIG’s tandem rule slacking similar regulations outlined in the Federal Anti-Kickback Statute and the Civil Monetary Penalties Law.
CMS chalked up the delay to the need to detangle the many thorny issues raised by healthcare companies in their comments on the rule. “We are still working through the complexity of the issues raised by comments received on the proposed rule and therefore we are not able to meet the announced publication target date,” Wilma Robinson, HHS deputy executive secretary, wrote in a notice on the change dated Monday. CMS did not respond to requests to clarify what issues are tying up the rule.
Dive Insight:
Hospital groups are unlikely to be pleased with the delay. The American Hospital Association earlier this month sent the Office of Management and Budget a letter urging them to expedite the review and release of the final Stark and AKS regulations.
“These rules take on even more significance in light of the COVID-19 pandemic,” AHA EVP Thomas Nickels wrote in the letter dated Aug. 19. “These rules will remove unnecessary regulatory burden from hospitals and health systems, allow for enhanced care coordination for patients, improve quality, and reduce waste in the Medicare and Medicaid programs.”
AHA did not respond to a request for comment by time of publication.
Healthcare organizations have said the Stark Law and Anti-Kickback Statute, passed decades ago in an attempt to deter physicians from referring patients to other locations or for services that would financially benefit them, are outdated and burdensome. Providers say the proposed changes are long overdue, citing longstanding concerns the laws hinder efforts to coordinate patient care across different sites and episodes.
The proposed rule, if finalized, would sharply ease federal anti-kickback regulations in a bid to help providers use value-based payment arrangements, reflecting the growing shift away from fee-for-service reimbursement and siloed care models.
The rule clarified exemptions from the physician self-referral law for certain value-based payment arrangements among physicians, providers and suppliers. Specifically, it applies to models with a specific patient population, where one of the entities takes on full financial risk for providing Medicare Part A and Part B for the first six months. The payments can either be capitated or global.
Doctors would be required to pay back a fourth of payments if they don’t meet financial goals.
The proposed rule also introduced a new exemption for certain arrangements under which a doctor receives limited payment for items and services that he or she provides, and another that would allow hospitals and medical device manufacturers to donate cybersecurity tools and other related software to doctors without fear of retribution.
Comments on the proposed rule from the hospital and physician community were generally supportive of the changes, though some organizations, including the American Hospital Association and Walmart, thought the feds didn’t go far enough. Hospital groups argued the exceptions should be expanded to include private payers, along with Medicare and Medicaid and the definition of value-based arrangements should be broadened, along with some other clarifications.
Per the Social Security Act, agencies have to maintain a regular timeline for publishing final regulations, normally within three years of the draft. However, they are allowed to extend the original deadline, if they justify the change.
Several factors will shape the financial performance of physician- and hospital-led organizations under total cost of care payment models.
Introduction
Broad consensus has long existed among public- and private-sector leaders in US healthcare that improvements in healthcare affordability will require, among other changes, a shift away from fee-for-service (FFS) payments to alternative payment models that reward quality and efficiency. The alternative payment model that has gained broadest adoption over the past ten years is the accountable care organization (ACO), in which physicians and/or hospitals assume responsibility for the total cost of care for a population of patients.
Launched by the Centers for Medicare & Medicaid Services (CMS) Innovation Center in 2012, Pioneer ACO was the first such model design to generate savings for Medicare. In this incarnation, Medicare set a benchmark for total cost of care per attributed ACO beneficiary: If total cost of care was kept below the benchmark, ACOs were eligible to share in the implied savings, as long as they also met established targets for quality of care. If total cost of care exceeded the benchmark, ACOs were required to repay the government for a portion of total cost of care above the benchmark.
Payment models similar to the one adopted by Pioneer ACOs also have been extended to other Medicare ACO programs, with important technical differences in estimates for savings and rules for the distribution of savings or losses as well as some models offering gain sharing without potential for penalties for costs exceeding the benchmark. State Medicaid programs as well as private payers (across Commercial, Medicare Advantage, and Medicaid Managed Care) also have adopted ACO-like models with similar goals and payment model structures. Of the roughly 33 million lives covered by an ACO in 2018, more than 50 percent were commercially insured and approximately 10 percent were Medicaid lives.2
On the whole, ACOs in the Medicare Shared Savings Program (MSSP) have delivered high-quality care, with an average composite score of 93.4 percent for quality metrics. However, cost savings achieved by the program have been limited: ACOs that entered MSSP during the period from January 1, 2012 to December 31, 2014, were estimated to have reduced cumulative Medicare FFS spending by $704M by 2015; after bonuses were accounted for, net savings to the Medicare program were estimated to be $144M.3 Put another way, in aggregate, savings from Medicare ACOs in 2015 represented only 0.02 percent of total Medicare spending. The savings achieved were largely concentrated among physician-led ACOs (rather than hospital-led ACOs). In fact, after accounting for bonuses, hospital-led ACOs actually had higher total Medicare spending by $112M on average over three years.4
While savings from MSSP have been relatively limited, in aggregate, numerous examples exist of ACOs that have achieved meaningful savings—in some cases in excess of 5 percent of total cost of care—with significant rewards to both themselves as well as sponsoring payers (for example, Millennium, Palm Beach, BCBSMA AQC).567 The wide disparity of performance among ACOs (and across Medicare, Medicaid, and Commercial ACO programs) raises the question of whether certain provider organizations are better suited than others to succeed under total cost of care arrangements, and whether success is dictated more by ACO model design or by structural characteristics of participating providers.
In the pages that follow, we examine these questions in two ways. First, we analyze “the math of ACOs” by isolating four factors that contribute to overall ACO profitability: bonus payments, “demand destruction,” market share gains, and operating expenses. Following these factors, we illustrate the math of ACOs through modeling of the performance of five different archetypes: physician-led ACOs; hospital-led ACOs with low ACO penetration and low leakage reduction; hospital-led ACOs with high ACO penetration; hospital-led ACOs with high leakage reduction; and hospital-led ACOs with high penetration and leakage reduction.
The Math of ACOs
In the pages that follow, we break down “the math of ACOs” into several key parameters, each of which hospital and physician group leaders could consider evaluating when deciding whether to participate in an ACO arrangement with one or more payers. Specifically, we measure the total economic value to ACO-participating providers as the sum of four factors: bonus payments, less “demand destruction,” plus market share gains, less operating costs for the ACO (Exhibit 1).
In the discussion that follows, we examine each of these factors and understand their importance to the overall profitability of ACOs, using both academic research as well as McKinsey’s experience advising and supporting payers and providers participating in ACO models.
1. Bonus payments
The premise of ACOs rests on the opportunity for payers and participating providers to share in cost savings arising from curbing unnecessary utilization and more efficient population health management, thus aligning incentives to control total cost of care. Because ACOs are designed to reduce utilization, the bonus—or share of estimated savings received by an ACO—is one factor that significantly influences ACO profitability and has garnered the greatest attention both in academic research and in private sector negotiations and deliberations over ACO participation. Bonus payments made to ACOs are themselves based on several key design elements:
The baseline and benchmark for total costs, against which savings are estimated8 ;
The shared savings rate and minimum savings/loss rates;
Risk corridors, based on caps on gains/losses and/or “haircuts” to benchmarks; and,
Frequency of rebasing, with implications for benchmark and shared savings.
1a. Baseline and benchmark
Most ACO models are grounded in a historical baseline for total cost of care, typically on the population attributed to providers participating in the ACO. Most ACO models apply an annual trend rate to the historical baseline, in order to develop a benchmark for total cost of care for the performance period. This benchmark is then used as the point of reference to which actual costs are compared for purposes of determining the bonus to be paid.
Historical baselines may be based either on one year or averaged over multiple years in order to mitigate the potential for a single-year fluctuation in total cost of care that could create an artificially high or low point of comparison in the future. Trend factors may be based on historically observed growth rates in per capita costs, or forward-looking projections, which may depart from historical trends due to changes in policy, fee schedules, or anticipated differences between past and future population health. Trend factors may be based on national projections, more market-specific projections, or even ACO-specific projections. For these and other reasons, a pre-determined benchmark may not be a good estimate of what total cost of care would have been in the absence of the ACO. As a result, estimated savings, and hence bonuses, may not reflect the true savings generated by ACOs if compared to a rigorous assessment of what otherwise would have occurred.
Recent research suggests that an ACO’s benchmark should be set using trend data from providers in similar geographic areas and/or with similar populations instead of using a national market average trend factor.9 It has been observed in Medicare (and other) populations that regions (and therefore possibly ACOs) that start at a lower-than-average cost base tend to have a higher-than-average growth trend. For example, Medicare FFS spending in low-cost regions grew at a rate 1.2 percentage points faster than the national average (2.8 percent and 1.6 percent from 2013 to 2017 compound annual growth rate, respectively). This finding is particularly relevant in low-cost rural communities, where healthcare spending grows faster than the national average.10 Based on this research, some ACO models, such as MSSP and the Next Generation Medicare ACO model, have developed benchmarks based on blending ACO-specific baselines with market-wide baselines. This approach is intended to account for the differences in “status quo” trend, which sponsoring payers may project in the absence of ACO arrangements or associated improvements in care patterns. Some model architects have advocated for this provider-market blended approach to benchmark development because they believe such an approach balances the need to reward providers who improve their own performance with a principle tenet of this model: That ACOs within a market should be held accountable to the same targets (at least in the long term).
The shared savings rate is the percentage of any estimated savings (compared with benchmark) that is paid to the ACO, subject to meeting any requirements for quality performance. For example, an ACO with a savings rate of 50 percent that outperforms its benchmark by 3 percent would keep 1.5 percent of benchmark spend. Under the array of Medicare ACO models, the shared savings rate percentage ranges anywhere from 40 percent to 100 percent.11
In some ACO models, particularly one-sided gain sharing models that do not introduce downside risk, payers impose a minimum savings rate (MSR), which is the savings threshold for an ACO to receive a payout, typically 2 percent, but can be higher or lower.12 For example, assume ACO Alpha has a savings rate of 60 percent and MSR of 1.5 percent. If Alpha overperforms the benchmark by 1 percent, there would be no bonus payout, because the total savings do not meet or exceed the MSR. If, however, Alpha overperforms the benchmark by 3 percent, Alpha would receive a bonus of 1.8 percent of benchmark (60 percent of 3 percent). An MSR is common in one-sided risk agreements to protect the payer from paying out the ACO if modest savings are a result of random variations. ACOs in two-sided risk arrangements may often choose whether to have an MSR.
Both factors impact the payout an ACO receives. Between 2012 and 2018, average earned shared savings for MSSP ACOs were between $1.0M and $1.6M per ACO (between $10 and $100 per beneficiary).13 However, while nearly two out of three MSSP ACOs in 2018 were under benchmark, only about half of them (37 percent of all MSSP ACOs) received a payout due to the MSR.14
1c. Risk corridors
In certain arrangements, payers include clauses that limit an ACO’s gains or losses to protect against extreme situations. Caps depend on the risk-sharing agreement (for example, one-sided or two-sided) as well as the shared savings/loss rate. For example, MSSP Track 1 ACOs (one-sided risk sharing) cap shared savings at the ACO’s share of 10 percent variance to the benchmark, while Track 3 ACOs (two-sided risk sharing) cap shared savings at the ACO’s share of 20 percent variance to the benchmark and cap shared losses at 15 percent variance to the benchmark.15 In contrast with these Medicare models, many Commercial and Medicaid ACO models have applied narrower risk corridors, with common ranges of 3 to 5 percent. In our experience, payers have elected to offer narrower risk corridors. Their choice is based on their desire to mitigate risk as well as the interest of some payers (and state Medicaid programs) to share in extraordinary savings that may be attributable in part to policy changes or other interventions undertaken by the payers themselves, whether in coordination with ACOs or independent of their efforts.
Payers also may vary the level of shared savings (and/or risk), between that which applies to the first dollar of savings (versus benchmark) compared with more significant savings. For example, by applying a 1 percent adjustment or “haircut” to the benchmark, a payer might keep 100 percent of the first 1 percent of savings and share any incremental savings with the ACO at a negotiated shared savings rate. Depending on what higher shared savings rate may be offered in trade for the “haircut,” such a structure has the potential to increase the incentive for ACOs to significantly outperform the benchmark. For example, an ACO that beats the benchmark by 4 percentage points and earns 100 percent of savings after 1 percentage point would net 75 percent of total estimated savings. However, under the same risk model, if the ACO were to beat the benchmark by 2 percentage points, they would only earn 50 percent of total savings. Such a structure could therefore be either more favorable or less favorable than 60 percent shared savings without a “haircut,” depending on the ACO’s anticipated performance.
1d. Frequency of rebasing
In most ACO models (including those adopted by CMS for the Medicare FFS program), the ACO’s benchmark is reset for each performance period based (at least in part) on the ACO’s performance in the immediate prior year. This approach is commonly referred to as “rebasing.” The main criticism of this approach toward ACO model design—which is also evident in capitation rate setting for Managed Care Organizations—is that ACOs become “victims of their own success”: Improvements made by the ACO in one year lead to a benchmark that is even harder to beat in the following year. The corollary is also true: An ACO with “excessive” costs in Year 1 may be setting themselves up for significant shared savings in Year 2 simply by bringing their performance back to “normal” levels.
Even in situations where ACOs show steady improvements in management of total cost of care over several years, the “ratchet” effect of rebasing can have significant implications for the share of estimated savings that flow to the ACO. Exhibit 2 illustrates the shared savings that would be captured by an ACO, if it were to mitigate trend by 2 percentage points consistently for 5 years (assumes linear growth), under a model that provides 50 percent shared savings against a benchmark that is set with annual rebasing. In this scenario, although the ACO would earn 50 percent of the savings estimated in any one year (against benchmark), the ACO would derive only 16 percent of total savings achieved relative to a “status quo” trend.
Exhibit 2
Some ACO model designs (including MSSP) have mitigated this “ratchet” effect, to some extent, by using multi-year baselines, whereby the benchmark for a given performance year is based not on the ACO’s baseline performance in the immediate prior year but over multiple prior years. This approach smooths out the effect of one-year fluctuations in performance on the benchmark for subsequent years; by implication, improvements made by an ACO in Year 1 and sustained in Year 2 create shared savings in both years. Under a three-year baseline, weighted toward the most recent year 60/30/10 percent (as applies to new contracts under the MSSP), the ACO in Exhibit 2 would capture 22 percent of total estimated savings over 5 years. If the model were instead to adopt an evenly weighted three-year baseline, that same ACO would capture 28 percent over 5 years.
In select cases, particularly in the Commercial market, payers and ACOs have agreed to multi-year prospective benchmarks. Under this approach, the benchmark for performance Years 1 to 5 (for example) are set prospectively in Year 0; the benchmarks for Years 2 and 3, for example, are not impacted by the ACO’s performance in Year 1. If this approach were to be applied to the ACO depicted in Exhibit 2, they would earn fully 50 percent of the total savings, assuming that the prospectively established 5-year benchmark was set at the “status quo” trend line. While prospective multi-year benchmarks may be more favorable to ACOs, they also increase the sensitivity of ACO performance to both the original baseline as well as the reasonableness of the prospectively applied trend rate.
Key takeaways
While in many cases healthcare organizations are highly focused on the percent of shared savings they will receive (shared savings rate), in our experience, the financial sustainability of ACO arrangements may be equally or more greatly affected by several other design parameters outlined here, among them: the inclusion of an MSR or a “haircut” to benchmark, either of which may dampen the incentive to perform; benchmark definitions including the use of provider-specific, market-specific, and/or national baseline and trend factors; and the frequency of rebasing, as implied by the use of a single-year or multi-year baseline, or the adoption of prospectively determined multi-year benchmarks.
2. Demand destruction
Although shared savings arrangements are meant to align providers’ incentives with curbing unnecessary utilization, the calculation of bonus payments based on avoided claims costs (as described in Section 1) does not account for the foregone provider revenue (and margins) attached to reductions in patient volume. The economic impact of this reduction in patient volume, sometimes referred to as “demand destruction,” is described in this section, which we address in two parts:
Foregone economic contribution based on reduced utilization in the ACO population; and,
Spillover effects from reduced utilization in the non-ACO population, based on clinical and operational changes that “spillover” from the ACO population to the non-ACO population.
2a. Foregone economic contribution
Claims paid to hospital systems for inpatient, outpatient, and post-acute facility utilization typically comprise 40 to 70 percent of total cost of care, with hospital systems that own a greater share of outpatient diagnostic lab and/or imaging and/or skilled nursing beds falling at the upper end of this range. These same categories of facility utilization may comprise 60 to 80 percent of reductions in utilization arising from improvements in population health management by an ACO. Given the high fixed costs (and correspondingly high gross margins) associated with inpatient, outpatient, and post-acute facilities, foregone facility volume could come at an opportunity cost of 30 to 70 percent of foregone revenue—that opportunity cost being the gross contribution margin associated with incremental patient volume, calculated as revenue less variable costs: Commercially insured ACO populations are more likely to fall into the upper end of this range and Medicaid populations into the lower end. This is the reason savings rates tend to be higher in the Commercial market, to offset the larger (negative) financial impact of “demand destruction.”
For example, a hospital-led ACO that mitigates total cost of care by 3 percent (or $300 based on a benchmark of $10,000 per capita) might forego $180 to $240 of revenue per patient (assuming 60 to 80 percent of savings derived from hospital services), which may represent $90 to $120 in foregone economic contribution, assuming 50 percent gross margins. As this example shows, this foregone economic contribution may represent a significant offset to any bonus paid under shared savings arrangements, unless the shared savings percentage is significantly greater than the gross margin percentage for foregone patient revenue.
For some hospitals that are capacity constrained, the lost patient volume may be replaced (that is, backfilled) with additional patient volume that may be more or less profitable depending on the payer (for example, an ACO that backfills with more profitable Commercial patients). However, the vast majority of hospitals are not traditionally capacity constrained and therefore must look to other methods (for example, growing market share) to be financially sustainable.
In contrast, physician-led ACOs have comparatively little need to consider the financial impact of “demand destruction,” given that they never benefitted from hospitalizations and thus do not lose profits from forgone care. Furthermore, primary care practices may actually experience an increase, rather than decrease, in patient revenue, based on more effective population health management. Even for multi-specialty physician practices that sponsor ACO formation, any reductions in patient volume arising from the ACO may have only modest impact on practice profitability due to narrow contribution margins attached to incremental patient volume. Physician-led ACOs may need to be concerned with “demand destruction” only to the extent that a disproportionate share of savings is derived from reductions in practice-owned diagnostics or other high-margin services; however, the savings derived from such sources are typically smaller than reductions in utilization for emergency department, inpatient, and post-acute facility utilization.
2b. Spillover effects
Though ACOs are not explicitly incentivized to reduce total cost of care of their non-ACO populations (including FFS), organizations often see increased efficiency across their full patient population after becoming an ACO. For example, research over the last decade has found reductions in spend for non-ACO lives between 1 and 3 percent (Exhibit 3).
Exhibit 3
The impact of spillover effects on an ACO’s profitability depends on the proportion of ACO and non-ACO lives that comprise a provider’s patient panel. Further, impact also depends on the ACO’s ability to implement differentiated processes for ACO and non-ACO lives to limit the spillover of the efficiencies. Although conventional wisdom implies that physicians will not discriminate their clinical practice patterns based on the type of payer (or payment), nonetheless many examples exist of hospitals and other providers with the ability to differentiate processes based on payer or payment type. For example, many hospitals deploy greater resources to discharge planning or initiate the process earlier for patients reimbursed under a Diagnosis Related Group (case rate) than for those reimbursed on a per diem or percent of charges model. Moreover, ACOs and other risk-bearing entities routinely direct care management activities disproportionately or exclusively toward patients for whom they have greater financial accountability for quality and/or efficiency. For physician-led ACOs, differentiating resource deployment between ACO- and non-ACO populations may be necessary to achieve a return on investment for new care management or other population health management activities. For hospital sponsors of ACOs that continue to derive the majority of their revenue from FFS populations outside the ACO, differentiating population health management efforts across ACO and FFS populations are of paramount importance to overall financial sustainability. To the extent that hospital-led ACOs are unable to do so, they may find total cost of care financial arrangements to be financially sustainable only if extended to the substantial majority of their patient populations in order to reduce the severity of any spillover effects.
Key takeaways
The adverse impact of “demand destruction” is what most distinguishes the math of hospital-led ACOs from that of physician-led ACOs. The structure of ACO-sponsoring hospitals—whether they own post-acute assets, for example—further shapes the severity of demand destruction, which then provides a point of reference for determining what shared savings percentage may be necessary to overcome the impact of demand destruction. Though in the long term, hospitals may be able to right size capacity, in the near term when deciding to become an ACO, there is often limited ability to alter the fixed-cost base. Finally, the extent of “spillover effects” from the ACO to the non-ACO population further impacts the financial sustainability of hospital-led ACOs. Hospital-led ACOs can seek to minimize the impact through 1) differentiating processes between the two populations, and/or 2) transitioning the substantial majority of their patient population into ACO arrangements.
3. Market share gains
Providers can further improve profitability through market share gains, specifically:
Reduced system leakage through improved alignment of referring physicians across both ACO and non-ACO patients; and,
Improved network status as an ACO.
3a. Reduced system leakage
ACOs can grow market share by coordinating patients within the system (that is, reduce leakage) to better manage total cost of care and quality. This coordination is often accomplished by improving the provider’s alignment with the referring physician; for example, ACOs can establish a comprehensive governance structure and process around network integrity, standardize the referral process between physicians and practices, and improve physician relationships within, and with awareness of, the network. Furthermore, ACOs can develop a process to ensure that a patient schedules follow-up appointments before leaving the physician’s office, optimizing the scheduling system and call center.
Stark Laws (anti-kickback regulations) have historically prevented systems from giving physicians financial incentives to reduce leakage. While maintaining high-quality standards, ACOs are given a waiver to this law and therefore are allowed to pursue initiatives that improve network integrity to better coordinate care for patients. In our experience, hospitals generally experience 30 to 50 percent leakage (Exhibit 4), but ACOs can improve leakage by 10 to 30 percent.
Exhibit 4
3b. Improved network status
In some instances for Commercial payers, an ACO may receive preferential status within a network by entering into a total cost of care arrangement with a payer. As a result, the ACO would see greater utilization, which will improve profitability. For example, in 2012, the Cooley Dickinson Hospital (CDH) and Cooley Dickinson Physician Hospital Organization, a health system in western Massachusetts with 66 primary care providers and 160 specialists, joined Blue Cross Blue Shield of Massachusetts’ (BCBSMA) Alternative Quality Contract (AQC), which established a per-patient global budget to cover all services and expenses for its Commercial population. As a result of joining the AQC, reducing the prices charged for services, and providing high quality of care, CDH was “designated as a high-value option in the Western Mass. Region,” which meant BCBSMA members with certain plans “[paid] less out-of-pocket when they [sought] care” at CDH.16 Other payers have also established similar mutually beneficial offerings to providers who assume more accountability for care.1718 An ACO can benefit from these arrangements up until most or all other provider systems in the same market join.
Key takeaways
These factors to improve market share (at lower cost and better quality) can help an ACO compensate for any lost profits from “demand destruction” (foregone profits and spillover effects) and increased operating costs. The opportunity from this factor, which requires initiatives that focus on reducing leakage, can be the difference between a net-neutral hospital-led ACO and a significantly profitable ACO. An example initiative would be performance management systems that analyze physician referral patterns.
4. Operating costs
Finally, profitability is impacted by operating costs or any additional expenses associated with running an ACO. These costs generally are lower for physician-led ACOs than for hospital-led ACOs (and also depend on buy-versus-build decisions). In our experience, operating costs to run an ACO vary widely depending on the provider’s operating model, cost structure (for example, existing personnel, IT capabilities), and ACO patient population (for example, number and percent of ACO lives). However, we will focus on three specific types of costs:
Care management costs, often variable, or a marginal expense for every life;
Data and analytics operating costs, which can vary widely depending on whether the ACO builds or buys this capability; and
Additional administrative costs, which are fixed or independent of the number of lives.
4a. Care management costs
In our experience, care management costs to operate an ACO range from 0.5 to 2.0 percent of total cost of care for a given ACO population. These care management costs include ensuring patients with chronic conditions are continuously managing those conditions and coordinating with physician teams to improve efficacy and efficiency of care. A core lever of success involves reducing use of unnecessary care. ACOs that spend closer to 2 percent and/or those whose efforts focus on expanding care coordination for high-risk patients struggle to achieve enough economic contribution to break even. This is because care coordination (devoting more resources to testing and treating patients with chronic disease) often does not have a positive return on investment.19 ACOs that do this effectively and ultimately spend less on care management (around 0.5 percent of the total cost of care) tend to create value primarily through curbing unnecessary utilization and steering patients toward more efficient facilities rather than managing chronic conditions. This value creation is particularly true for Commercial ACO contracts, where there is greater price variation across providers compared with Medicare and Medicaid contracts, where pricing is standardized.
4b. Data and analytics operating costs
Data and analytics operating costs are critical to supporting ACO effectiveness. For example, high-performing ACOs prioritize data interoperability across physicians and hospitals and constantly analyze electronic health records and claims data to identify opportunities to better manage patient care and reduce system leakage. ACOs can either build or license data and analytics tools, a decision that often depends on the number of ACO lives. In our experience, an ACO that decides to build its own data and analytics solutions in-house will on average invest around $24M for upfront development, amortized over 8 years for $3M per year, plus $6M in annual costs (for example, using data scientists and analysts to generate insights from the data), for a total of $9M per year. Alternatively, ACOs can license analytics software on a per-patient basis, typically costing 0.5 to 1.5 percent of the total cost of care. Thus, we find the breakeven point at around 100,000 covered ACO lives; therefore, it often makes financial sense for ACOs with more than 100,000 lives to build in-house.
4c. Additional administrative costs
Organizations must also invest in personnel to operate an ACO, typically including an executive director, head of real estate, head of care management, and lawyers and actuaries. The ACO leadership team’s responsibilities often include setting the ACO’s strategy (for example, target markets, lines of business, services offered, through which physicians and hospitals) and developing, managing, and communicating with the physician network to support continuity of care.
Key takeaways
Operating costs to run an ACO are significant. Ability to find ways to invest in fixed costs that are more transformational in nature may result in lower near-term profitability but can provide a greater return on investment in the long term both for the ACO and the rest of the system. The decision to make these investments is dependent on the number of lives covered by an individual ACO.
ACO Archetypes
Drawing on the analysis outlined above, we conducted scenario modeling of “the math of ACOs” using five different ACO archetypes, which vary in structure and performance under a common set of rules. These five archetypes include:
Typical physician-led ACO
Hospital-led ACO with low ACO penetration and low leakage reduction
Hospital-led ACO with high ACO penetration
Hospital-led ACO with high leakage reduction
Hospital-led ACO with high leakage reduction and high ACO penetration
Subsequently, taking an ACO’s structure as a given, we describe for each ACO archetype the key model design parameters and other strategic and operational choices that ACOs might make to maximize their performance.
Comparision of archetypes based on scenario modeling
Summarizing the four factors, the profitability of each archetype reveals certain insights (Exhibit 5).
Hospital system earnings for the second quarter of the year painted a stark picture of how federal relief funding helped offset massive losses in patient volume sparked by the COVID-19 pandemic.
But a full financial recovery may not happen until next year, some analysts warn.
Major hospital systems such as HCA Health and Universal Health Services posted profits in the second quarter despite plummeting volumes sparked by the cancellation of elective procedures and patients avoiding care due to fears of exposure to the virus. A key boost, however, came from a $175 billion fund passed by Congress and loans under the Medicare Accelerated and Advance Payments Program.
“These companies survived the June quarter and exited the quarter with substantial amounts of liquidity,” said Jonathan Kanarek, vice president and senior credit officer for Moody’s Investors Services. “We think [liquidity] is probably the most critical factor for them as far as weathering the storm.”
Congress has approved $175 billion to help prop up providers, of which the Department of Health and Human Services has distributed more than $100 billion.
The Centers for Medicare & Medicaid Services also gave out $100 billion in advance Medicare payments before suspending the program in late April. But the payments are loans that hospitals have to start repaying as soon as this month, as opposed to the congressional funding that does not have to get paid back.
Hospital system earnings illustrated how pivotal the relief funds were to combat massive holes in patient volumes.
Tenet Healthcare, which operates 65 hospitals across the country, reported Monday that it earned in the second quarter adjusted earnings before interest, taxes, depreciation and amortization (EBITDA) of $732 million. But of that $732 million, more than 70% of it was aid from the relief fund.
Tenet wasn’t the only for-profit system where relief funding was a large part of their adjusted EBITDA.
Community Health Systems, which operates 95 facilities, reported an adjusted EBITDA of $454 million in the second quarter. But most of that figure was due to the $448 million that it got from the relief funds.
The provider funding made up a smaller portion of HCA Healthcare’s earnings. The system of 184 hospitals reported that the funding made up 31% of its adjusted EBITDA.
Hospital system volumes greatly declined in April as facilities were forced to cancel elective procedures and patients were scared of going to the hospital.
For example, Tenet’s hospital admissions in April were 33% of what it had in the same month in 2019. But volumes started to recover as shelter-in-place orders expired and some states got a better handle on the pandemic.
Tenet saw admissions grow in June to 90% of what they were in June 2019.
But it remains unclear what hospital finances will look like for the rest of the year. Major systems like Tenet and HCA have scrapped their 2020 financial outlook because of the pandemic.
“We don’t think the shape of this recovery or trajectory will be linear in nature,” Kanarek said. “We think there will be a lot of starts and stops.”
Those starts and stops will depend on the extent of the spread of the virus in an area.
Some states such as Florida, Texas and Arizona have seen massive spikes in the virus in recent weeks, which has put renewed strain on systems. Texas’ governor canceled elective procedures in eight counties back in June, some of which included major cities such as Houston and Dallas.
“I am a little skeptical that we are going to be back to normal before we ultimately have a vaccine,” Kanarek said.
It is also murky on whether hospitals will continue to get more financial help from Congress.
The House passed the HEROES Act more than a month ago that gives providers another $100 billion, but it has stalled in the Senate.
Congress and the White House have been in extensive talks for more than a week on a new relief package. Senate Majority Leader Mitch McConnell released a package last week that had $25 billion in relief funding and lawsuit liability protections for providers.
But even without the additional funding, for-profit hospitals have made some moves to prepare for more shutdowns such as accessing capital markets to add additional lawyers of bank liquidity, Kanarek said.
“We can only hope 2021 will look like a more normal year for hospitals, perhaps more like 2019, but there is still a lot of uncertainty out there,” he said.
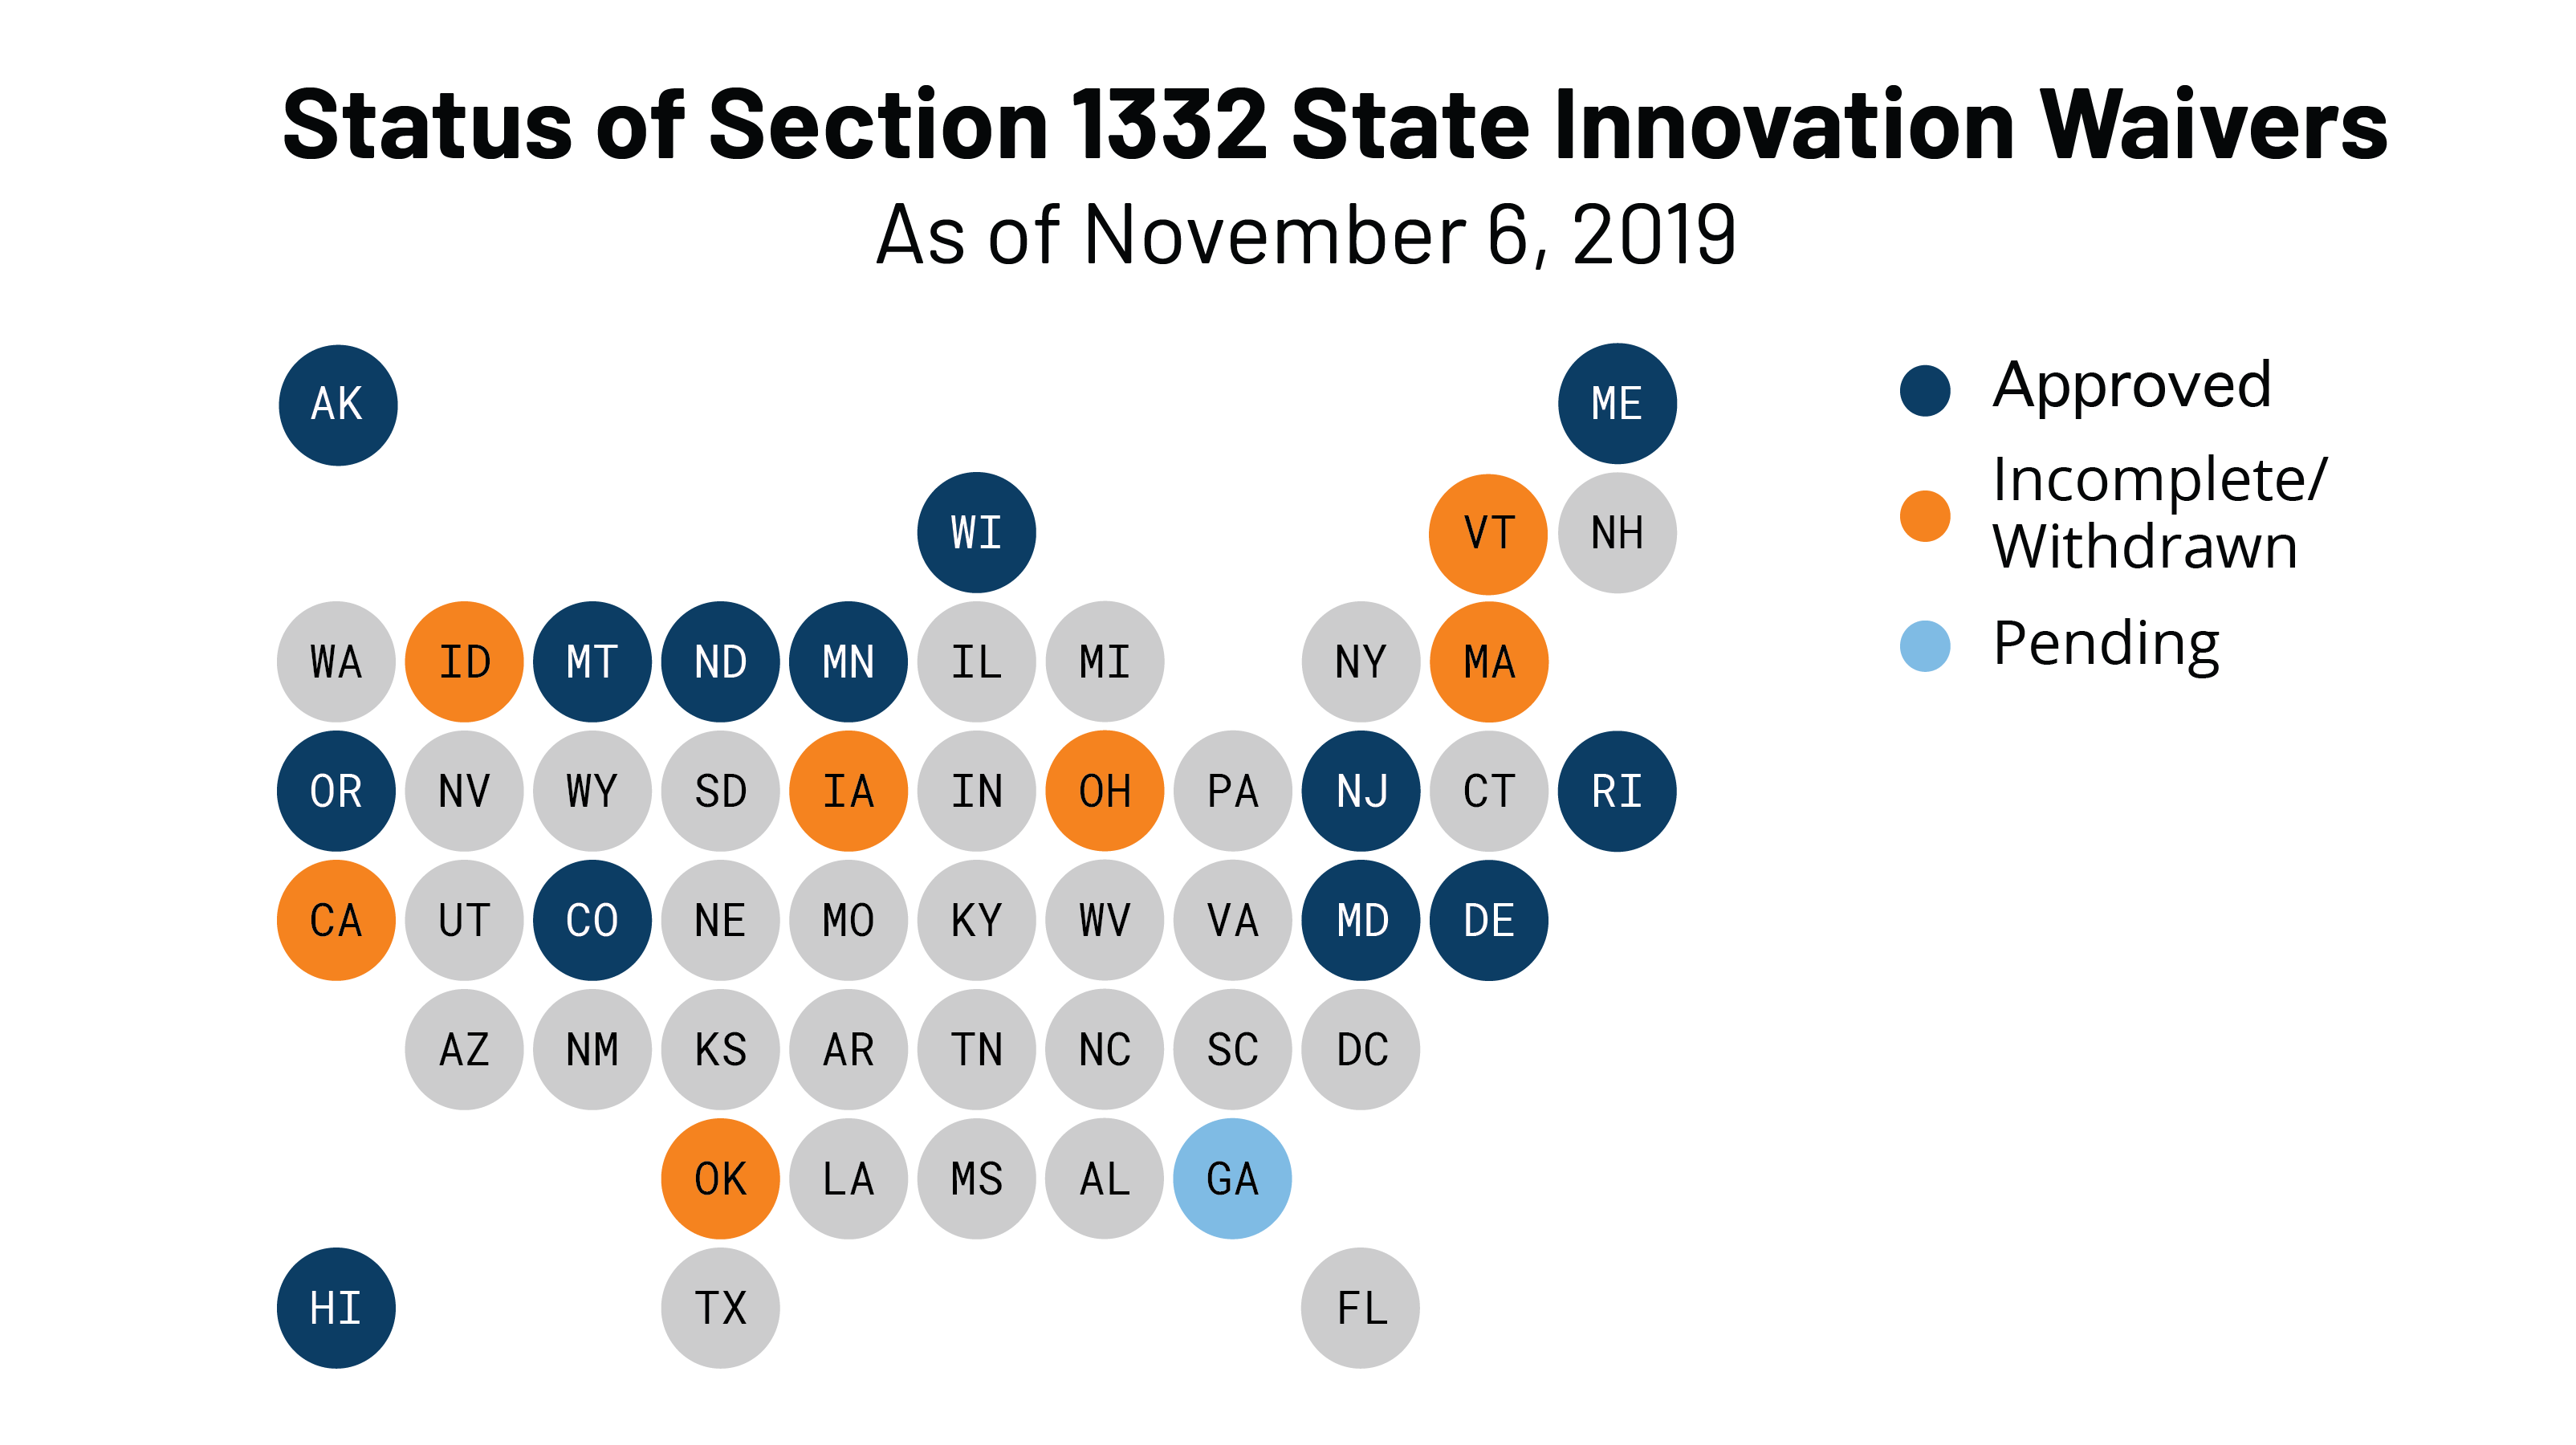
On July 24, 2020, the Centers for Medicare and Medicaid Services (CMS) and the Treasury Department approved Pennsylvania’s waiver application to operate a state-based reinsurance program under Section 1332 of the Affordable Care Act (ACA). This makes Pennsylvania the thirteenth state to be approved for a state-based reinsurance program. This post also summarizes the newest waiver proposal in Georgia.
Pennsylvania’s Waiver And More On Section 1332 Waivers
In late June, Pennsylvania received federal approval for a five-year reinsurance program beginning with the 2021 plan year. The state’s $139.3 million reinsurance program is expected to reduce premiums by about 4.6 percent (relative to what premiums would have been in the absence of the waiver) and increase enrollment in the individual market by about 0.5 percent in 2021. The federal government will contribute $95.1 million while state funds would account for about $44.2 million.
Implementation of the reinsurance program will coincide with a transition away from the federal marketplace to the new state-based marketplace, the Pennsylvania Health Insurance Exchange (Exchange). Both the reinsurance program and the Exchange were created in the same piece of 2019 legislation, which requires the Exchange to assess and collect fees—up to 3.5 percent of total monthly premiums—to support the reinsurance program. Pennsylvania expects to set the initial user fee at 3 percent of total monthly premiums. Each year, the Exchange will collect the user fee from insurers, deduct its operating expenses, and transfer the remaining funds to a reinsurance fund. In making reinsurance payments to insurers, Pennsylvania intends to first exhaust federal pass-through funding and then user fee revenue.
Based on CMS data, Pennsylvania insurers paid HealthCare.gov user fees of about $98.1 million for 2018 and about $83.1 million for 2019. (CMS has released 2018 and 2019 user fee data for each state that uses HealthCare.gov.) User fees in 2018 and 2019 were set at 3.5 percent of premiums, although the federal user fee was reduced to 3 percent for 2020.
Like nearly all states with reinsurance programs, Pennsylvania will use an overall attachment point model with parameters set annually by the insurance department. For 2021, the program is expected to reimburse insurers for 60 percent of claims between $60,000 and $100,000. To ensure program flexibility, the insurance department can make payments on a pro rata basis if funding is insufficient. Pennsylvania also intends to leverage the EDGE server maintained by CMS to determine how much each insurer is due. (This issue—whether and how states could leverage EDGE server infrastructure for reinsurance—has come up in at least one other state as well.)
Pennsylvania’s waiver application was submitted on February 11 and deemed complete on March 12. Federal regulators received and considered two supportive comments on the state’s application. In an approval letter to Commissioner Jessica Altman on July 24, the Departments laid out specific terms and conditions that the state must accept within 30 days for the waiver to go into effect. Once the waiver is accepted, the Departments will notify Pennsylvania of its amount of pass-through funding for 2021.
With Pennsylvania, 14 states have approved Section 1332 waivers. All but one approved waiver has been for a state-based reinsurance program, and CMS released a report on the effect of the 12 already-established state-based reinsurance programs. The report identifies the funding source for each state, program parameters, the impact on premiums by state and year, insurer participation, and enrollment. The average premium reduction for 2020 across all states was 17.7 percent. New Hampshire may be soon added to this list for 2021: the state’s waiver application was submitted in late April.
Latest On Georgia’s Waiver Application
Georgia submitted a waiver application in late December 2019. As discussed more here, Georgia’s application had two phases: phase one is for a reinsurance program and phase two involves much broader changes to the state’s individual market known as the “Georgia Access” model. Phase one was deemed complete on February 6, and review of phase two was “paused” to Georgia leaders could submit additional information.
Under the original Georgia Access Model, Georgia would have eliminated the use of HealthCare.gov, transitioned consumers to decentralized enrollment through private web-brokers and insurers, established its own subsidy structure, enabled the subsidization of plans that do not comply with all the ACA’s requirements, and capped enrollment if subsidy costs exceed federal and state funds. The proposal was criticized for jeopardizing access to comprehensive coverage and failing to satisfy Section 1332’s statutory guardrails.
About five months after review was “paused,” Georgia modified its waiver application, requesting that its reinsurance program be approved for 2022 (rather than 2021) and abandoning some initial components of phase two. The new waiver application was posted in early July and exposed for public comment until July 23.
The main change for phase two is that Georgia would no longer develop its own state-specific subsidy structure. Georgia would validate a consumer’s eligibility for premium tax credits and then send this information to the federal government. The federal government would then issue the subsidies to insurers and reconcile subsidies during tax season. Subsidies would only be available for qualified health plans under the ACA, as they are now. But Georgia wants to conduct its own eligibility determinations because it believes doing so will be more accurate: the state can leverage existing infrastructure, use more recent employment data, and integrate Medicaid eligibility determinations.
The waiver would, however, still eliminate the use of HealthCare.gov, which would make Georgia the only state to do so. Marketplace consumers would be forced to transition to a highly decentralized enrollment system that uses web-brokers and insurers. As a summary of the revised application puts it, Georgia will “transition responsibility for front-end functions of consumer outreach, customer service, plan shopping, selection, and enrollment from the [federal marketplace] to the commercial market.”
While federal subsidies could not be used towards non-ACA plans, Georgia continues to note that a benefit of moving away from HealthCare.gov to web-brokers and insurers is that residents could “view the full range of health plans” offered in the state. Georgia would leverage enhanced direct enrollment (EDE) standards which, as discussed more below, can lead to significant consumer confusion.
From here, Georgia will presumably respond to the latest round of public comment on its new proposal and then submit its revised application.
Starting this month, some providers are facing the prospect of their Medicare payments garnished to repay COVID-19 loans.
The pressing Aug. 1 deadline has sparked concerns from some experts and hospital groups that worry providers couldn’t afford to lose out on Medicare revenue as they combat revenue losses caused by the pandemic. While the program was intended to be a short-term solution, COVID-19 surges are proving that is not the case for some hospitals.
At the onset of the pandemic in March, the Centers for Medicare & Medicaid Services (CMS) extended the advance payment program, which has been used previously to help providers beset by disasters such as hurricanes. Providers and suppliers could apply for advance Medicare payments to offset massive losses sparked by declines in patient volumes due to COVID-19.
Most providers could get up to 100% of their Medicare payments for a three-month period, and inpatient acute care hospitals, children’s hospitals and some cancer hospitals can request up to 100% for a six-month period. Critical access hospitals could have gotten up to 125% over six months.
CMS had given out $100 billion of loans before suspending the program.
“It was very effective because the process was already in place,” said Denise Burke, a partner with the healthcare compliance and operations group for law firm Waller Lansden Dortch & Davis.
The goal behind the program is to help providers stay afloat and was meant to be a short-term solution, as repayment starts 120 days after a provider gets the first payment. But that is the problem, experts say.
“It was intended as a short-term bridge so they could get through the summer before everything returned to normal, only problem is nothing has returned to normal,” said Dan Mendelson, founder and former president of consulting firm Avalere Health.
Now, repayment for the first loans are due on Aug. 1 as more and more states are seeing massive surges of COVID-19. Some major hospital systems, such as HCA and CHS, have been able to offset massive declines in revenue thanks to the loans and money from a $175 billion provider relief fund passed by Congress.
Hospitals have one year from the date of the accelerated payment to repay the balance of the loan, but Medicare Part A providers and Part B suppliers have 210 days from the accelerated payment to repay.
“CMS should think about relative to financial position of the provider,” Mendelson said. “Some providers are doing just fine and can repay loans just like everybody else.”
After the 120-day period is up, CMS will take 100% of Medicare claims payments that would have gone to the provider to offset the balance of the loan.
But it remains unclear whether CMS can change the terms of the repayment to give providers and suppliers more time, especially if they are struggling.
“CMS moves deadlines all the time,” Mendelson said. “The question is whether they can or are willing to exercise this discretion in this case.”
It also is unlikely that CMS will resume the program, which some provider groups have also called for.
“It seems unlikely CMS will continue to allocate money through the advance payment program that has fewer terms and conditions than allocating through provider relief fund,” Burke said, referring to the $175 billion fund that Health and Human Services is still allocating.
CMS did not return a request for comment as of press time.
A major problem for some hospitals is they may not have the liquidity available to repay the loans.
“There are a lot of hospitals struggling right now because volumes are off,” Mendelson said. “This comes down to the fact that people are staying away from the hospital to the extent they possibly can.”
Provider groups such as the American Hospital Association are imploring Congress to forgive the loans, or at the very least change the repayment terms.
For instance, some groups want to lower the interest rates to 50 or 25% of a Medicare payment as opposed to 100%.
But talks on a new COVID-19 relief package have stalled so far no deal has emerged.
Senate Republicans released their own package earlier this week that includes another $25 billion for providers and gives liability protections for hospitals and other businesses. But the package doesn’t include changes to the loans.
Reversing a three-year decline, the number of people covered by Medicaid nationwide rose markedly this spring as the impact of the recession caused by the outbreak of COVID-19 began to take hold.
Yet, the growth in participation in the state-federal health insurance program for low-income people was less than many analysts predicted. One possible factor tempering enrollment: People with concerns about catching the coronavirus avoided seeking care and figured they didn’t need the coverage.
Program sign-ups are widely expected to accelerate through the summer, reflecting the higher number of unemployed. As people lose their jobs, many often are left without workplace coverage or the money to buy insurance on their own.
Medicaid enrollment was 72.3 million in April, up from 71.5 million in March and 71 million in February, according to the latest enrollment figures released last week by the Centers for Medicare & Medicaid Services. The increase in March was the first enrollment uptick since March 2017.
About half of the people enrolled in Medicaid are children.
The increases varied widely around the country. Kentucky had the largest jump at nearly 7% from March to April. In addition, enrollment rose to 1.4 million in April from 1.2 million in February, according to the CMS data. That has continued, and today it’s up to 1.5 million, state officials said in an interview.
Kentucky has an aggressive outreach strategy using email or phone calls to contact thousands of residents who applied for state unemployment insurance, designed to make sure they know about Medicaid. “It’s been very effective, and in the past few weeks we’ve been enrolling 8,000 to 10,000 people a week,” said Eric Friedlander, secretary of the Kentucky Cabinet for Health and Family Services, which oversees Medicaid.
The Bluegrass State has also made enrollment easier by developing a one-page online form instead of having people fill out a 20-page application, he added.
“This is the right thing to do to help people get signed up for health care coverage and it supports the health industry in our state,” Friedlander said. “The health industry would collapse without Medicaid.”
Joan Alker, executive director of the Center for Children and Families at Georgetown University in Washington, D.C., said she expects Medicaid enrollment to keep rising this summer. “Given that there are no signs that the virus is coming under control anytime soon, job losses will become more permanent, and more folks will become eligible for Medicaid over time,” she said.
One reason Medicaid numbers have not grown faster, she suggested, is because people have more immediate needs than securing health coverage, especially if they are feeling well.
Many people are worried about getting unemployment insurance or getting evicted from their home, she noted. “That’s combined with the fact that many people are reluctant to go to their doctor because of safety concerns,” she said. “And, as a consequence, applying for Medicaid may not be at the top of their list.”
Chris Pope, a senior fellow at the Manhattan Institute for Policy Research, a conservative think tank, said the slower-than-expected growth in Medicaid could signal that people who were laid off had coverage through a spouse or a parent.
In addition, he said, “many jobs that went away did not offer health insurance,” citing millions of service-sector positions in industries such as hotels and restaurants that have been lost.
Beyond the surge in unemployment, Medicaid rolls have risen because states cannot discontinue coverageto people enrolled as of March 18, 2020, as a condition of receiving higher federal Medicaid funding included in a coronavirus relief package passed by Congress.
Medicaid is a countercyclical program, meaning enrollment typically rises during an economic downturn. But that forces states to face the fiscal challenge of paying for their share of the program even as tax revenue dries up.
An exception to this rule was the jump in enrollment starting in 2014 when the Affordable Care Act allowed states to expand Medicaid to cover everyone with incomes below 138% of the federal poverty level, or about $17,609 for an individual this year.
Enrollment soared by about 15 million people from 2014 to 2017, peaking at about 75 million as nearly three dozen states expanded the program. Since then, a strong economy and steadily declining unemployment levels led to a drop in Medicaid rolls until April.
Nevada and Oklahoma posted nearly 4% enrollment growth rates between March and April’s data.
Florida’s Medicaid numbers jumped to 3.7 million in April from 3.6 million in March, nearly a 2.5% increase, the CMS data showed. Since then, Florida data shows enrollment has topped 4.1 million.
The Trump administration has been criticized by consumer advocates for not establishing a national campaign to promote Medicaid during the economic downturn and health crisis.
One indicator that Medicaid enrollment is still going up is the growing number of recipients in managed care plans in 16 states that reported data from March to May. Those plans have increased by a total of nearly 4%, according to a KFF report. (KHN is an editorially independent program of KFF.) Most states have shifted many of their Medicaid enrollees into these private health plans.
KFF estimated that nearly 13 million people who became uninsured after losing their jobs in March are eligible for Medicaid.
Robin Rudowitz, a KFF vice president, said there is typically a lag time of weeks or months before people who have lost their jobs and health coverage seek to enroll in Medicaid. The impact on Medicaid enrollment also lasts well after the immediate effect of a downturn, she said.
Returning COVID patients to unprepared facilities a “recipe for disaster”
As Florida becomes the new epicenter of the COVID-19 outbreak in the U.S., the state is trying to ensure that nursing homes and rehabilitation facilities aren’t quickly overwhelmed by patients still suffering from the disease.
So far, it has dedicated 11 facilities solely to COVID patients who need post-acute or long-term care: those who can’t be isolated at their current facilities, as well as those who’ve gotten over the worst of their illness and who can be moved to free up hospital beds for the flow of new patients.
One of those facilities is Miami Medical Center, which was shuttered in October 2017 but now transformed to care for 150 such patients. In total, the network of centers will handle some 750 patients.
“We recognize that that would be something that would be very problematic, to have COVID-positive nursing home residents be put back into a facility where you couldn’t have proper isolation,” Florida Gov. Ron DeSantis (R) said during a press briefing last week. “[That] would be a recipe for more spread, obviously more hospitalizations and more fatalities, and so we prohibited discharging COVID-positive patients back into nursing facilities.”
Whether 750 beds will be enough to accommodate the state’s needs remains a question, but it’s a necessary first step, given testing delays that in some cases stretch more than a week. Experts have warned that patients recovering from COVID shouldn’t be transferred to a facility without being tested first.
Without dedicated facilities, hospitals in Florida in dire need of beds for new patients might have had no other choice.
Key Role for Testing
There are no national data on the percentage of hospitalized COVID-19 patients who need rehabilitation or skilled nursing care after their hospital stay.
In general, about 44% of hospitalized patients need post-acute care, according to the American Health Care Association and its affiliate, the National Center for Assisted Living, which represent the post-acute and long-term care industries.
But COVID has “drastically changed hospital discharge patterns depending on local prevalence of COVID-19 and variations in federal and state guidance,” the groups said in an email to MedPage Today. “From a clinical standpoint, patients with COVID-19 symptoms serious enough to require hospitalization may be more likely to require facility or home-based post-acute medical treatment to manage symptoms. They also may need rehabilitation services to restore lost function as they recover post-discharge from the acute-care hospital.”
The level of post-acute care these patients need runs the spectrum from long-term acute care hospitals and inpatient rehabilitation facilities to skilled nursing facilities and home health agencies.
The variation is partly due to the heterogeneity of the disease itself. While some patients recover quickly, others suffer serious consequences such as strokes, cardiac issues, and other neurological sequelae that require extensive rehabilitation. Others simply continue to have respiratory problems long after the virus has cleared. Even those who are eventually discharged home sometimes require home oxygen therapy or breathing treatments that can require the assistance of home health aides.
Yet post-acute care systems say they haven’t been overwhelmed by a flood of COVID patients. Several groups, including AHCA, NCAL, and the American Medical Rehabilitation Providers Association (AMRPA) confirmed to MedPage Today that there’s actually been a downturn in post-acute care services during the pandemic.
That’s due to a decline in elective procedures, the societies said, adding that demand is starting to pick back up and that systems will need to be in place for preventing COVID spread in these facilities.
Testing will play a key role in being able to move patients as the need for post-acute care rises, specialists told MedPage Today.
“You shouldn’t move anyone until you know a status so that the nursing facility can appropriately receive them and care for them,” said Kathleen Unroe, MD, who studies long-term care issues at the Regenstrief Institute and Indiana University in Indianapolis.
AHCA and NCAL said they “do not support state mandates that require nursing homes to admit hospital patients who have not been tested for COVID-19 and to admit patients who have tested positive. This approach will introduce the highly contagious virus into more nursing homes. There will be more hospitalizations for nursing home residents who need ventilator care and ultimately, a higher number of deaths.”
Earlier this week, the groups sent a letter to the National Governors Association about preventing COVID outbreaks in long-term care facilities. They pointed to a survey of their membership showing that, for the majority, it was taking 2 days or longer to get test results back; one-quarter said it took at least 5 days.
Hospitals can conduct their own testing before releasing patients, and this has historically provided results faster than testing sites or clinical offices, especially if they have in-house services. However, demand can create delays, experts said.
Preparing for the Future
Jerry Gurwitz, MD, a geriatrician at the University of Massachusetts Medical School in Worcester, says now is the time to develop post-acute care strategies for any future surges.
Gurwitz authored a commentary in the Journal of the American Geriatrics Society on an incident in Massachusetts early in the pandemic where a nursing home was emptied to create a COVID-only facility, only to have residents test positive after the majority had already been moved.
“We should be thinking, okay, what are the steps, what’s the alternative to emptying out nursing homes? Can we make a convention center, or part of it, amenable to post-acute care patients?” Gurwitz said. “Not just a bed to lie in, but possibly providing rehabilitation and additional services? That could all be thought through right now in a way that would be logical and lead to the best possible outcomes.”
Organizations can take the lead from centers that have lived through a surge, like those in New York City. Rusk Rehabilitation at NYU Langone Health created a dedicated rehabilitation unit for COVID-positive patients.
“We were able to bring patients out from the acute care hospital to our rehabilitation unit and continue their COVID treatment but also give them the rehabilitation they needed” — physical and occupational therapy (PT/OT) — “and the medical oversight that enhanced their recovery and got them out of the hospital quicker and in better shape,” Steven Flanagan, MD, chair of rehabilitation medicine at NYU Langone, said during an AMRPA teleconference.
Flanagan noted that even COVID patients who can be discharged home will have long-term issues, so preparing a home-based or outpatient rehabilitation program will be essential.
Jasen Gundersen, MD, chief medical officer of CareCentrix, which specializes in post-acute home care, said there’s been more concern from families and patients about going into a facility, leading to increased interest in home-based services.
“We should be doing everything we can to support patients in the home,” Gundersen said. “Many of these patients are elderly and were on a lot of medications before COVID, so we’re trying to manage those along with additive medications like breathing treatments and inhalers.”
Telemedicine has played an increasing role in home care, to protect both patients and home health aides, he added.
Long-term care societies have said that emergency waivers implemented by CMS have been critical for getting COVID patients appropriate levels of post-acute care, and they hope these remain in place as the pandemic continues.
For instance, CMS relaxed the 3-hour therapy rule and the 60% diagnostic rule, Flanagan said. Under those policies, in order to admit a patient to an acute rehabilitation unit, facilities must provide 3 hours of PT/OT every day, 5 days per week.
“Not every COVID patient could tolerate that level of care, but they still needed the benefit of rehabilitation that allowed them to get better quicker and go home faster,” he said.
Additionally, not every COVID patient fits into one of the 13 diagnostic categories that dictate who can be admitted to a rehab facility under the 60% rule, he said, so centers “could take COVID patients who didn’t fit into one of those diagnoses and treat them and get them better.”
AHCA and NCAL said further waivers or policy changes would be helpful, particularly regarding basic medical necessity requirements for coverage within each type of post-acute setting.
But chief among priorities for COVID discharges to post-acute care remains safety, the groups said.
“The solution is for hospital patients to be discharged to nursing homes that can create segregated COVID-19 units and have the vital personal protective equipment needed to keep the staff safe,” they said. “Sending hospitalized patients who are likely harboring the virus to nursing homes that do not have the appropriate units, equipment and staff to accept COVID-19 patients is a recipe for disaster.”
New report finds the growth of telemedicine visits has plateaued and accounts for a relatively small percentage of rebounding ambulatory care.
On Monday, 340 organizations signed a letter urging Congress to make telehealth flexibilities created during the COVID-19 pandemic, permanent.
Those signing the letter include national and regional organizations representing a range of healthcare stakeholders in all 50 states, the District of Columbia and Puerto Rico.
Congress quickly waived statutory barriers to allow for expanded access to telehealth at the beginning of the COVID-19 pandemic, providing federal agencies with the flexibility to allow healthcare providers to deliver care virtually.
Stakeholders also want Congress to remove restrictions on the location of the patient to ensure that all patients can access care at home, and other appropriate locations; to maintain and enhance HHS authority to determine appropriate providers and services for telehealth; ensure federally qualified health centers and rural health clinics can furnish telehealth services after the public health emergency; and make permanent the Health and Human Services temporary waiver authority for future emergencies.
While federal agencies can address some of these policies going forward, the Centers for Medicare and Medicaid does not have the authority to make changes to Medicare reimbursement policy for telehealth under current law, stakeholders said.
In a statement separate from the letter to Congress, Lux Research Associate Danielle Bradnan said key concerns for legislators are broadband internet access, payer reimbursement and licensure barriers, since, currently, medical licenses are only valid for specific states.
WHY THIS MATTERS
If Congress does not act before the COVID-19 public health emergency expires, current flexibilities will disappear, according to stakeholders.
The PHE is scheduled to expire in July.
In a tweet late yesterday, Michael Caputo, the assistant secretary of the Department of Health and Human Services for public affairs, said HHS is expected to renew the PHE before it expires. It has already been renewed once.
THE LARGER TREND
The use of telehealth has skyrocketed under in-person restrictions under COVID-19.
Private health plans have followed suit, the letter said, resulting in a 4,300% year-over-year increase in claims for March 2020.
However, a new report from the Commonwealth Fund has found that the growth of telemedicine visits has plateaued and account for a relatively small percentage of rebounding ambulatory care services.
As states experiment with reopening – and re-closing – their economies in response to concerns around rising coronavirus cases, the report found that telemedicine visits have actually been declining since April.
About half of all facilities have yet to be inspected for procedures to stop the spread of coronavirus.
Thousands of nursing homes across the country have not been checked to see if staff are following proper procedures to prevent coronavirus transmission, a form of community spread that is responsible for more than a quarter of the nation’s Covid-19 fatalities.
Only a little more than half of the nation’s nursing homes had received inspections, according to data released earlier this month, which prompted a fresh mandate from Medicare and Medicaid chief Seema Verma that states complete the checks by July 31 or risk losing federal recovery funds.
A POLITICO survey of state officials, however, suggests that the lack of oversight of nursing homes has many roots. Many states that were hit hard by the virus say they chose to provide protective gear to frontline health workers rather than inspectors, delaying in-person checks for weeks if not months. Some states chose to assess facilities remotely, conducting interviews over the phone and analyzing documentation, a process many experts consider inadequate.
In places where state officials claimed that in-person inspections have taken place, the reports found no issues in the overwhelming majority of cases, even as Covid-19 claimed more than 31,000 deaths in nursing homes.Less than 3 percent of the more than 5,700 inspection surveys the federal government released this month had any infection control deficiencies, according to a report on Thursday by the Center for Medicare Advocacy, a nonprofit patient activist group.
“It is not possible or believable that the infection control surveys accurately portray the extent of infection control deficiencies in U.S. nursing facilities,” the report states.
Noting the vast and unprecedented danger that the coronavirus presents to the elderly and people with disabilities, patient advocates described the lack of inspections as a shocking oversight.
“If you’re not going in, you’re essentially taking the providers’ word that they’re doing a good job,” said Richard Mollot, the executive director of the Long Term Care Community Coalition.
In March, the Trump administration paused routine nursing home inspections, which typically occur about once a year. Instead, the Centers for Medicare and Medicaid Services asked that state agencies focus on inspecting facilities for their infection control practices, such as whether staff wash their hands or properly wear protective clothing before tending to multiple patients.
But for more than two months, state inspectors failed to enter half the country’s homes — a revelation that prompted CMS to crack down.
“We are saying you need to be doing more inspections,” Verma told reporters, explaining her message to states. “We called on states in early March to go into every single nursing home and to do a focused inspection around infection control.”
In some hard-hit states, inspectors conducted remote surveys rather than going into nursing homes, a process that involved speaking to staff by phone and reviewing records. In Pennsylvania, for example, inspectors conducted interviews and reviewed documents for 657 facilities from March 13 to May 15 — most of which was done remotely.
But critics say the failure to make in-person checks prevented states from identifying lapses at a crucial time. The fact that family members were blocked from visiting their relatives — a policy intended to prevent the virus from entering the facility — removed another source of accountability in homes, some of which ended up having more than halfof their residents stricken with the coronavirus.
Keeping relatives out of nursing homes — a policy that continues— has made it more difficult to advocate on behalf of residents in the state, said Karen Buck, executive director of the Pennsylvania-based SeniorLAW Center. More than 4,000residents ofnursing homes and other personal care facilities have died of coronavirus in the Keystone State.
“The inspections are vital,” said Buck. “I think access to residents is essential, and we are very concerned that Pennsylvanians are behind where we should be. We recognize these are very difficult times for our leaders, but we can’t continue to wait.”
Pennsylvania officials maintained that the remote inspections were beneficial, and said they went into the facilities when they felt there was significant concern over residents’ health.
“We can conduct the same interviews, review the same documentation and do all the same actions we could in person, except for the ability to be on-site,”health department spokesperson Nate Wardle wrote in an email, adding that Verma’s office approved the remote procedures earlier this spring.
Nonetheless, many public health experts say they believe states have erred in choosing not to prioritize nursing home inspectors when handing out protective equipment. While it makes sense to direct resources to front-line workers, nursing home inspectors were only a tiny number of people compared to the hundreds of thousands of hospital employees — and experts contend that the situation in nursing facilities was dire enough to require immediate action.
David Grabowski, an expert in aging and long-term care at Harvard Medical School, said he understands inspectors were put in a tough position in the early days of the pandemic, but that inspections needed to be ramped up within a few weeks.
“I think after those first few weeks we should have had personal protective equipment in place for the inspectors and doing these inspections remotely is really second best,” he said.
And yet state after state waited on inspections or performed them remotely.
In Utah, only a small portion of the state’s nearly 100 facilities received inspections over the first three months of the pandemic. Only now is the state health department ramping up on-site inspections, with the goal of hitting all of its nursing homes by the second week of July. It conducted 14 last week, and received some help from federal inspectors with another four.
The state survey agency said it made a conscious determination not to request protective equipment for state inspectors in the initial phase of the pandemic, fearing they would take supplies away from frontline health providers, said Greg Bateman, the head of long-term care surveys. Instead, the department conducted 43 remote reviews and talked to nursing homes at least twice a week.
In Idaho,state inspectors have only recently received the N95 masks, face shields and gowns necessary to perform inspections.
“The reason we had difficulty is because Idaho, like many other states, was challenged to secure adequate PPE to meet the needs of the various health care entities,” health department spokesperson Niki Forbing-Orr wrote in an email. “The state surveyors had concerns about potentially using PPE that other entities could use that provide direct medical services and care to Idaho residents.”
In New Jersey, which has seen roughly 6,000 deaths in nursing homes and other communal settings, the health department also first chose sending supplies to frontline workers in nursing homes and hospitals.The state began making in-person checks when it received PPE April 16, said Dawn Thomas, a New Jersey health department spokesperson.
But New Jersey still has a long way to go. The state has completed inspections in only about 115 out of more than 360 nursing homes as of June 3, according to Thomas.
While Pennsylvania, Idaho, New Jersey and other states complained of a lack of PPE, other states battling major outbreaks of coronavirus in nursing homes have completed nearly all of their inspections, calling into question the explanations for why others have struggled.
Washington state, where the Life Care Center of Kirkland became an early epicenter of the coronavirus outbreak, has completed 99 percent of its inspections, the state reported this spring to CMS. And Michigan, which has had nearly 2,000 deaths in nursing homes, has completed nearly 85 percent of its inspections.
By contrast, states such as West Virginia and Maryland, with only 11.4 and 16.4 percent of facilities inspected as of the end of May, lagged way behind.
A nursing home in Maryland’s Carroll County served as an early example of just how quickly the coronavirus can ravage nursing homes. On March 26, a resident at a Carroll County, Md., facility tested positive for the coronavirus. Two weeks later, the number of confirmed cases was up to 77 out of 95 residents, along with 24 staff members. At least 28 residents have died.
A Maryland health department spokesperson says the state took “early and aggressive measures” to address the virus in nursing homes, noting that Maryland created the country’s first strike teams — composed of state and local health officials, medical professionals and National Guard members — to help triage seniors and scrutinize facilities.
Nonetheless, state inspectors didn’t have personal protective equipment until late April, according to the health department.
“In April, PPE acquisition was challenging across the nation and in Maryland due to the rapidly evolving Covid-19 pandemic,” the spokesperson wrote in an email, adding that the department sought N95 masks, gowns and other items from “the national stockpile, FEMA and national and international supply chains.”
With many facilities still closed to visitors, the slow pace of inspections lost a key window into the nursing homes during the pandemic.
“I think having more eyes on what’s happening is really important,” Grabowski said.
Last month, the Health and Human Services’ watchdog agency announced plans to review the pace of inspections in nursing homes and barriers to completing them — referring to such checks as a “fundamental safeguard to ensure that nursing home residents are safe and receive high-quality care.”
“There is no substitute for boots on the ground — for going into a facility to assess whether a facility is abiding by long-standing infection control practices,” Verma told reporters this month.